Forecasting of Volatile Assets using Artificial Swarm Intelligence
←
→
Page content transcription
If your browser does not render page correctly, please read the page content below
Forecasting of Volatile Assets using Artificial Swarm
Intelligence
Louis Rosenberg Gregg Willcox Martti Palosuo Ganesh Mani
Unanimous AI Unanimous AI Judge Business School Carnegie Mellon University
San Francisco, USA San Francisco, USA University of Cambridge Pittsburgh, USA
louis@unanimous.ai gregg@unanimous.ai Cambridge, UK ganeshm@andrew.cmu.edu
prm50@jbs.cam.ac.uk
Abstract— Swarm Intelligence (SI) is a natural process that has Results showed a 36% increase in forecasting accuracy when
been shown to amplify decision-making accuracy in many social participants used ASI as compared to traditional methods [20].
species, from schools of fish to swarms of bees. Artificial Swarm
Intelligence (ASI) is a technology that enables similar benefits in While prior studies have shown ASI to significantly amplify
networked human groups. The present research tests whether ASI the group accuracy in controlled settings, the present work
enables human groups to reach more accurate financial forecasts. assesses whether swarm-based forecasting of highly volatile
Specifically, a group of MBA candidates at Cambridge University assets (mostly so-called cult or meme stocks), achieves similar
was tasked with forecasting the three-day price change of 12 improvements. To address this, a nine-week pilot study tasked a
highly volatile assets, a majority of which were cult (or meme) group of MBA candidates at Cambridge University with making
stocks. Over a period of 9 weeks, human forecasters who averaged weekly forecasts of 12 high-volatility assets, comparing
+0.96% ROI as individuals amplified their ROI to +2.3% when individual forecasts to swarm-based predictions. Performance
predicting together in artificial swarms (p=0.128). Further, a was also compared to traditional Wisdom of Crowd methods.
$5,000 bankroll was managed by investing in the top three buy
recommendations produced each week by ASI, which yielded a II. BACKGROUND
2.0% ROI over the course of the 9-week study. This suggests that
swarm-based forecasting has the potential to boost the A. Swarm Intelligence (SI)
performance of financial traders in real-world settings. The decision-making process that governs honeybee swarms
has been researched since the 1950s and has been shown at a
Keywords—Artificial Swarm Intelligence, Swarm Intelligence, high level to be quite similar to decision-making in neurological
Human Forecasting, Financial Forecasting, Investing, Group brains [15,16]. Both employ populations of simple excitable
Forecasting, Cult Stocks, Meme Stocks, Collective Intelligence, units (i.e., neurons and bees) that work in parallel to integrate
Wisdom of Crowds, Human-Machine Teaming. noisy evidence, weigh competing alternatives, and converge on
I. INTRODUCTION decisions in real-time. In both brains and swarms, outcomes are
arrived at through competition among groups of excitable units.
It is well known that groups of forecasters can outperform In honeybees, this enables hundreds of scout bees to collect
individuals by aggregating estimates using statistical methods information about their local environment and then deliberate in
[1-3]. Often called the Wisdom of Crowds (WoC) or Collective synchrony, converging on a single optimal decision [17-20].
Intelligence (CI), this phenomenon was first observed over a
century ago and has been applied to many fields. The most In the natural world, swarming organisms establish real-time
common methods involve polling human groups and then feedback loops among group members. To achieve this among
aggregating their input as a simple or weighted mean [4]. groups of networked humans, ASI technology allows distributed
users to form closed-loop systems moderated by swarming
Recently, a new method has been developed that is not based algorithms [5-9]. The goal is to enable groups of distributed
on aggregating input from isolated individuals but involves users to work in parallel to (a) integrate noisy evidence, (b)
synchronous groups of forecasters working together as real-time weigh competing alternatives, and (c) converge on decisions in
systems. Known as Artificial Swarm Intelligence (ASI) or synchrony, while also allowing all participants to perceive and
Swarm AI, this method has been shown in numerous studies to react to the changing system in real-time, thereby closing a
significantly increase the accuracy of group forecasts [5-13]. feedback loop around the full population of participants.
In a recent study at the Stanford University School of B. Swarm Software
Medicine, groups of doctors were asked to review chest X-rays
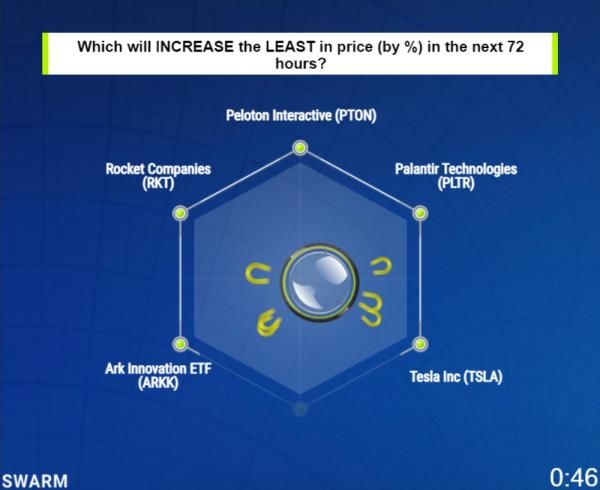
and predict the likelihood that each patient had pneumonia. The software used to enable ASI in this study is called the
When working together in artificial swarm, diagnostic errors Swarm® platform from Unanimous AI and is shown in Figure 1.
were reduced by over 30% [14]. In another study, groups of Using this software, groups answer questions in real time by
financial traders were asked to predict common market collaboratively moving a graphical puck to select among a set of
indicators including the price of gold, oil, and the S&P 500. answer options. Each participant provides input by moving a
graphical magnet to pull on the puck, thereby imparting their
XXX-X-XXXX-XXXX-X/XX/$XX.00 ©20XX IEEE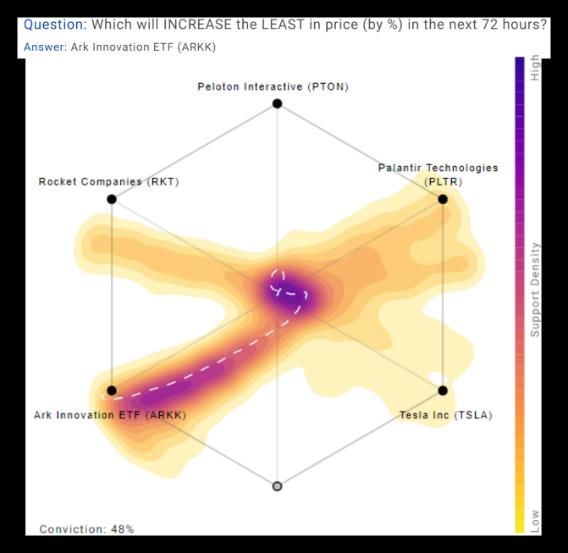
personal intent on the system as a whole. The input from each                online survey. The group then congregated online in real-time
user is not a discrete vote, but a stream of time-varying vectors.           and used the Swarm platform and make collective forecasts.
                                                                                 In each week of the study, participants first predicted the
                                                                             price change of the 12 assets over the next three days in a survey.
                                                                             The survey asked participants to buy or short up to 2 units of
                                                                             their virtual bankroll for each asset, and to predict which asset
                                                                             would increase the most and which would decrease the most
                                                                             respectively. The Wisdom of the Crowd (WoC) response to each
                                                                             question was calculated as the most popular response provided
                                                                             by the survey participants (i.e. the statistical Mode).
                                                                                 Next, participants logged into the Swarm platform to
                                                                             synchronously answer these same questions as a group—first
                                                                             allocating their virtual bankroll for each stock, and then creating
                                                                             two rankings of assets: the most likely to decrease and the most
                                                                             likely to increase over the next three days. For these rankings,
                                                                             the top 5 longs and top 5 shorts were considered. All individuals
                                                                             were anonymous to one another while swarming.
                                                                                 Swarm sessions started approximately 15 minutes after the
           Fig. 1. Users engaging Swarm software to rank assets.
                                                                             close of the market and lasted approximately half an hour. The
    Because all users can adjust their intent continuously in real-          price of each security was recorded at the open of the market the
time, the puck moves based on interactions among all members,                day after the swarm, and also at the close of the market three
empowering the group to converge in synchrony. Participants                  days after the swarm. The price of bitcoin (BTC) was recorded
must continuously update their input throughout the real-time                as soon as the swarm ended, as BTC trades continuously.
process or lose their influence over the outcome. This enables                   The percentage price change in each stock was calculated
the intelligence algorithms to continuously monitor the changing             using the price of the equity upon market open the day after the
behaviors of all members, modulating the aggregation. Figure 2               swarm and the price at close of market three days after the
shows an example of the underlying human behaviors. More                     swarm. The top three individuals whose virtual bankroll showed
details on the Swarm software can be found in [21, 22].                      the highest ROI over the three-day period were awarded
                                                                             bonuses: $15 for first place, $10 for second place, and $5 for
                                                                             third place. This bonus was to incentivize participants to use
                                                                             their best efforts in the forecasting surveys.
                                                                                 Finally, we managed a real bankroll over the duration of this
                                                                             experiment: starting with $5,000, we invested in the three stocks
                                                                             the Swarm ranked as most likely to increase in price. Bonuses
                                                                             were awarded to participants based on the overall performance
                                                                             of the swarm-managed bankroll. This was done to motivate best
                                                                             efforts from members during the swarming portion of the study.
                                                                             A. Data Analysis
                                                                                 Of the 108 asset movements collected, the mean movement
                                                                             was 1.62% upwards, which was skewed higher by the presence
                                                                             of a small number of outliers that increased in price by more than
                                                                             20%. No price ever decreased by more than 20%.

Fig. 2. Behavioral plot of the real-time decision making process. Darker
areas convey higher conviction. The dotted line shows the puck trajectory.

                          III.   METHODOLOGY
    To assess the ability of human groups to forecast cult stocks,
we conducted a nine-week study using volunteers from the
Cambridge Judge School MBA program. Volunteers self-
identified as interested in cult stocks and followed at least one
stock closely. In other words, they were all representative of the
high-level demographic driving the cult-stock movement. Each
weekly group of between 8 and 16 participants came from the
same pool of volunteers. To establish a baseline, all participants
provided their weekly forecasts as individuals using a standard                         Fig. 3. Distribution of Observed Price Movements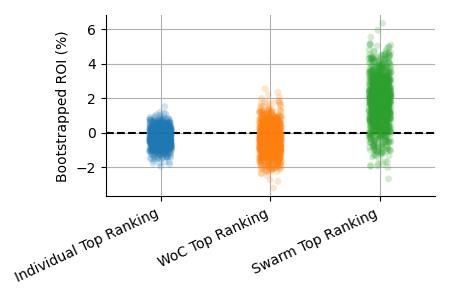
Such extreme outliers distort the analysis and interpretation
of these results by biasing towards a handful of data and may be
unrealistic in practice: a trader or hedge fund manager would
likely reduce exposure to these wild events by using stop losses
(and perhaps profit targets). As a result, we consider a clipping
function that restricts the maximum movement of these stocks
in the three-day window to a fixed interval: either 10% or 20%.
    For reference, the 12 assets forecast consisted of stocks
(GME, AMC, RKT, TLRY, PLTR, TSLA, PTON, AAPL and
SPCE), ETFs (ARKK and social-media driven BUZZ) and
Bitcoin (BTC, a volatile cryptocurrency). A chart of the average
price change of each asset is provided in Figure 4. The vast
majority of price movements were under 5% during each trading
period, though some assets exhibited larger volatility.

                                                                                  Fig. 5. Investment Performance using 20% Clipping.

                                                                             To examine how sensitive these results are to changes in the
                                                                         clipping, we next limited the stock movements further using a
                                                                         10% clipping function. In this context, the swarm achieves a
                                                                         1.77% ROI, which outperforms the average individual (-0.26%
                                                                         ROI, p=0.110) and the WoC (-0.39% ROI, p=0.106). As a result,
                                                                         we can be more than 85% confident that the Swarm Rankings
                                                                         outperformed both the average individual and the median
                                                                         individual response in this respect due to more than random
                                                                         chance alone. We also see that there’s a reasonable range of
                                                                         clipping limits for which the Swarm Top Rankings outperform
                                                                         the WoC and Individual top rankings.

Fig. 4. Average Movement across 12 Assets with 95% Confidence Interval
                       shown as black bars.

    Finally, to meaningfully compare data, we ran statistical
significance tests comparing each investment strategy to each
other investment strategy by bootstrapping 1,000 times over the
data points produced by each metric. For example, to bootstrap
the Swarm Top Picks metric over the 9 weeks of the study, we
randomly selected 18 of the swarm’s Top Long and Top Short
picks with replacement from the set of 18 data points (9 weeks,
one Long and one Short per week) we have for this metric.
B. Results
    When using a 20% clipping function, the swarm’s top-
ranked picks netted an average ROI of 2.3% week-over-week,
which outperformed the Individual (0.96%, p=0.13) and WoC                         Fig. 6. Investment Performance using 10% Clipping.
(1.6%, p=0.18) top-ranked picks, as shown in Figure 5. As a
                                                                             We also find that the Swarm Top Rankings achieved a
result, we can be more than 80% confident that the top-ranked
                                                                         significantly positive ROI in both the 20% clipping condition
Swarm picks outperformed the WoC and Individual rankings
                                                                         (p
REFERENCES
[1] Galton, F. (1907). Vox Populi. Nature, 75, 450-451.
[2] Steyvers, M., Lee, M.D., Miller, B., & Hemmer, P. (2009). The Wisdom
of Crowds in the Recollection of Order Information. NIPS. 1785-93.
[3] Philip E. Tetlock and Dan Gardner. 2015. Superforecasting: The Art and
Science of Prediction. Crown Publishing Group, New York, NY, USA.
[4] J Dana, P Atanasov, P Tetlock, B Mellers (2019), Are markets more
accurate than polls. The surprising informational value of “just asking.”
Judgment and Decision Making 14 (2), 135-147.
[5] Rosenberg, L.B., “Human Swarms, a real-time method for collective
intelligence.” Proceedings of the European Conference on Artificial Life
2015, pp. 658-659.
[6] Metcalf L, Askay DA, Rosenberg LB. Keeping Humans in the Loop:
Fig. 7. Distribution of Bootstrapped Performance using 10% Clipping Pooling Knowledge through Artificial Swarm Intelligence to Improve
Business Decision Making. California Management Review.
To more accurately evaluate the quality of these strategies 2019;61(4):84-109.
compared to the market, we can examine the performance of a [7] Patel, B.N., Rosenberg, L., Willcox, G. et al. Human–machine partnership
benchmark index, the S&P 500 (SPY), over the same time with artificial intelligence for chest radiograph diagnosis. npj Digital
Medicine 2, 111 (2019). https://doi.org/10.1038/s41746-019-0189-7
intervals. We tabulated the price changes of SPY across the
length of this study in the same way as the cult stocks. SPY on [8] Rosenberg, Louis. (2016) “Artificial Swarm Intelligence vs Human
Experts,” International Joint Conference on Neural Networks (IJCNN).
an average increased by +0.4% over the same time period we
[9] Rosenberg, Louis. Baltaxe, David and Pescetelli, Nicollo. "Crowds vs
considered. The Swarm Top Rankings outperformed this Swarms, a Comparison of Intelligence," IEEE 2016 Swarm/Human
benchmark metric using both the 10% clipping (pYou can also read