Foursquare: Telecom Industry Analysis - Last Updated March 2023

Page created by Kathleen Warren
 
CONTINUE READING
Foursquare: Telecom Industry Analysis - Last Updated March 2023
Foursquare:
Telecom
Industry
Analysis

Last Updated
March 2023
Foursquare: Telecom Industry Analysis - Last Updated March 2023
Table of Contents
03 Project Overview & Methodology

04 Definitions

05 Key Learnings & Opportunities

08 Penetration Telecom Carriers

11 Foot Traffic to Telecom Carriers

12 Share of Traffic to Telecom Carriers

17 Telecom Real-World Patterns & Preferences

19 Competitive Deep Dive in the Telecom Landscape

21 Audience Deep Dive: Top Carrier Motivations & Expectations

36 New Customer Acquisition

39 Key Takeaways & Opportunities

                                                                2
Foursquare: Telecom Industry Analysis - Last Updated March 2023
Overview &
Methodology
From opening a new phone plan, to seeking in-person
support, or just needing a simple device upgrade, telecom
shoppers have varied motivations for visiting a carrier store
in-person.

In our latest research, we analyzed real-world foot traffic
patterns to help carriers better understand the competitive
landscape, align with shoppers' interests and plan for the
future.

In this report, we take a closer look at behavior and foot
traffic patterns to define these telecom shoppers and
understand their motivations for visiting, to help telecom
carriers plan for the future.

Foursquare analyzes consumer behavior based on foot traffic
data from millions of Americans that make up our always-on
panel. For the purpose of this report, all data is aggregated
and normalized against U.S. Census data to remove any age,
gender and geographical bias.

                                                                3
Foursquare: Telecom Industry Analysis - Last Updated March 2023
Definitions
Analysis Period: January 1 2022 - December 31 2022

Indexed Foot Traffic: We’ve examined foot traffic trends on a
national level and used indexed foot traffic to demonstrate the
relative growth or decline in foot traffic volume by category or
carrier, where visits during the average 7-day period = 100. We used
7-day rolling averages to account for fluctuations by day of week.

Indexed Affinities: The times (or percentage) more or less likely than
the average U.S. consumer to visit a given category or chain, where
1 represents the average U.S. consumer’s visit propensity.

Penetration: The percentage of telecom shoppers who visited a
given category or chain at least once during that analysis time frame.

Dwell Time: Median time spent at a given category or chain during
the analysis period; Also includes distribution of total visits by time
spent on-premise.

Visit Frequency: Average visits per customer/visitor during a
specified timeframe.

                                                                          4
Foursquare: Telecom Industry Analysis - Last Updated March 2023
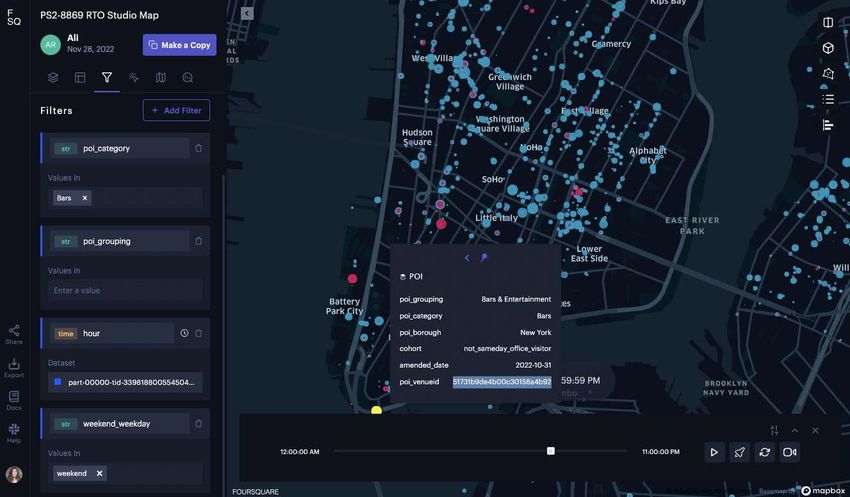
Key learnings & trends from this year for Telecom

  Most telecom customers prefer in-              T-Mobile/Sprint outpaces top                  Seasonal moments of opportunity
  store support > online assistance.             competitors with the highest % of             differ by carrier throughout the year.
  FSQ survey data shows that the majority
                                                 market share.                                 T-Mobile/Sprint stores saw elevated foot
  of consumers (55%) prefer to visit carrier     Throughout 2022, T-Mobile/Sprint stores       traffic in January and February, while
  stores in-person vs. online, with device       consistently saw the highest share of         Version stores saw upticks throughout May
  upgrades & in-person support accounting        category foot traffic (24-28%), outpacing     & June (around Mother’s Day, graduation
  for nearly 75% of customers’ visit             AT&T (17-20%) and Verizon Wireless            season). AT&T stores the most notable
  intentions. In addition, in-store customers    (20-23%).                                     boost in late September through early
  are likely to return. Over 90% of in-store                                                   October, and also during the holiday
  carrier visits came from returning visitors.                                                 season (outpacing competitors).

 The opportunity to conquest from                Carrier stores are seeing more traffic        Female customers and A35-44 were
 competitors is already within reach.            than expected from female visitors.           the only cohorts that drove lift for
                                                                                               FSQ's 2022 telecom campaigns.
  Across all 3 carriers, non-customers           Across all three carriers, women accounted
  accounted for 45%+ share of total              for a higher share of store traffic in 2022   Female customers drove +8% lift during
  store traffic last year. In fact, for AT&T,    compared to 2021. In addition, all stores     FSQ's 2022 telecom campaigns.Telecom
  non-customers made up the majority of          were seeing +3% more traffic than             brands have the opportunity to tailor their
  store visits (57%).                            expected of women, relative to what other     efforts by stocking shelves with inventory
                                                 businesses and service venues were seeing     that female shoppers are most likely to
                                                 in 2022.                                      be in-market for to get these women in-
                                                                                               store and coming back for more

                                                                                                                                             5
Foursquare: Telecom Industry Analysis - Last Updated March 2023
Let’s take a closer look at foot traffic
patterns & preferences to telecom
carriers over the past year

                                           6
Foursquare: Telecom Industry Analysis - Last Updated March 2023
75% of Americans claimed                                                 According to a survey of consumers in Foursquare’s
they were not likely to switch                                           always-on panel in December 2022 - January 2023:

wireless carriers in 2023                                                      No                                                                    75%

According to Foursquare’s survey data, 75% of                       Undecided                             17%
respondents claimed they were unlikely to switch
wireless carriers in 2023. This is great news for                            Yes               8%
America’s top telecom carriers.

Yet, there is still an opportunity for carriers to gain share
of market, with 8% of respondents likely to make the
switch, and another 17% of respondents still on the                      According to a survey of consumers in Foursquare’s
fence and impressionable if presented with the right                     always-on panel in December 2022 - January 2023:
reasons. The majority (55%) of survey respondents

                                                                           55%
claim they would sign up for a phone plan in person,
                                                                                                 prefer to sign up for a
likely due to the in-person support they will receive.                                           phone plan in-person

Thus, there’s an opportunity for telecom carriers to
leverage location data to better understand customers’
intentions for switching their phone plans to build
relevant messaging and gain share of market from
                                                                           45%                  prefer to sign up for a
                                                                                                phone plan online

competitors.

                                                                Foursquare survey data from December 1 2022 - January 31 2023; Sample Size: 29,080         7
Foursquare: Telecom Industry Analysis - Last Updated March 2023
In-store shopping has                                     Penetration to Telecom Carriers                                    2021        2022
increased amongst today’s
telecom shoppers
Across the top 3 leading carrier brands, a higher %                                               6%                                + 2 % points
                                                                       AT&T
of the American population was visiting carrier stores                                                     8%
in-person last year (8-10%) compared to what we
saw in 2021 (6%). As we discovered from our survey
data, 55% of in-market shoppers prefer to initiate/
switch their carrier service in-person vs. online.
Perhaps this YoY increase in penetration could                                                      6%
reflect the growing % of in-market shoppers YoY.         T-Mobile/Sprint                                                            + 4 % points
                                                                                                                10%

Of the carriers we looked at, T-Mobile/Sprint &
Verizon Wireless stores saw the highest penetration
(10%) and the biggest increase in this metric YoY
(+ 4 % points) compared to AT&T.
                                                                                                    6%                              + 4 % points
                                                                  Verizon
                                                                                                                10%

                                                            Foursquare data from Jan 1 - Dec 31 2021 & Jan 1 - Dec 31 2022                         8
Foursquare: Telecom Industry Analysis - Last Updated March 2023
44% of telecom customers                                                   According to a survey of consumers in Foursquare’s
visited carrier stores for a                                               always-on panel in December 2022 - January 2023:

device upgrade in 2022                                                                                               In-Person
                                                                                                                     Account Support

Foursquare survey data shows that a main reason for                                                           29%
visiting a carrier in 2022 was to take advantage of
annual device upgrades. While a small % of customers
visit to sign up for a new phone plan (10%), survey data
suggests that customers are coming in most often for
routine maintenance (device upgrades) or in-person                                                                                           Add
support.                                                        Device                                                                       service to
                                                               Upgrade                                                                       existing
                                                                                                                                     16%
                                                                                                                                             plan
Telecom brands can leverage these learnings to inform
flighting strategies (i.e. heavy up during product releases
to drive in-store visitation). For instance, iPhone and
Android typically unveil their newest models in                                    44%
September. Telecom brands can capitalize on these                                                                           10%
moments to capture customers during the start of the                                                                                   Sign up
holiday shopping season.                                                                                                               for a new
                                                                                                                                       phone plan

                                                              Foursquare survey data from December 1 2022 - January 31 2023; Sample Size: 29,035          9
Foursquare: Telecom Industry Analysis - Last Updated March 2023
Who is visiting telecom                                   Share of Total Traffic from New vs Returning Customers (2022)
carrier stores in-person?                                           New              Returning

Returning customers accounted for the overwhelming
majority (92%+) of store visits to major telecom
carriers in 2022, indicating that in-store visitors are
likely to return again.
                                                                       93%                          93%                 92%
At the same time, it’s worth noting that 7-8% of store
traffic in 2022 was coming from new customers,
people who hadn't previously visited that respective
carrier at all in 2022, or in 2021. This subset of new
customers represents an opportunity for brands to                       7%                          7%                   8%
conquest from top competitors in 2023.                                 AT&T                  T-Mobile/Sprint          Verizon

Opportunity: Identify & reach Verizon, AT&T, and
                                                           How To Read: 8% of people who visited a Verizon store in 2022 were classified
T-Mobile/Sprint visitors, and other Americans who
                                                           as new customers, meaning they had not visited a Verizon store in 2021.
are likely in need of phone services & updates.

                                                           How To Read: 92% of people who visited a Verizon store in 2022 were classified
                                                           as returning customers meaning they had also visited a Verizon store in 2021.

                                                          Foursquare data January - December 2022                                           10
Foot traffic patterns differ by carrier throughout the year
In the chart below, we took a closer look at foot traffic to major telecom carriers vs. the telecom category overall in 2022. Location data
reveals, that while all telecom carriers were seeing similar patterns in foot traffic, each carrier individually saw a distinguishable period of
heightened visitation throughout the year. For example, T-Mobile/Sprint stores saw elevated visitation early on (January & February), likely
attributed to final closing sales at Sprint venues as the merger of Sprint + T-Mobile was officially finalized in March of 2022. Version Wireless
saw sustained levels of elevated foot traffic in early May through late June, perhaps driven by gift-giving for Mother’s Day and/or graduation
season. AT&T saw a noteworthy boost in late September through early October (following the latest product release from Apple), and also
the biggest uptick in holiday traffic compared to other carriers (up +27% on 12/23).

  Lift/Decline in Foot Traffic To Compared To 7-Day Average (2022)                                                     Telecom Category                     AT&T           Verizon
                                                                                                                       T-Mobile / Sprint
   130

   125

   120

   115

   110

   105

   100

    95

    90

    85

     1/1/22      1/29/22      2/26/22       3/26/22      4/23/22       5/21/22       6/18/22      7/16/22       8/13/22       9/10/22      10/8/22       11/5/22      12/3/22       12/31/22

              Chart represents weekly indexed foot traffic to various telecom carriers & the telecom category using 7-day rolling averages to account for fluctuation by day of week.
              Foot traffic is benchmarked to 7-day rolling average visitation for each respective chain/category during the analysis period (January 2022 - December 2022).                    11
Understand telecom carriers' share of category foot traffic
Foursquare data shows shifting patterns in share of category visitation for top players: AT&T, Verizon Wireless and T-Mobile/Sprint. T-Mobile/
Sprint stores consistently saw the highest share of category traffic throughout the year, especially in the first few months of the year
(27-28% share between January through April 2022). We saw a shift in category share occur between April - May, with T-Mobile/Sprint
dropping by a few % points, while AT&T and Verizon Wireless both gained share around that time. These learnings can help telecom carriers
keep tabs on the competitive landscape and capitalize on changes in real time.

    Share of Total Carrier Foot Traffic by Month (2022)                                         AT&T           T-Mobile/Sprint            Verizon

    30%

    27% 28%        28%
                               28%        27%

    25%
                                                                               25%            25%             25%
                                                      24%         24%                                                                          24%
                                                                                                                          24%       24%
    22%
                                                                  23%                                                                          22%
                                                      22%                      22%
                                                                                                              22%         22%       22%
                                                                                              21%
    20% 21%                    21%        21%
                   20%                                                                                        20%
                                                                  19%          19%            19%                         19%                  19%
                                                      19%                                                                           19%
    18%                        18%
                                          18%
          17%      17%

     January     February     March      April        May        June         July          August        September     October   November   December

                                                                         Foursquare data from January - December 2022                                   12
Telecom customers are                                      Median Dwell Time (minutes) By Telecom Carriers
                                                                                                                                        2022
                                                                                                                                        2021
spending more time at
carrier stores in 2022
Verizon Wireless saw the highest median dwell time                                                                                    14.5
                                                                           AT&T
amongst in-store shoppers in 2022, compared to                                                                                 12.7
competitor carriers. Similarly, AT&T and T-Mobile/
Sprint were also seeing a slightly longer dwell time in
2022 compared to 2021, with all visits lasting under
15 minutes.
                                                                                                                                   13.9
                                                            T-Mobile/Sprint
Though a majority of telecom visits lasted under 15                                                                            12.4
minutes, they're getting longer YoY. With a higher %
of Americans visiting carrier stores in 2022,
increased dwell time is likely reflective of longer wait
times for customers seeking for in-person support.
                                                                                                                                        15.3
                                                                      Verizon
Opportunity: Identify & segment in-store                                                                                         13.4
shoppers based on visit behavior.

                                                              Foursquare data from Jan 1 - Dec 31 2021 & Jan 1 - Dec 31 2022                   13
Today’s shoppers are focusing
                                                                        According to a survey of consumers in Foursquare’s
on value, affordability & quality                                       always-on panel in December 2022 - January 2023:

of coverage when it comes to
choosing a wireless carrier
Foursquare survey data reveals that nearly half (49%)           Value &
                                                          Affordability                                                   39%
of consumers are prioritizing value & affordability                                                                                      Coverage
above all else when deciding on a wireless carrier.                                                                                      Quality
Given the current economic climate, it's no surprise
that customers are seeking the most affordable plan to
stretch their dollars further.

For another 39% of respondents, quality of coverage
is the most important factor, while only 11% place the                        49%
most value on quality of customer service.
                                                                                                                         11%
Telecom carriers can leverage these learnings to
personalize & build relevant messaging that aligns with                                                                               Customer
                                                                                                                                      Service
shoppers’ top priorities and value drivers in 2023.

                                                           Foursquare survey data from December 1 2022 - January 31 2023; Sample Size: 29,035       14
AT&T is capturing market share                                       Share of Total Traffic by Audience:
away from other carriers                                             Customer vs Non-Customers* (2022)

                                                                         Customer               Not a Customer
Across all 3 carriers, at least 45% of in-store traffic in 2022
was coming from people who were not customers during
the time of their visit, presenting a viable opportunity for
carriers to capitalize on consumer intent with enticing deals                         AT&T             43%                         57%
and options to inspire the switch.

While existing customers accounted for the major of
visitors for T-Mobile/Sprint and Verizon in 2022, AT&T saw
a much higher % of traffic (57%) from non-AT&T                       T-Mobile/Sprint                      55%                         45%
customers. This could mean that AT&T is attracting a
sizable % of competitor’s current customers, likely people
shopping to evaluate their option and possible make a
switch. AT&T can capitalize on this opportunity to gain
market share by tapping in to key value drivers (i.e.                            Verizon                  53%                        47%
affordability) to resonate with non-customers.

                                                                       How To Read: 43% of users that went to an AT&T are
                                                                       AT&T customers, based on their carrier information.

                                                                  Foursquare data January - December 2022; Numbers indicate the percentage of total
                                                                  visitors to AT&T stores using a given carrier; *Customers & non-customers are defined
                                                                                                                                                          15
                                                                  as consumers visiting a carrier location who do not currently use specified carrier
As we suspected, carriers were seeing a higher % of traffic from
customers of competing carriers in 2022
Foursquare can help major telecom carriers identify the top carriers of their store visitors. For both T-Mobile/Sprint & Verizon Wireless, the majority of
total store traffic came coming from their respective existing customers. As we learned from the previous slide, AT&T saw that almost 50% of store
visits from non-customers in 2022. Here, we can actually see the breakdown of carriers within that audience. T-Mobile/Sprint customers accounted for
26% of AT&T store traffic, and Verizon customers accounted for 22%. Across all 3 major players, less than 12% of store traffic is coming from ‘other’
customers. This data can provide insight to assist brands in acquiring prospective customers most likely to defect from competing carriers.

  Share of Total Traffic by Carrier (2022)                                          AT&T            T-Mobile/Sprint                   Verizon              Other

                  AT&T                             43%                                           26%                                  22%                    9%

   T-Mobile/Sprint                17%                                           55%                                                      22%                 7%

              Verizon           15%                      23%                                                52%                                            11%

                         How To Read: 17% of visits to T-Mobile/Sprint stores come from people with AT&T as their carrier.

                                                                                Foursquare data January - December 2022; Numbers indicate the percentage
                                                                                of total visitors to carrier stores using a given carrier                          16
Telecom customers are                                                                        Cost Conscious Consumers
                                                                                              Bus Stops +9%
cost-conscious                                                                                Laundromats +9%
                                                                                              Off Price Retail +7%
shoppers, planning for                                                                        Discount Stores +5%
                                                                                              Financial Services +5%
their next phase of life
How To Read: Compared to the average                                                          Life Stagers
American, Telecom store visitors were +9%                                                     Kids Stores +9%
more likely to also visit kids stores in                                                      Storage Facilities +7%
2022. This data might suggest that parents                                                    Baby Stores +6%
are shopping around for the best family                                                       Bridal Shops +5%
plan as their kids come of age.                                                               Mattress Stores +5%

Opportunity: Recognize and adapt to changes
in consumer behavior; Segment and tailor                                                     Fashionistas
messaging based on location-based insights.                                                  Shoe Stores +9%
                                                                                             Women's Stores +8%
                                                                                             Clothing Stores +7%
                                                                                             Nail Salons +7%
                                                                                             Boutiques +5%

                         Foursquare data from Jan - Dec 2022; Index score indicates to what degree (%) telecom carrier visitors are more likely to visit the categories
                         than the average American. This audience has a stronger affinity for all listed venues relative to the average U.S. consumer in 2022.            17
Let’s take a closer look at the
competitive landscape for top
telecom carriers in 2023

                                  18
The wireless telecom industry                                     Wireless Telecommunications Carriers in the US - Market Size
is projected to grow with the                                     (2020–2023) - in millions

                                                                                                                               $330
                                                                   330                                            $325
introduction of 5G in 2023                                                                            $312
                                                                   310
                                                                                $301
According to IbisWorld in 2022, the wireless telecom
industry is expected to see a 1.5% increase in market size         290
by the end of 2023.*
                                                                   270
2023 will bring the first 5G use cases which will revolutionize
connectivity. 5G can connect virtually everything, from            250
machines and objects to devices. Carriers like Verizon                          2020                  2021        2022         2023
Wireless, AT&T, and T-Mobile are the few early adopters
with 5G products already rolled out as of January 2023.*
                                                                  'The Big Three' - Top Wireless Carriers by Revenue in 2022
These top innovative carriers proved to be the revenue
heavy hitters as well, drawing in billions of dollars per year.
                                                                         1.                                     $136 billion
In this next section, we took a closer look at visitation

                                                                         2.
patterns, customer demographics and affinities for these top
3 carriers to highlight the importance of using location data                                                   $120 billion
to understand the competitive landscape & unlock new
opportunities.
                                                                         3.                                     $80 billion

                                                                                                                                      19
                                                                  Sources: IbisWorld, Verizon, AT&T, T-Mobile
Verizon Wireless

                   20
2021
                                                          Share of Verizon Visits By Gender
Verizon stores drew more                                                                                                                  2022

female shoppers in 2022                                                             50%
                                                                                                                        54%
                                                                                                                                  50%
                                                                            46%

Female shoppers were responsible for an even higher
share of store traffic (50%) in 2022 (up from 46% in
2021). The brand was also seeing even more traffic
than expected from female shoppers in 2022
                                                                               Female                                      Male
compared to 2021, relative to other businesses.

Verizon should continue to hone in on this female
                                                                                                                                          2021
audience as they are seeing more than their fair share     Fair-Share Index: Gender
                                                                                                                                          2022
of visits from female shoppers throughout the year.
                                                           110                  102     103                                 99       97
                                                            92

                                                            73

                                                            55

                                                            37

                                                            18

                                                              0
                                                                                  Female                                          Male

                                                         Foursquare data from Jan - December (2021 & 2022); Share of visits for
                                                         Telecom brand stores is indexed vs. share of visits for total U.S. POI                  21
2021
                                                              Share of Verizon Visits By Age
Middle aged customers                                                                                                                                         2022

accounted for a majority of                                  25%                                         26%
                                                                                                                25%
                                                                                                                             21%
                                                                                              20%
Verizon store visits in 2022, but                            20%
                                                                                                                       21%

                                                                                        20%

                                                             15%                                                                            14%
the carrier saw more than its fair                           10%        9%
                                                                                  9%
                                                                                                                                      13%

                                                                                                                                                        10%
                                                                                                                                                              11%

share of customers ages 55+                                   5%

                                                              0%
                                                                      18-24            25-34            35-44         45-54        55-64          65+
Verizon Wireless shoppers ages 35-54 accounted for
46% of total foot traffic in 2022, while 1/4 of Verizon
visits were from visitors over the age of 55.
                                                                                                                                                              2021
                                                             Fair-Share Index: Age (vs. US Gen Pop)*
                                                                                                                                                              2022
Verizon only saw +2-5 % points more traffic than
expected from these middle aged shoppers (A35-54)            120                                                                          113           114
                                                                                                                102          105    109
                                                                                                                                                  115

                                                                                                   91
                                                                                                                       105

while interestingly, older Verizon shoppers ages 55+,        100                                          100

                                                                                  80
                                                                                              91

                                                                             87

over-indexed the most.                                         80

                                                               60

Verizon is seeing 13%+ more traffic than expected of           40

people ages 55+ compared to other businesses,                  20

presenting an opportunity to create & maintain brand            0
                                                                       18-24           25-34            35-44         45-54        55-64          65+
loyalty amongst this older cohort of in-store visitors.

                                                          Foursquare data from Jan - December (2021 & 2022); Share of visits for
                                                          Telecom brand stores is indexed vs. share of visits for total U.S. POI                                     22
Verizon stores attract consumers with an affinity for...

 Auto & Road Trips                            Casual Dining                                   Home Renovation                                Weekend Activities
                                                                                              & Decor
 Compared to the average American,            Compared to the average American,              Compared to the average American,               Compared to the average American,
 they're are more likely to frequent...       they're are more likely to frequent...         they're are more likely to frequent...          they're are more likely to frequent...

 Tex-Mex Restaurants 2.2x                     Tailor Shops 2.1x                              Volleyball Courts 1.9x                          Mattress Stores 1.7x
 Chinese Restaurants 2.0x                     Lingerie Stores 2.0x                           Baseball Diamonds 1.8x                          Lighting Stores 1.6x
 Japanese Restaurants 1.9x                    Shoe Stores 1.8x                               College Football Fields 1.6x                    Design Studios 1.5x
 Indian Restaurants 1.8x                      Women's Stores 1.5x                            College Stadiums 1.6x                           Housing Developments 1.5x
 Poke Places 1.7x                             Men's Stores 1.4x                              Football Stadiums 1.6x                          Department Stores 1.4x
 Vegan Restaurants 1.9x                       Cosmetics Shops 1.3x                           Basketball Stadiums 1.5x                        Fabric Shops 1.2x
 Ramen Restaurants 1.5x                       Boutiques 1.2x                                 Stadiums 1.4x                                   Shipping Stores 1.2x
 Taco Places 1.2x                             Accessories Stores 1.2x                        Tennis Courts 1.2x                              Furniture Stores 1.1x
 Italian Restaurants 1.2x                     Clothing Stores 1.2x

Opportunity: Understand the consumption habits of consumers who are visiting Verizon venues to target the correct telecom consumer in 2023.

                                          Foursquare data from Jan - Dec 2022; Index indicates what % more likely Verizon visitors are to visit categories than the average
                                          American. This audience has a stronger affinity for all listed chains relative to the average U.S. consumer in 2022.                        23
Where are consumers more likely to stop before vs. after visiting a
Verizon location in 2022?
Compared to the average American, Verizon shoppers are generally more likely to visit all of the below chains.
Categories are listed in rank order based on consumers’ affinity to visit before vs. after & vice versa.
BEFORE VISITING...                                                                                       AFTER VISITING...
                                                                                    Verizon
  Breakfast Restaurants                    Life Changes                                                   Retail                                      Dessert Spots
  They’re more likely to visit the         They’re more likely to frequent                                They’re more likely to shop                 They’re more likely to
  following breakfast chains:              the following chains:                                          til they drop at:                           satisfy their cravings at:
                                           Sherwin-Williams                                               Forever 21                                  Cold Stone Creamery
  First Watch
                                           Regions Bank                                                   DSW                                         Dairy Queen
  IHOP
                                           Pet Supplies Plus                                              H&M                                         Baskin Robbins
  Caribou Coffee
                                           Chase Bank                                                     Dillard's                                   Krispy Kreme Doughnuts
  Dunkin'
                                           Wells Fargo                                                    Bed Bath & Beyond                           Sonic Drive-In
  Dutch Bros Coffee
                                           U-Haul                                                         Marshalls
  Tim Hortons
                                           The UPS Store                                                  Burlington                                  Did You Know?
  Waffle House
                                           Ace Hardware                                                   Premium Outlets
  Denny's                                                                                                                                             Sweet Tooths are +32%
                                           FedEx                                                          Victoria's Secret
  Starbucks                                                                                                                                           more likely to visit a ice
                                                                                                          HomeGoods                                   cream shop after visiting a
                                           Did You Know?                                                                                              Verizon in 2022.
  Did You Know?                                                                                           Did You Know?
                                           They're +83% more likely to visit
  These early birds are +69%               a courthouse or insurance office                               Shoppers are +7% more
  more likely to visit a breakfast         before vs. after visiting a Verizon                            likely to visit a a women's
  spot before vs. after visiting a         location in 2022.                                              store after visiting a Verizon
  Verizon in 2022.                                                                                        location in 2022.

                                Foursquare data from Oct 2022 - Jan 2023; Chains listed are based on an Index score that indicates times/% more likely to visit before vs after
                                visiting a Verizon location. This audience has a stronger affinity for all listed chains relative to the average U.S. consumer in Oct 2022 - Jan 2023.   24
AT&T

       25
2021
                                                            Share of AT&T Visits By Gender
AT&T drew more female                                                                                                                       2022

shoppers in-store last year                                                           50%                                 53%       50%
                                                                              47%

Our data shows that a greater share of AT&T store
visits in 2022 came from female customers, with 50%
of traffic coming from women (up +3 % points from
2021). AT&T stores inversely saw a -3 % point lower
share of traffic from men in 2022.                                               Female                                      Male

Though AT&T stores saw less traffic from female
customers in 2022 compared to 2021, the brand’s stores                                                                                      2021
                                                             Fair-Share Index: Gender
                                                                                                                                            2022
were actually still seeing more traffic than expected of
female visitors relative to other businesses, including      110                  104     103
                                                                                                                              97       97
other retail stores, restaurants, etc.                        92

                                                              73
Opportunity: Identify & segment AT&T shoppers                 55
based on visit behavior & demographics.                       37

                                                              18

                                                                0
                                                                                    Female                                          Male

                                                           Foursquare data from Jan - December (2021 & 2022); Share of visits for
                                                           Telecom brand stores is indexed vs. share of visits for total U.S. POI                  26
2021
                                                              Share of AT&T Visits By Age
Millennials (25-44) accounted                                                                                                                                      2022

for nearly 1/2 of total visits to                            25%                          24%
                                                                                                 23%         26%
                                                                                                                    26%
                                                                                                                                 20%
AT&T, and the carrier is also                                20%                                                           20%

                                                             15%
                                                                              12%
seeing more than its fair share                              10%
                                                                        11%                                                                  11%
                                                                                                                                                   11%
                                                                                                                                                                   8%
of traffic from this audience
                                                                                                                                                              7%

                                                              5%

                                                              0%
                                                                      18-24              25-34              35-44         45-54        55-64             65+
AT&T visitors ages 25-44 (mainly Millennials) accounted
for 49% of total store visits in 2022. What’s more,
AT&T was seeing +4-6% more traffic than expected of
                                                                                                                                                                   2021
this audiences last year compared to other businesses,       Fair-Share Index: Age (vs. US Gen Pop)*
                                                                                                                                                                   2022
including other stores, dining venues, etc.                                                                         106
                                                             110                                      104                        99
                                                                                    96                                                             94
                                                                                                107

                                                                              105

                                                                                                                                                                   89
                                                                                                              101

                                                                                                                           99

                                                               92
                                                                                                                                        93

Gen Z customers (ages 18-24) accounted for only 12%                                                                                                      84

                                                               73
of AT&T store traffic last year. However, the brand
                                                               55
actually saw less traffic than expected of this younger
                                                               37
tech-savvy generation compared to other businesses,
                                                               18
and also compared to 2021.
                                                                0
                                                                       18-24             25-34              35-44         45-54        55-64             65+

                                                          Foursquare data from Jan - December (2021 & 2022); Share of visits for
                                                          Telecom brand stores is indexed vs. share of visits for total U.S. POI                                          27
AT&T stores attract consumers with an affinity for...

 Diverse Dining                               Beauty & Fashion                                Live Sports                                    Home Renovation
                                                                                                                                             & Decor
 Compared to the average American,            Compared to the average American,              Compared to the average American,               Compared to the average American,
 they're are more likely to frequent...       they're are more likely to frequent...         they're are more likely to frequent...          they're are more likely to frequent...

 Tex-Mex Restaurants 1.4x                     Tailor Shops 2.1x                              Volleyball Courts 1.8x                          Mattress Stores 1.7x
 Chinese Restaurants 1.4x                     Lingerie Stores 2.0x                           Baseball Diamonds 1.8x                          Lighting Stores 1.6x
 Japanese Restaurants 1.3x                    Shoe Stores 1.8x                               College Football Fields 1.6x                    Design Studios 1.5x
 Indian Restaurants 1.2x                      Women's Stores 1.5x                            College Stadiums 1.6x                           Housing Developments 1.5x
 Poke Places 1.2x                             Men's Stores 1.4x                              Football Stadiums 1.6x                          Department Stores 1.4x
 Vegan Restaurants 1.2x                       Cosmetics Shops 1.3x                           Basketball Stadiums 1.5x                        Fabric Shops 1.2x
 Ramen Restaurants 1.2x                       Boutiques 1.2x                                 Stadiums 1.4x                                   Shipping Stores 1.2x
 Taco Places 1x                               Accessories Stores 1.2x                        Tennis Courts 1.2x                              Furniture Stores 1.1x
 Italian Restaurants 1x                       Clothing Stores 1.2x

Opportunity: Understand the consumption habits of consumers who are visiting AT&T venues to target the correct telecom consumer in 2023.

                                          Foursquare data from Jan - Dec 2022; Index indicates % more likely AT&T visitors are to visits the categories than the average American. This
                                          audience has a stronger affinity for all listed chains relative to the average U.S. consumer in 2022.                                           28
Where are consumers more likely to stop before vs. after visiting an AT&T
location in 2022?
Compared to the average American, AT&T shoppers are generally more likely to visit all of the below chains.
Categories are listed in rank order based on consumers’ affinity to visit before vs. after & vice versa.
BEFORE VISITING...                                                                                       AFTER VISITING...
                                                                                     AT&T
 Auto                                     Casual Dining                                                    Hotels                                     Errand Venues
 They’re more likely to visit the         They’re more likely to go out for                                They’re more likely to                     They’re more likely to
 following auto locations:                a meal at the following dining                                   frequent hotels:                           shop at:
                                          chains:
 Enterprise Rent-A-Car                                                                                     Hilton Garden Inn                          The Fresh Market
 GMC                                      Hardee's                                                         SpringHill Suites                          GNC
 Valvoline Instant Oil Change             First Watch                                                      Residence Inn Marriott                     Five Below
 Ford                                     Starbucks                                                        Comfort Suites                             Nordstrom Rack
 Chrysler                                 Carl's Jr.                                                       Courtyard by Marriott                      Kroger
 Hyundai                                  Waffle House                                                     Super 8                                    Walmart
 Nissan                                   Auntie Anne's                                                    Days Inn                                   Marshalls
 Jeep                                     Del Taco                                                         Embassy Suites by Hilton                   Dollar General
 Jiffy Lube                               Wawa                                                             Marriott Hotels                            Target
                                          The Cheesecake Factory                                                                                      Sephora
 Did You Know?                                                                                             Did You Know?
                                          Did You Know?                                                                                              Did You Know?
 Drivers are actually +60%                                                                                 Travelers are +28% more likely
 more likely to visit an auto             Diners are actually +54% more likely                             to visit a hotel after visiting a         They’re +13% more likely to visit a
 shop before vs. after visiting           to visit comfort food restaurants                                an AT&T location in 2022.                 discount store and +4% more likely
 an AT&T location in 2022.                before vs. after visiting an AT&T
                                                                                                                                                     to visit department store after
                                          location in 2022
                                                                                                                                                     visiting an AT&T location in 2022.

                                  Foursquare data from Oct 2022 - Jan 2023; Chains listed are based on an Index score that indicates times/% more likely to visit before vs after
                                  visiting an AT&T location. This audience has a stronger affinity for all listed chains relative to the average U.S. consumer in Oct 2022 - Jan 2023.   29
T-Mobile/Sprint

                  30
2021
                                                               Share of T-Mobile/Sprint Visits By Gender
T-Mobile/Sprint drew                                                                                                              2022

more female shoppers                                                                     50%                        53%    50%
                                                                                 47%
in-store last year
In 2022, female shoppers were responsible for 50% of
store visits for T-Mobile/Sprint (up from 47% in 2021).

                                                                                    Female                            Male
In fact, the brand was seeing +3% more traffic from
female shoppers than most other businesses in 2022. In
contrast, these stores continue to see less than their fair
                                                                                                                                  2021
share of visits from male shoppers, likely due to male          Fair-Share Index: Gender
                                                                                                                                  2022
shoppers being more inclined to shop online.*
                                                                110                  104     103
                                                                                                                      97     97
T-Mobile/Sprint should consider customers’ shopping              92

preferences when planning their in-store and e-commerce          73

strategies in 2023. Stocking shelves with inventory that         55
female shoppers are most likely to be in-market for, and         37
optimizing messaging to better reach online female               18
shoppers, may lead to an increase in sales.                        0
                                                                                       Female                             Male

                                                              Foursquare data from Jan - December (2021 & 2022);
                                                              Share of visits for Telecom brand stores is indexed
                                                              vs. share of visits for total U.S. POI
                                                              Source: Jungle Scout                                                       31
2021
                                                                     Share of T-Mobile/Sprint Visits By Age
In 2022, Millennials (25-44)                                                                                                                                             2022

continued to account for over                                       25%                          26%
                                                                                                        26%         29%
                                                                                                                           26%

                                                                                                                                        19%
1/2 of total T-Mobile/Sprint                                        20%                                                           19%

                                                                    15%
                                                                                     12%
store visits                                                        10%
                                                                               11%

                                                                                                                                                    9%
                                                                                                                                                         10%
                                                                                                                                                                         7%
                                                                     5%
                                                                                                                                                                    6%

Customers ages 25-44 (mainly Millennials) accounted for
                                                                     0%
53% of total visits to T-Mobile/Sprint stores in 2022.                       18-24              25-34              35-44         45-54        55-64            65+

T-Mobile/Sprint stores saw a greater share of visits from
both Gen Z and older consumers, ages 65+ — accounting                                                                                                                    2021
for a +1% point higher share in 2022. However, the brand            Fair-Share Index: Age (vs. US Gen Pop)*
                                                                                                                                                                         2022
still saw less than its fair share of visits from both                                                       117
                                                                    120                                119

                                                                                                                           110
audiences in 2022.                                                                   106

                                                                                           98
                                                                                                                     110

                                                                                                                                        95
                                                                    100
                                                                                                                                                         81
                                                                                                                                  92

                                                                      80                                                                       77

                                                                                                                                                                         71
On the bright side, retail stores continued to over-index with                                                                                                 69

                                                                      60
Millennial shoppers, the largest consumer base in the country.
                                                                      40
T-Mobile/Sprint stores were seeing +10-17% more traffic
                                                                      20
from this audience compared to other business last year.
                                                                       0
                                                                              18-24             25-34              35-44         45-54        55-64            65+

                                                                 Foursquare data from Jan - December (2021 & 2022); Share of visits for
                                                                 Telecom brand stores is indexed vs. share of visits for total U.S. POI                                         32
T-Mobile/Sprint stores attract consumers with an affinity for...

 Public                                                                                       Errand Running                                 Healthy Living
                                              Parenting
 Transportation
 Compared to the average American,            Compared to the average American,              Compared to the average American,               Compared to the average American,
 they're are more likely to frequent...       they're are more likely to frequent...         they're are more likely to frequent...          they're are more likely to frequent...

 Metro Stations 7.1x                          Video Game Stores 1.8x                         Laundromats 2.8x                                Juice Bars 2.6x
 Bus Stops 4.4x                               Baby Stores 1.6x                               Dry Cleaners 1.7x                               Salad Places 2.5x
 Taxi Stands 2.9x                             Kids Stores 1.5x                               Shoe Stores 1.6x                                Soup Places 2.1x
 Bike Rentals 2.2x                            Indoor Play Areas 1.1x                         Nail Salons 1.5x                                Smoothie Shops 1.9x
 Light Rail Stations 2.0x                     Playgrounds 1.7x                               Tailor Shops 1.1x                               Cycle Studios 1.7x
 Train Stations 1.9x                          Elementary Schools 1.7x                        Coffee Shops 1.9x                               Pilates Studios 1.5x
 Airport Trams 1.0x                           Arts & Crafts Stores 1.3x                      ATMs 1.8x                                       Gyms 1.4x
                                              Gymnastics Gyms 1.2x                           Car Washes 1.2x                                 Bike Trails 1.4x
                                              Pre-Schools 1.2x                               Pharmacies 1.2x

Opportunity: Understand the consumption habits of consumers who are visiting T-Mobile/Sprint venues to target the correct telecom
consumer in 2023.

                                          Foursquare data from Jan - Dec 2022; Index indicates % more likely T-Mobile/Sprint visitors are to visit categories than the average
                                          American. This audience has a stronger affinity for all listed chains relative to the average U.S. consumer in 2022.                        33
Where are consumers more likely to stop before vs. after visiting a
T-Mobile/Sprint location in 2022?
Compared to the average American, T-Mobile/Sprint shoppers are generally more likely to visit all of the below chains. Categories are listed in
rank order based on consumers’ affinity to visit before vs. after & vice versa.
BEFORE VISITING...                                                                                     AFTER VISITING...
                                                                                 T-Mobile/
                                                                                   Sprint
  Road Trip Stops                        Banks                                                          Fast Food Restaurants                        Shoe Stores
  They’re more likely to visit the       They’re more likely to frequent                                They’re more likely to stop                  They’re more likely to
  following locations during their       the following bank chains:                                     at the below QSR                             shop at:
  trip:                                                                                                 restaurants:
                                         PNC Bank                                                                                                    Journeys
                                         Fifth Third Bank                                               Church's Chicken                             Rack Room Shoes
  Valvoline Instant Oil                  U.S. Bank ATM                                                  Wingstop                                     Foot Locker
  Texaco                                 U.S. Bank                                                      Applebee's                                   Sketchers Factory
  Jiffy Lube                             SunTrust Bank                                                  Zaby's                                       Outlet
  RaceTrac                               Bank of America                                                Little Caesars                               Crocs
  O'Reilly Auto Parts                    Wells Fargo                                                    Pizza Hut                                    Finish Line
  Circle K                               TD Bank                                                        Buffalo Wild Wings                           Vans
  AutoZone
                                                                                                        Taco Bell                                    Nike Factory Store
  7-Eleven
                                         Did You Know?                                                  Raising Cane's
  Wawa
                                                                                                                                                    Did You Know?
                                         The fiscally responsible are
  Did You Know?                          +36% more likely to visit banks                                 Did You Know?
                                                                                                                                                     Shoppers are +10% more
                                         before vs. after visiting a T-                                 Diners are +32% more likely to               likely to visit a shoe store
 They're +66% more likely to
                                         Mobile/Sprint location in 2022.                                visit a a pizza place after                  after visiting a T-Mobile/
 visit toll plazas & rest stop
                                                                                                        visiting a T-Mobile/Sprint                   Sprint in 2022.
 before vs. after visiting a T-
 Mobile/Sprint location in 2022.                                                                        location in 2022.

                           Foursquare data from Oct 2022 - Jan 2023; Chains listed are based on an Index score that indicates times/% more likely to visit before vs after visiting
                           a T-Mobile/Sprint location. This audience has a stronger affinity for all listed chains relative to the average U.S. consumer in Oct 2022 - Jan 2023.      34
Leverage past Foursquare campaign
data to identify opportunities for
new customer acquisition

                                     35
FSQ telecom campaigns
                                                         Median Behavioral Lift by                                            Median Behvaioral Lift Index
saw new customers                                        Visitation Frequency                                                 Median Impression Index

drive 23% lift* in 2022                               140

                                                                      123
                                                      120                                         118
Along with new customers, low frequency                                                                                                             111
customers drove significant lift for telecom                                                           107                    105107
                                                                                                                                                  100     Average
campaigns with 18% and medium frequency               100
                                                                                                                                                          Consumer
customers driving 5% lift*.
                                                       80
In 2022, telecom clients were pushing a majority
of impressions to a loyalist cohort grouping when
                                                       60
in reality we saw the inverse, in that newer
                                                                           47
customers are actually the ones who are driving
lift by visiting in-stores.                            40

Targeting Opportunity: Allocate more media             20
to new customers & target sub-audiences of
returning visitors to convert new customers into         0
loyalists as they search for the best deals.                  Not a Customer                        Low                       Medium              High

                                                    * Median behavioral lift based on a sample of telecom campaigns measured by FSQ attribution                      36
                                                     from Jan - Dec 2022. 2022 FSQ telecom benchmark: 9.9% lift
Female customers and                                           Median Behavioral Lift by Age                                                       Median Behavioral Lift Index
                                                                                                                                                   Median Impression Index
A35-44 were the only cohorts
that drove lift for FSQ's 2022                                   125
                                                                                111                    113                 109
                                                                                                                             109
                                                                               97                     99                                          10097               Average
telecom campaigns                                                100                                                                                              93
                                                                                                                                                                    78
                                                                                                                                                                      Consumer

                                                                  75
In 2022, FSQ's telecom campaigns only saw one age
group driving lift - older millennials A35-44 (9% lift)*.         50

                                                                  25
While an older generation (55+) was unsuccessful in
driving lift above benchmark, there's an opportunity for            0
telecom brands to focus their efforts on these older                          18-24                  25-34                 35-44                 45-54            54+
customers as they are severely under-indexing on
impressions, but driving the same, if not higher lift than                                                                                     Median Behavioral Lift Index
the younger age groups.                                        Median Behavioral Lift by Gender                                                Median Impression Index

Female customers drove +8% lift during FSQ's 2022                 125
                                                                                             108                                                           106
telecom campaigns, but were also under-indexing on                                                    94                                                              Average
                                                                  100                                                                             92
impressions. Telecom brands have the opportunity to                                                                                                                   Consumer
tailor their efforts by stocking shelves with inventory             75
that female shoppers are most likely to be in-market for            50
to get these women in-store and coming back for more.
                                                                    25

                                                                        0
                                                                                              Female                                                Male
                                                             * Median behavioral lift based on a sample of telecom campaigns measured by FSQ attribution                          37
                                                              from Jan - Dec 2022. 2022 FSQ telecom benchmark: 9.9% lift
Executive Summary &
Opportunities

                      38
Key Learnings & Takeaways For Today’s Top Carriers

 AT&T                                   T-Mobile/Sprint                          Verizon Wireless
 Of all 3 carriers, AT&T saw the        T-Mobile/Sprint saw the highest          Unlike top competitors, Verizon
 highest share of traffic from non-     share of category traffic throughout     Wireless is winning with older
 customers. Nearly 50% of AT&T          2022, outpacing AT&T and Verizon.        audiences. Relative to other
 store visits actually came from                                                 businesses, Verizon stores saw 13%+
 competitors’ customers (mostly         T-Mobile/Spring stores saw more          more than expected from Americans
 people with T-Mobile/Sprint or         traffic than usual, early in the year    ages 55+ last year.
 Verizon Wireless service).             (Q1), coinciding with when the brand
                                        was also seeing the highest share of     While existing customers accounted
 Compared to other businesses in        category visits.                         for the majority of store traffic
 2022, AT&T saw more traffic from                                                (52%), T-Mobile/Sprint customers
 women and Millennials (25-44).         T-Mobile/Sprint customers                accounted for the 2nd highest share of
                                        contributed to 55% of store traffic in   Verizon store visits in 2022 (23%).
 AT&T stores saw a noteworthy boost     2022, while 22% of visits came from
 in traffic from September through      Verizon customers.                       Unlike competitors, Verizon Wireless
 early October (following the latest                                             stores saw sustained levels of
 product release from Apple); The       Similar to AT&T, T-Mobile/Sprint         elevated foot traffic in early May
 brand also saw the biggest uptick in   stores were seeing more traffic than     through late June, perhaps driven by
 holiday traffic compared to other      expected from women & Millennials        gift-giving for Mother’s Day and/or
 carriers (up +27% on 12/23).           last year.                               graduation.

                                                                                                                          39
Opportunities with Foursquare

Segment Audiences                   Tap Into Trends                  Reach Consumers With              Influence Buyer
                                                                     Moment Based Messaging            Behavior
Identify consumers in different     Use taste & trend data to
life stages with changes in foot    identify consumer preferences,   Dynamically optimize              Reach key audiences on their
traffic patterns, visit frequency   creating programs that drive     messaging and creative to align   path to purchase, intercepting
& brand affinities                  mass personalization             with the appropriate moment       and influencing their journeys

Conquest Competitors                Proximity Target                 Leverage Insights                 Measure Impact
Target consumers in and             Identify consumers in &          Use insights on lifestyles &      Monitor how cross platform
around competitor locations         around store locations to        brand preferences to influence    advertising is driving visits to
to change their behavior with       drive them to purchase           future growth initiative          store locations, optimizing
conquesting messaging               specific products                                                  performance in real-time

                                                                                                                                          40
Activate
All leading DNP's
                       Everywhere
                       You Buy
All leading DSP's      Media.
                         Our targeting is available to
Leading Publishers       activate anywhere you buy. Your
                         platforms are our partners. This
                         includes deep partnerships with all
                         leading DSPs/DMPs, publishers
Leading Social Media
                         and ad networks, social, and
                         emerging channels like CTV and
                         out-of-home.
Leading CTV & OOH

                                                               41
Reach new customers
& align with the right   Build highly-customized, scalable audiences based
moments with             on real-world consumer behavior.

Foursquare's             Select from 1200+ ready-to-use audience available in
                         our Audience Designer and all major DSPs, DMPs, or
targeting solutions.     create highly-customized audiences in our self-serve UI.

                         Build accurate, custom geofences to reach consumers
                         in geo-contextual real-time moments.

                         Build accurate, custom geofences to reach consumers
                         based on where they are in real-time and key moments of
                         receptivity. Design your own custom segments in our self-
                         serve UI, or let us create segments that meet your goals

                                                                                     42
Measure the impact of
all your Q1 Targeting.
And understand the value of emerging channels.

• 13M always-on first party panel, the largest in the industry to
  measure incremental visit lift.

• Synthetic control group modeling accounts for the most
  accurate attribution solution.

• Available across 550+ partners, including major social
  networks like Twitter, Pinterest and Snap.

                                                                    43
Make Smarter Decisions With
Fresh, Rich Data About Places
Location data can play a game-changing role in strategic
decisions and in building better consumer experiences:

                          Keep track of which stores are opening
 Inform                   and closing
 Decision-
 Making                   Analyze the landscape in territory
                          mapping to prioritize & invest in
                          the right store locations

                         Surface rich content about local stores

 Improve                 Help consumers find the best spots near
                         them to shop, powering place search
 Experiences
                         based on category, or attributes that
                         are meaningful to users

       Learn more about: FSQ/Places                                44
Unlock real-time                                    / KEY USE CASES
location insights                                      Supply Chain Management
in minutes                                             Visualize supplier locations, distribution centers, and
                                                       vehicle routes to improve supply chain management
Foursquare Studio is a highly flexible geospatial
platform designed to analyze and visualize
large-scale data, faster than ever before.
                                                       Market Analysis
                                                       Improve market knowledge and assess potential risks
                                                       and benefits for real estate investments.

                                                       Understand Users
                                                       Compare visits to your locations versus the competition
                                                       over time with clear, visible representation of visit volume.

                                                       Site Selection
                                                       Identify or validate optimal locations for new outlets
                                                       through suitability & similarity analysis.

                                                                                                                       45
Thank You

     MC Duke
     Strategist, Research and Insights
     mduke@foursquare.com

     Emily Owayni
     Lead, Research and Insights
     eowayni@foursquare.com

                                         February 2023
                                         Confidential © Foursquare
You can also read