Free Economies are Clean Economies - NICK LORIS / 2021 A study of the correlation between economic freedom, limited government, open markets ...
←
→
Page content transcription
If your browser does not render page correctly, please read the page content below
Free Economies are
Clean Economies
A study of the correlation between economic freedom,
limited government, open markets, private property rights,
and environmental performance around the world.

NICK LORIS / 2021
INTRODUCTION
Political candidates don’t talk like this very much anymore:
In his Earth Day speech in 1992, then-presidential candidate President Bill Clinton said, “I believe it is time for a new era in en-
vironmental protection, which uses the market to help us get our environment back on track—to recognize that Adam Smith’s
invisible hand can have a green thumb.”1
Clinton’s advice is just as pertinent today as it was nearly 30 years ago. Embracing economic freedom unleashes free enter-
prise to improve the human condition and the environment. The connection between free societies and human flourishing is
undeniable. As economic freedom has improved around the world, the key indicators that measure human well-being have
improved as well. People live longer, healthier lives. Important social metrics including worldwide disease, hunger and poverty
have all fallen significantly even as the global population has grown.
Importantly, freer economies are cleaner economies. Many of the indicators that measure a country’s overall economic
freedom: property rights, investment freedom, trade freedom and strong institutions, are essential for environmental progress.
The correct economic and policy environment cultivates a system that rewards innovation, efficiency and stewardship. A
system rooted in economic freedom generates more wealth for individuals and societies, so they can invest in protecting the
environment.
This paper explores the relationship between economic freedom and environmental well-being through an examination of
data, principles and case studies. It provides a broad roadmap for how countries can meet their energy needs, raise levels
of prosperity and reduce pollution and waste. A pro-growth framework rooted in economic freedom is also important in
the context of global climate change. Free, competitive markets without heavy-handed government distortions will drive in-
vestments in cleaner, more efficient technologies and more resilient infrastructure. It will lead to a reduction of greenhouse
gas emissions and improve the ability to adapt to a changing climate. Global environmental issues like climate change are
wickedly complex; the best global solutions will come in the form of economic freedom.
A FREE ECONOMY IS A CLEAN ONE
When it comes to economic, social and environmental progress, there is much to celebrate:
• More than one billion people have risen out of extreme poverty over the past 30 years.2
• The share of the global population that is undernourished is trending downward.3
• In 2018, the number of people without access to electricity fell below one billion people for the first time ever.4
• Death rates from air pollution, particularly indoor air pollution, declined substantially from 1990-2017.5
• In the U.S., the Environmental Protection Agency’s latest air quality trends report shows that common air pollutants have
dropped a combined 77 percent since 1970.6
Despite taking significant strides forward in achieving a better quality of life and a healthier planet, we face a wide range of
socioeconomic and environmental challenges. Some environmental challenges are localized, whether it is invasive species
in a Great Lake or soil pollution in a Chinese province that stems from a number of industrial activities.7 Other issues are
regional in nature. India, for instance, has some of the world’s poorest air quality from coal generation, fuel exhaust, industrial
processes, crop burning and its geographic makeup.8 India’s pollution adversely affects the air quality of neighboring countries.
And other challenges are global collective action problems, such as ocean plastics and climate change.9 As discussed in more
detail in subsequent sections, the absence of drivers of economic freedom can cause or exacerbate these environmental
challenges.
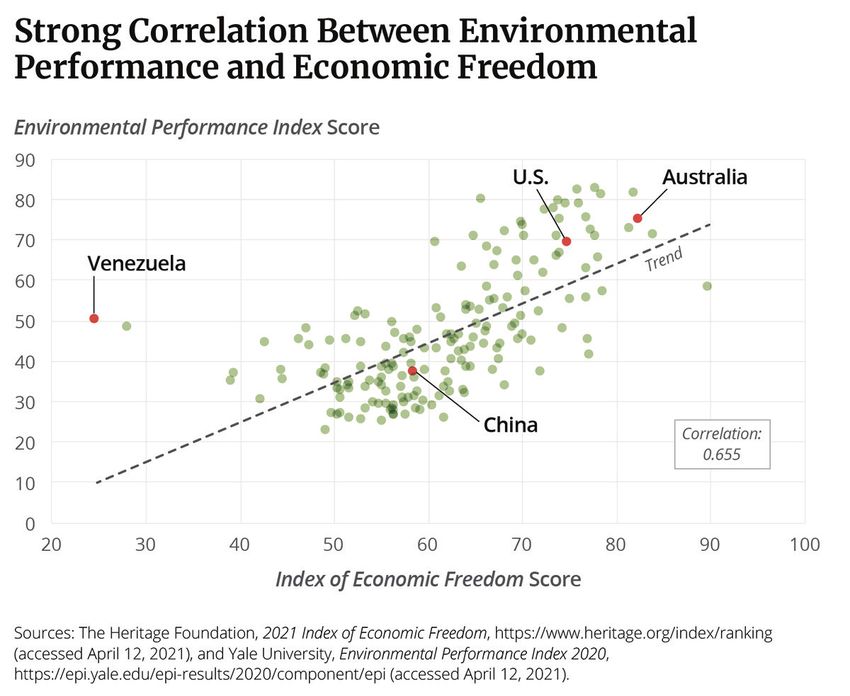
The Heritage Foundation launched its Index of Economic Freedom in 1995. Authors use several international datasets to
score nearly 180 countries from 0 to 100.10 The U.S. scores tallied a 74.8 in the 2021 Index, placing the country squarely in the
“mostly free” category and 21st in the world.
FREE ECONOMIES ARE CLEAN ECONOMIES | 2
The Index of Economic Freedom labels countries in one of five groupings based on their score (repressed, mostly unfree, mod-
erately free, mostly free and free). The indices in which the authors calculate the overall score include twelve sub-rankings in
the following four categories.
1. Rule of law: property rights, judicial effectiveness, and government integrity;
2. Government size: fiscal health, government spending and tax burden;
3. Regulatory efficiency: business freedom, labor freedom, and monetary freedom; and
4. Open markets: trade freedom, investment freedom, and financial freedom.
Perhaps the most comprehensive measurement of a country’s environmental performance is Yale University’s Environmental
Performance Index (EPI). The EPI, produced every other year, similarly scores a country on a 0-100 scale and includes 180
countries in its 2020 report.11 EPI includes 32 environmental indicators divided into 11 different issue categories. They fall into
two broad categories:
1. Environmental health: Air quality, sanitation & drinking water, heavy metals and waste management.
2. Ecosystem vitality: Biodiversity & habitat, ecosystem services, fisheries, water resources, climate change, pollution
emissions and agriculture.
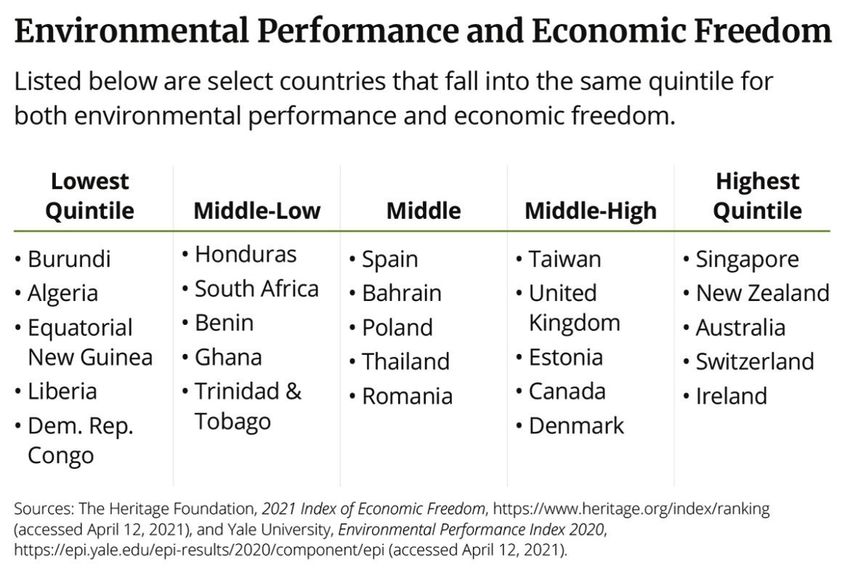
While the Index of Economic Freedom does not measure environmental performance, the sub-rankings are critical inputs of
a country’s environmental outcome. When correlating the two indices, a strong, positive relationship exists between eco-
nomically free economies and clean economies.12 The Fraser Institute in Canada, which also produces a country by country
ranking of economic freedom, analyzed the impact of economic freedom on air quality. In a 2014 report, authors concluded
that, “After controlling for the effects of income, political freedom, and other confounding variables, we find that a permanent
one-point increase in the Economic Freedom of the World index results in a 7.15% decrease in concentrations of fine partic-
ulate matter in the long-run, holding all else equal. This effect is robust to many different model specifications and is statisti-
cally significant.”13
The same study found some evidence of economic freedom resulting in lower carbon dioxide emissions, but the evidence was
not as compelling as improvements in localized air pollution. Other studies have found more promising results. A 2019 article
in the Journal of Developing Areas examined 24 African countries from 1995 to 2013 using trade freedom, business freedom,
freedom from corruption and fiscal freedom as proxies for economic freedom. The authors found an improvement in envi-
ronmental quality as measured by carbon dioxide emissions, with results on the different proxies varying by country income
levels.14
As shown in subsequent sections, the subcomponents that contribute to a country’s overall economic freedom are critical to
improving the environment and reducing the risks of global climate change.
FREE ECONOMIES ARE CLEAN ECONOMIES | 3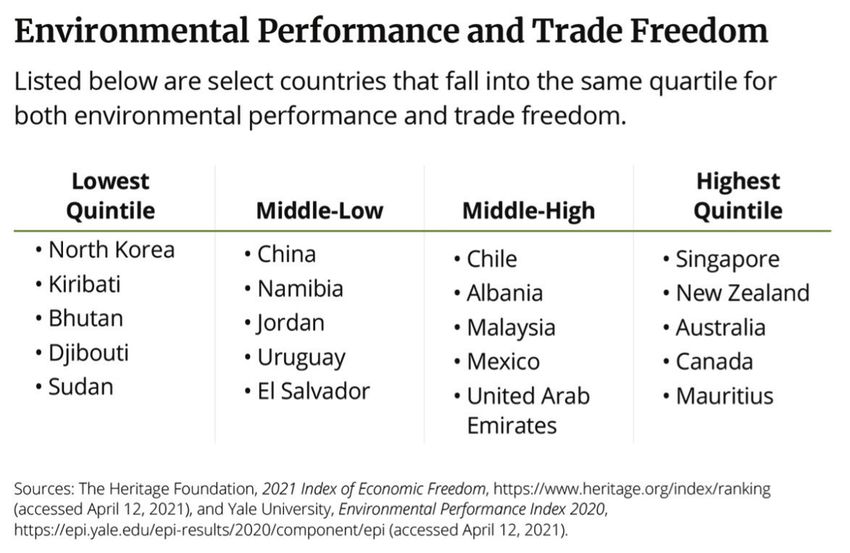
FREE ECONOMIES ARE CLEAN ECONOMIES | 4
WEALTH, PROSPERITY AND BENDING THE POLLUTION CURVE

Introductory economics teaches students the difference between inferior goods and normal goods. An individual buys less of
an inferior good as his income increases, such as one-ply toilet paper or cheap beer. For normal or luxury goods, the individual
buys more of that good when his income increases, switching from a cheap beer to craft beer or top-shelf scotch. Similarly,
taking care of the environment tends to be a luxury good. People care more and devote more resources to protecting the en-
vironment when they have the means to do so. For instance, a 2011 study in Climate Change Economics examined peoples’
attitudes toward global warming after the 2008 recession.15 The authors found that as a state’s unemployment rate increases,
Google searches for the term “global warming” decreases. Even in California, a declining economy changes how residents
prioritize issue areas, and is “associated with a significant decrease in county residents choosing the environment as the most
important policy issue.”16

As Yale’s Index shows, there is a strong correlation between gross domestic product per capita and a country’s environmental
score, noting that, “wealthy democracies typically rise to the top of our rankings.”17 The framework underpinning the trend
toward greater per capita wealth, stronger democracies, and less poverty is economic freedom. Consequently, an economic
system rooted in limited government and free enterprise should be central to a country’s environmental objectives.

To see how this looks in practice, one could turn to the environmental Kuznets curve (EKC), which depicts an inverted-U rela-
tionship between both pollution and economic development.18

                                                                          FREE ECONOMIES ARE CLEAN ECONOMIES | 5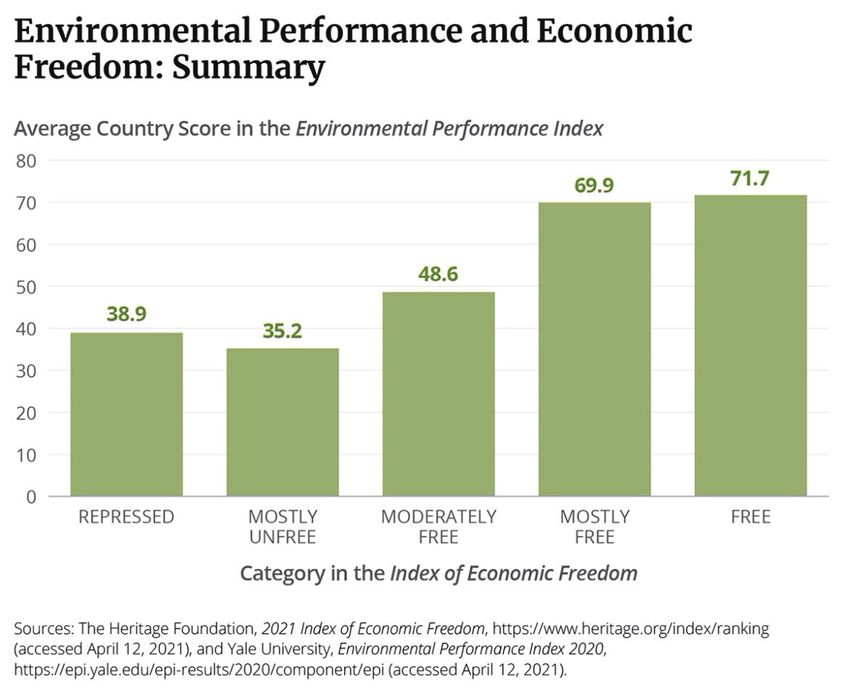
Economic growth initially leads to greater unwanted industrial byproducts as industrialization results in pollution and people
and institutions prioritize jobs and income over the health of the environment. Over time, however, that wealth means more
resources are available for environmental protection. Through a combination of government policies and through actions by
individuals and the private sector, countries reduce those unwanted environmental byproducts. Greater levels of wealth and
prosperity mean people will not only place a higher priority on environmental protection, but it means they can afford the
costs associated with pollution control technologies.

People with more wealth can afford products and technologies that make life easier, healthier and cleaner. Even products many
people take for granted, such as sanitizer, cleaning supplies and laundry detergents make life dramatically cleaner and healthier.
The availability of sewage, sanitation and garbage collection substantially reduce exposure to toxins, pollution and potential
diseases. As George Mason University economist Donald Boudreaux succinctly put it, we are “cleaned by capitalism.”19

The moment of when the inverted U in the Kuznets curve starts bending downwards depends on a number of factors and
does not uniformly apply to all emissions. Studies have tested the EKC hypothesis using carbon dioxide as a proxy for environ-
mental degradation, which shows mixed results. One study of Latin American and Caribbean countries confirmed an inverted
U relationship between GDP and carbon dioxide emissions.20 A 2019 article in the International Journal of Environmental
Studies tested the EKC hypothesis on 12 countries in east Africa, using income per capita and CO2 emissions and found a bell-
shape curve rather than an inverted U.21 Yet another study confirmed the EKC relationship between GDP and CO2 emissions
in just nine of 44 countries.22

                                                                            FREE ECONOMIES ARE CLEAN ECONOMIES | 6
Perhaps the most promising study comes from Aarhus University (Denmark) economics professor Christian Bjørnskov. His
2020 paper shows that, “The available data from 155 countries observed in five-year periods between 1975 and 2015 indicate
that economic freedom not only reduces overall CO2 emissions but also shifts the top point of the EKC to the left. As such,
the evidence suggests that the transition to lower emissions technology appears at an earlier stage in economically free
societies.”23
Although many studies use carbon dioxide as the environmental variable to test the EKC hypothesis, it is far from the only
metric we should consider. Academic literature has also surveyed the relationship between economic growth and environ-
mental metrics such as air pollution, water quality and soil degradation.24
For instance, a 2018 study in the Journal of Cleaner Production tested the EKC hypothesis on 15 low-, middle- and high-in-
come countries (45 total) using an “ecological footprint” indicator. The ecological footprint metric adds to the literature by
including a more comprehensive measurement of the environment. It includes direct and indirect environmental effects of
farming, grazing, fishing, forestry, lands available for CO2 absorption, and human infrastructure. The study found, “The eco-
logical footprint first tends to increase at initial level(s) of income, later tends to diminish through economic growth in each
income group countries,” supporting the EKC hypothesis.25
Certainly, economic growth alone does not solve all of our planet’s problems. Different environmental threats are unique,
complex and arise from a variety of issues and will likely warrant unique solutions. The emphasis on economic growth is not
to oversimplify complex challenges but instead underscore the fact that higher levels of wealth and prosperity cannot be
summarily dismissed, either. Economic growth’s contribution and importance to a cleaner, healthier environment is
unmistakable.
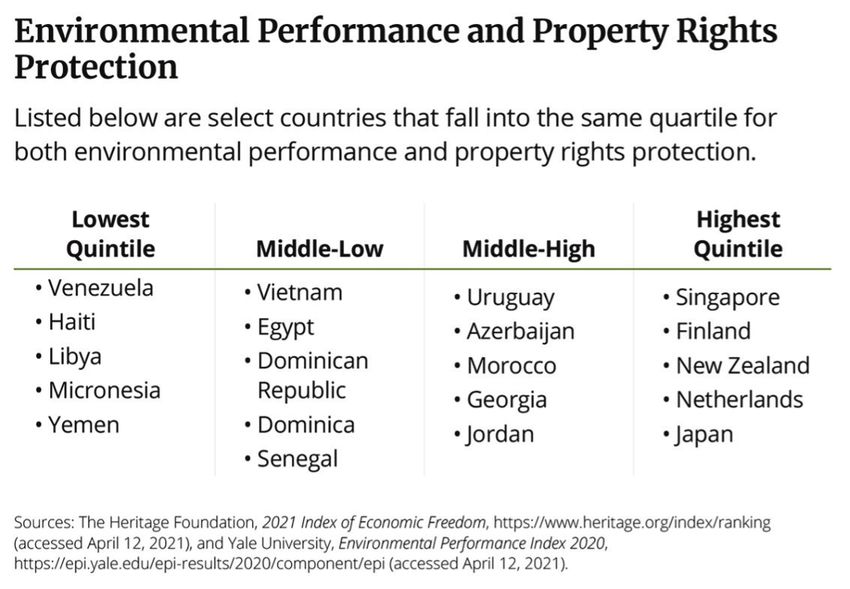
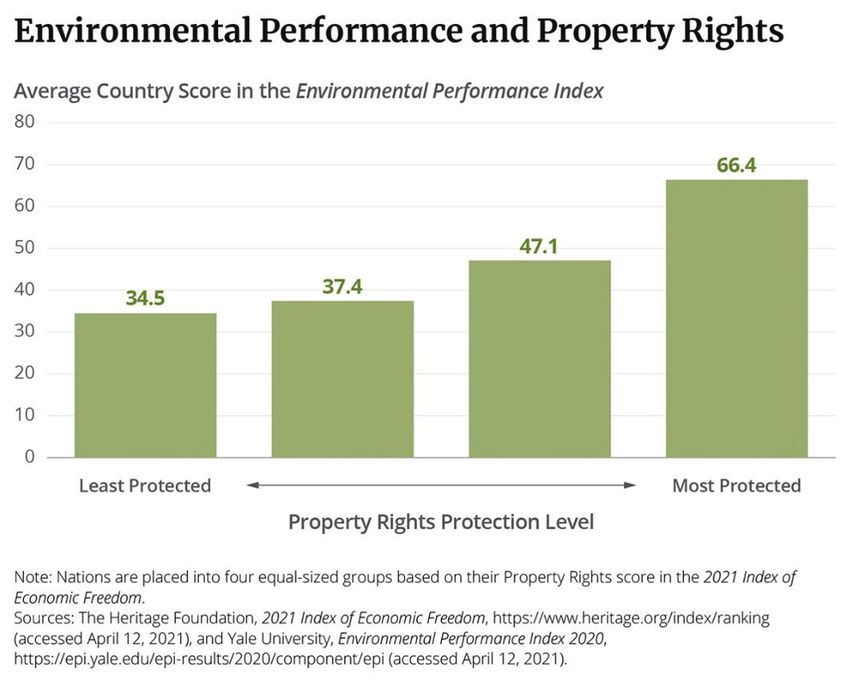
PROPERTY RIGHTS, STRONG INSTITUTIONS AND ENVIRONMENTAL PROTECTION
Incentives matter and drive behavior. They can drive people to make good decisions or perverse ones. The same holds true for
incentives that drive economic prosperity and environmental protection, which often go hand-in-hand given the right incen-
tives. In most instances, well-defined and protected property rights give an incentive structure and foundation that connects
the two.
The economist’s adage is that, “No one washes a rental car” because there is no incentive to do so. It is why people are more
inclined to litter in a public park or along a highway than in their own back yard. Not only does ownership incentivize environ-
mentally responsible behavior, but it also increases the value of the assets people own. Assets without properly defined and
protected property rights are often the root cause, or at the very least, a strong component of, environmental threats in the
U.S. and around the world.
Solutions are rooted in establishing property rights. It is why programs like adopt-a-highway reduce litter; the program
provides “ownership,” at least psychologically, of that strip of land that might otherwise fall victim to the tragedy of the
commons. Property rights were instrumental in increasing African rhino populations, because they changed the incentive
structure from treating the animals as a resource to be exploited as quickly as possible into an asset worth breeding and pro-
tecting.26 A 2020 study in the National Academy of Sciences analyzed satellite data in the Amazon from 1982 to 2016 and
found that, “observations inside territories with full property rights show a significant decrease in deforestation, while the
effect does not exist in territories without full property rights.”27
FREE ECONOMIES ARE CLEAN ECONOMIES | 7
FREE ECONOMIES ARE CLEAN ECONOMIES | 8
Property rights also incentivize responsible resource development. The United States is one of only a handful of countries
worldwide where private ownership of subsurface mineral rights exists.28 Consequently, production of shale deposits in the
U.S. financially rewards those owners as they voluntarily cooperate with energy companies. As a result, the U.S. has ascended
to become the world’s largest oil and natural gas producer. The energy boom has been a massive jobs and wealth creator.
According to the Dallas Federal Reserve, the shale revolution increased GDP one percent in 2015 relative to 2010. The authors
estimate that, “Given that the actual increase in U.S. GDP was 10 percent over the period, the shale boom accounted for
one-tenth of the overall increase. Although the oil sector makes up less than 1.5 percent of the economy, our results suggest
that the shale boom generated significant positive spillovers.”29

The increased supply also translated to meaningful savings for families and consumers. A 2019 Council of Economic Advisers
study found that increased production has saved U.S. consumers nearly $203 billion annually, which averages out to approx-
imately $2,500 for the average family of four. Importantly, private sector innovations and investment in new technologies
produced smaller environmental footprints on land, improved air quality, and has been the primary reason the U.S. is a
global leader in carbon dioxide emissions reductions from the energy sector.30 The 2020 Environmental Protection Agency
inventory on greenhouse gas emissions reported that, “since 2005, national greenhouse gas emissions have fallen by 10%,
and power sector emissions have fallen by 27% -- even as our economy grew by 25%.”31

Conversely, in most other countries the government owns the subsurface mineral rights. As a result, there is no direct financial
incentive for landowners and communities because the resource extraction would be perceived largely as all risk, no reward.
Politically, it is easier to ban or restrict such activities without fully weighing the costs and benefits. In other cases, the state
owns oil and gas companies, yielding worse economic and environmental outcomes. Without facing the pressure of a com-
petitive market, state-owned enterprises suffer from economic inefficiencies and subsidize the production and consumption
of fossil fuels.32 That leads to greater use and higher levels of pollution.33 Furthermore, state-owned enterprises face little
repercussion for any environmental damage they cause. As Edward Wong of the New York Times pointed out, “state-owned
enterprises that burn coal — including those in the power, steel and cement sectors — remain powerful and challenge official
efforts to limit coal consumption.”34

State ownership itself is problematic, but so too is the absence of rule of law. Private property rights mean little without strong
institutions to protect them. For instance, state-owned enterprises aren’t the only polluters in China. But as a country that is in
the “Mostly Unfree” category in Heritage’s Index and that holds a measly score of 46.4 for government integrity,35 the Chinese
government has consistently allowed pollution to go unchecked. As the Index emphasizes, “Protection of property rights
remains weak. All land in China is owned either by the state or by rural collectives. Land seizures are common. Theft of for-
eign-owned intellectual property is widespread. The Communist Party dominates the subservient judicial system. Corruption
remains endemic at all levels of government, and anecdotal information suggests that the government’s crackdown on corrup-
tion is applied inconsistently and discretionarily.”36

Brazil is another example. The country’s economy and environment have been plagued by a dearth of property rights and
rule of law, despite clear evidence that strong private property rights result in less deforestation and more conservation. The
Brazilian Amazon has suffered from illegal logging.37 Indigenous groups and others have legally used controlled fires to clear
land for farming, grazing and other economic activities; however, illegal activities and illegal burns resulted in increased air
pollution, carbon dioxide emissions and harm to the rainforest’s biodiversity.38

There is perhaps no better current example of the environmental problems caused by an absence of free markets and poor
institutions than Venezuela. In the 1970s Venezuela was one of the freest economies in the world, ranking tenth on the
Canadian Fraser Institute’s Index of Economic Freedom.39 It now ranks dead last in the Fraser Institute’s Index and second to
last in the Heritage Index.40 Over time, government ownership replaced foreign investment with corruption.41 Hugo Chavez
replaced specialized industry expertise with cronies. His regime diverted revenues that a private company would invest in
new capital, technologies and skilled labor to remain competitive toward military and social programs instead.42 The country
has now become so poor that even though it is awash in oil, people are dismantling equipment to sell the metal scraps just
to survive.43 Meanwhile, the government’s actions have devastated the environment. Oil is leaking from underwater wells,
refineries and pipelines. Oil has killed the ecosystems and the economic livelihood of fishermen living in the area.44 According

                                                                            FREE ECONOMIES ARE CLEAN ECONOMIES | 9
to a November 2020 New York Times report, “When it rains, oil that has oozed into the sewage system comes up through
manholes and drains, coursing with rainwater through the streets, smearing houses and filling the town with its gaseous
stench.”45 As Francisco Barrios bleakly put it, “There are no jobs, no gasoline, but the oil is spilling everywhere.”46

Venezuela is an extreme but cautionary tale of the economic and environmental consequences that come with the erosion of
economic freedom.

OPEN MARKETS AND THE ENVIRONMENT

Free, open markets are of great benefit to producers and consumers in the U.S. and around the world. They provide sellers
with more customers. Customers have better products and lower prices. When companies face more global competition, it
forces them to innovate and make cost competitive products that consumers value. Importing goods frees up Americans to be
productive in other sectors of the economy, increasing living standards for everyone.

Global free trade is responsible for raising billions of people out of poverty.47 Notably, there are environmental gains from
trade as well. Free trade encourages countries to specialize, producing goods in which they have a comparative advantage and
importing other goods from their trade partners. This benefits the economy and results in greater productivity, conserving
resources and avoiding waste.

Free trade critics contend the negative environmental effects caused by trade outweigh the economic gains, or at the very
least, they say, trade should come with stricter regulations. The argument is that trade increases the production and con-
sumption of goods, resulting in more resource exploitation, air pollution and environmental degradation. Further, trade will
cause an environmental race to the bottom and create “pollution havens” as industries will locate to the countries with the
weakest environmental standards.48 While trade can increase pollution as companies manufacture more goods, the relation-
ship between trade and the environment is more complex than that. Moreover, opponents of free trade for environmental
reasons often overlook the environmental benefits generated by trade, such as greater wealth for environmental protection
and the voluntary exchange of cleaner technologies.

The same holds true for the environmental benefits of increased foreign direct investment (FDI).49 A 2017 article in the
Annual Review of Environment and Resources found that, “On balance, the more recent papers find that there are significant
positive environmental spillovers from foreign to local firms and that on average FDI may have the effect of increasing energy
efficiency (hence lower pollution levels), although this is offset by increased production as demand for consumer goods
continues to grow.”50

With respect to trade, a 2001 journal article in the American Economic Review examined the relationship between trade and
the environment using sulfur dioxide concentrations. The researchers looked at three major aspects of international trade:
changes in production processes, changes in output and changes in location of production. The study found no empirical effect
on changes to location of production and therefore no justification for the pollution haven hypothesis. Other studies have found
pollution haven impacts, but the authors found them to be small and other factors outweighed the pollution haven effects.51

Furthermore, the AER article found that while increased trade does increase a nation’s pollution (by 0.3 percent) because
companies are producing more, the pollution reduction associated with an increase in wealth (1.4 percent) is even greater.
Their conclusion? “Combining our estimates of all three effects yields a somewhat surprising conclusion: freer trade appears
to be good for the environment.”52

Complementing the findings of the AER and other peer reviewed literature, the environmental benefits of trade have been
espoused by major international organizations. According to the Organization for Economic Co-operation and Develop-
ment, “Increased trade can in turn, by supporting economic growth, development, and social welfare, contribute to a greater
capacity to manage the environment more effectively.”53 In particular, trade facilitates the creation of newer, cleaner and more
efficient technologies. The same OECD report remarked that, “Open markets can improve access to new technologies that

                                                                         FREE ECONOMIES ARE CLEAN ECONOMIES | 10
make local production processes more efficient by diminishing the use of inputs such as energy, water, and other environmen-
tally harmful substances.”54
A 2019 report from The Economist Intelligence Unit highlighted the benefits trade can have for producers and consumers
of green products, thereby reducing carbon dioxide and other greenhouse gas emissions.55 Singapore, which ranks first in
the Index of Economic Freedom, purchases renewable power from Malaysia and Indonesia, two countries that have the land
capacity to develop alternative energy.56In the U.S., liquified natural gas (LNG) displaces demand for dirtier coal or dirtier
Russian gas.57 Prior to the current and proposed energy nationalization strategy implemented by Andrés Manuel López
Obrador in Mexico, the country’s 40 Free Trade Agreements enabled power producers to supply cost-competitive, subsi-
dy-free solar energy. Juan Manuel Ávila, Director of Top Energy México wrote, “[F]or example, a solar farm in Mexico can be
made of Chinese solar panels, Mexican steel, Spanish and Mexican engineering, German inverters, DC wiring from Europe,
AC wiring from the US, Australian monitoring systems and German commissioning. And when every one of the goods and
services previously mentioned are purchased because of their quality and price, the final result is a $18 per Megawatt-hour
(Mwh), or 1.8 cents per kilowatt hour, solar farm in the central and sunny state of Aguascalientes.”58
FREE ECONOMIES ARE CLEAN ECONOMIES | 11Removing tariffs and other nontariff barriers would reduce the costs of renewable energy, more energy efficient products and
greener agriculture practices.59 A 2018 report from the World Trade Organization and the United Nations estimated that, “The
top 18 developing countries ranked by greenhouse gas emissions would be able to import 63 percent more energy-efficient
lighting, 23 percent more wind power generation equipment, and 14 percent more solar power generation equipment if the
trade barriers they maintain on these goods were to be abolished.”60
In addition, trade agreements can be a tool to crack down on illegal fishing and logging activities and can help reduce fossil
fuel subsidies. It is critical that free trade agreements not manage trade with strict and unnecessary regulations but instead
create the framework for voluntary exchange between people.
REGULATORY EFFICIENCY AND THE ENVIRONMENT
It is no secret that Microsoft co-founder Bill Gates cares deeply about climate change. Gates understands that to deliver deep
decarbonization, the entire world needs to buy in. That’s no easy task. He also understands that a climate strategy centered
on restricting growth will not work for people who need affordable, reliable energy (a priority he also cares deeply about),
but also not work in terms of meaningfully reducing emissions.61 What should draw the most attention, however, is Gates’
approach to solutions. Gates wants innovation-based solutions to reduce what he calls “the green premium.” In effect, how
can we reduce the cost of emissions-free technologies, whether nuclear, renewables or some other technology, so that it will
be in the self-interest of countries to choose these sources of energy? To reduce that green premium Gates says, “there’s an
opening for new technologies, companies and products that make it affordable.”62
Innovation and investment in new technologies will help conserve energy, water and other resources, reducing a company’s
environmental footprint. This holds true not just for energy generation but for transportation, manufacturing, new buildings
and just about every sector of the economy. New businesses also provide greater access to information for families and busi-
nesses to make better financial decisions that save money but also save on resource use and reduce pollution.
FREE ECONOMIES ARE CLEAN ECONOMIES | 12A critical component of deploying greener technologies is to create a framework that actually empowers the private sector
to innovate, invest and build in a timely fashion. In that regard, business freedom is essential. A major component of the
Heritage Foundation measurement of regulatory efficiency is the, “extent to which the regulatory and infrastructure environ-
ments constrain the efficient operation of businesses.”63
With a foundation of strong business freedom and regulatory discipline, businesses are better able to meet the always
changing needs of consumers. On a small scale, individuals and companies have a financial reason to do more with less.
When they use less energy, plastic or other resources, they save money. Moreover, innovative ideas spring up organically to
provide consumers with products they did not even know they wanted. As a result, people can freely choose green products
such as Nest thermostats, plant-based burgers and apps that customize public transit rides.64
Conversely, regulatory inefficiency can stunt the growth of clean technologies. In the U.S., even as companies built more
reactors the commercial nuclear power sector faced significantly higher construction costs (50% to 200%) because of
regulatory changes after Three Mile Island.65 No person died from that incident and any negative health and environmental
impacts were practically undetectable.66
To be sure, the U.S. is still one of the global leaders when it comes to attracting entrepreneurial talent and business invest-
ment. Nevertheless, the growth of the regulatory state and lawsuits can tie projects up for years, for little to no environmental
benefit.67
Another measure of more comprehensively analyzing a country’s regulatory climate for starting and operating a business
is the World Bank’s “Ease of Doing Business Index.” The World Bank uses ten major indices including: “starting a business,
dealing with construction permits, getting electricity, registering property, getting credit, protecting minority investors, paying
taxes, trading across borders, enforcing contracts, and resolving insolvency.”68 Similar to the relationship between the Index of
Economic Freedom and Environmental Performance Index, this yardstick finds a strong, positive correlation between the Ease
of Doing Business Index and EPI.69
FREE ECONOMIES ARE CLEAN ECONOMIES | 13GOVERNMENT SIZE AND THE ENVIRONMENT
An important metric for how economically free a country is can be found by looking at how much the government spends and
how much the government taxes its people. Sound tax and fiscal policy also have important implications for the deployment
of more environmentally benign technologies.
Good tax policy encourages investment in new technologies and equipment that are cleaner and more efficient. One
example is full and immediate expensing. Full expensing is a pro-growth tax policy that allows companies to deduct new
capital expenses from their taxable income in the year the investments are made. The alternative is to spread the cost of new
capital equipment over time using complex formulas that benefit accountants more than businesses. Heritage Foundation tax
analyst Adam Michel writes, “While lower tax rates are an important part of tax reform, expensing provides a larger economic
gain because it is forward-looking, removing the current system’s bias against new investment.”70
A 2021 Tax Foundation report describes in detail the environmental benefits generated from expensing provisions.71 Full
expensing would increase financial returns on renewable energy projects and spur investment in energy efficient equipment.
Businesses are more incentivized to replace older, less environmentally friendly equipment, such as an old HVAC system, with
a new one. Overall, the increase in capital stock turnover from energy systems to manufacturing equipment saves energy and
reduces pollution and emissions.72
When the Tax Cuts and Jobs Act of 2017 became law, it provided immediate expensing. Executive Director at the EPDM
Roofing Association Jared Blum remarked, “By reducing the first cost of roof replacement by approximately 28 to 30%, this
FREE ECONOMIES ARE CLEAN ECONOMIES | 14will incentivize building owners to upgrade their insulation levels and incorporate higher performance roofing systems like
vegetative roofs that assist in stormwater runoff, and will add to building resilience and energy efficiency. The new incentive
will speed up the payback for high thermal performance investments, a typical factor considered during roof improvements.”73
A pro-growth, forward looking tax policy will remove biases against efficiency upgrades. If full and immediate expensing
included research and development expenses, it would also encourage more early-stage investment from the private sector
for cleaner, innovative technologies.
Of course, tax policy that picks winners and losers among energy technologies (as opposed to lower rates broadly available
to all industries) can produce inefficient economic and environmental outcomes. The justification for tax subsidies is usually
predicated on helping infant industries grow, encouraging innovation, offsetting alleged market failures, or helping struggling
industries. Government spending on green technologies may lower emissions, but it is important to consider: at what cost?
For instance, targeted tax credits for electric vehicles that attempt to nudge consumers away from the internal combustion
engine have benefitted wealthy individuals but delivered only negligible environmental benefit. Even without accounting for
the full lifecycle costs of an EV (mining, manufacturing and disposing of the battery), EV subsidies are a very expensive way of
reducing carbon dioxide emissions.74 Studies have also estimated that tax credits for renewable energy production in the U.S.
carry relatively high carbon dioxide abatement costs.75 Consequently, there is not much bang for the subsidized buck.
In the U.S. subsidies take shape in many forms beyond targeted tax credits. Federal and state governments also provide
grants, loans, loan guarantees and subsidized insurance for activities including nuclear and offshore drilling. Moreover, 30
states and the District of Columbia have renewable portfolio standards that mandate that regulated electric utilities sell a
certain percentage of renewable power in a given year.76 University of Chicago economists estimate that the “cost per ton of
CO2 abatement ranges from $58-$298 and is generally above $100.”77
Around the world, government ownership of energy companies is, in effect, a massive subsidy for fuel sources including oil
and gas where a country’s economy is inextricably linked to fuel production. According to the International Monetary Fund
(IMF), fossil fuel companies around the world receive about $4.7 trillion in direct and indirect subsidies each year. Much of
this is driven by state ownership or hidden costs that the IMF alleges are not accounted for rather than a direct subsidy.78
Another estimate from the International Energy agency estimates fossil fuel subsidies to be $320 billion with Iran, China,
Saudi Arabia and Russia as the top fossil fuel subsidizing countries.79 Yet another estimate from the International Renewable
Energy Agency projects direct fossil fuel subsidies to be $447 billion and $166 billion for renewable energy.80
While U.S. fossil fuel subsidies exist and should be eliminated,81 the industry is directly subsidized to a far less extent than
commonly believed. In America, federal renewable subsidies dwarf fossil fuel subsidies on both and absolute and per unit of
energy basis.82 A 2018 report from the U.S. Energy Information Administration analyzed 2016 data and calculated renewable
subsidies to be $6.68 billion per year and fossil fuel subsidies to be $489 million.
Much like U.S. subsidies, the environmental payoff for green subsidies overseas may not be worth it. For instance, Bloomberg
New Energy Finance estimates that, “an electric vehicle in Germany would take more than 10 years to break even with an
efficient combustion engine’s emissions.”83 Biofuel subsidies around the world have resulted in the increased clearance of land
and forests for crop use as well as the increased use of fertilizers, insecticides, and pesticides.84
Subsidies have harmful effects beyond their direct cost. They may offer short-term help to specific industries, but they have
adverse effects in encouraging cronyism and dependence on preferential treatment and distort the market in ways that do
much more harm than good. Government support that targets one group or industry artificially props up that market. Rather
than increase competition, a special endorsement from the government gives one technology an unfair price advantage over
other ones. Subsidies that put a thumb on the scale of investment dictate how firms allocates resources. Not only does the
preferential treatment incentivize additional lobbying and politicking to keep and extend these subsidies, subsidies steer
FREE ECONOMIES ARE CLEAN ECONOMIES | 15investment away from other potentially promising ideas. Those opportunity costs are the unseen effects of government
subsidies.
If a project makes economic sense, however, the investments will occur without the subsidy. In that case, the subsidies simply
offset the private-sector investments that would have been made either way. Chile, for example, ranks 19th in the Heritage
Index. It has strong scores in rule of law and business freedom. In 2015 (when Chile ranked 7th in the world for economic
freedom85), French-based Total and American-based SunPower Corp announced they would build a subsidy-free solar array in
Chile. Bernard Clement, senior vice president at Total New Energies said at the time, “As one of the world’s largest operating
solar merchant power plants, PV Salvador represents an important milestone for the electricity generation industry, proving
that solar can provide wholesale power at competitive prices in completely unsubsidized market.”86
Pro-growth tax reforms evenly applied to all industries and eliminating government distortions are consumer centric policies
that will reward innovative competitiveness over political connectedness. They will protect the taxpayer and help protect the
environment.
CONCLUSION
Environmental challenges can range from removing an invasive species from a lake to preventing plastic waste from being
dumped in the oceans to reducing excessive carbon dioxide emissions.
In every case, free societies are best equipped to address such challenges. As a country, and as a planet, we should strive for
cleaner and healthier environments for both current and future generations. We should do that not only by protecting peoples’
liberty but by harnessing the power of it. Fundamentally, free economies are clean economies where both people and planet
can flourish.
Nick Loris is the Deputy Director of the Thomas A. Roe Institute for Economic Policy Studies and Herbert and Joyce Morgan Fellow in
Energy and Environmental Policy at The Heritage Foundation.
Emily Nichols, junior at the College of the Holy Cross and Intern at The Heritage Foundation, made valuable contributions to this
paper.
FREE ECONOMIES ARE CLEAN ECONOMIES | 16WORKS CITED
¹ C-Span, “Clinton Campaign Speech,” April 22, 1992, https://www.c-span.org/video/?25724-1/clinton-campaign-speech
(accessed March 17, 2021).
2
The World Bank, “Decline of Global Extreme Poverty Continues but Has Slowed: World Bank,” September 19, 2018, https://
www.worldbank.org/en/news/press-release/2018/09/19/decline-of-global-extreme-poverty-continues-but-has-slowed-
world-bank (accessed March 17, 2021).
3
Max Roser and Hannah Ritchie, “Hunger and Undernourishment,” Our World in Data, 2019, https://ourworldindata.org/hun-
ger-and-undernourishment (accessed March 17, 2021).
4
Laura Cozzi, Olivia Chen, Hannah Daly, and Aaron Koh, “Population without access to electricity falls below 1 billion,” In-
ternational Energy Agency, October 30, 2018, https://www.iea.org/commentaries/population-without-access-to-electrici-
ty-falls-below-1-billion (accessed March 17, 2021).
5
Hannah Ritchie and Max Roser, “Air Pollution,” Our World in Data, last updated November 2019, https://ourworldindata.org/
air-pollution (accessed March 17, 2021).
6
United States Environmental Protection Agency, “Our Nation’s Air: Air Quality Improves as America Grows,” 2020, https://
gispub.epa.gov/air/trendsreport/2020/#introduction (accessed March 17, 2021).
7
David Stanway, “China soil pollution efforts stymied by local governments: Greenpeace,” Reuters, April 16, 2019, https://
www.reuters.com/article/us-china-pollution-soil/china-soil-pollution-efforts-stymied-by-local-governments-green-
peace-idUSKCN1RT04D (accessed March 17, 2021).
8
Nilanjana Bhowmick, “In New Delhi, burning season makes the air even more dangerous. Can anything be done?,” National
Geographic, November 13, 2020, https://www.nationalgeographic.com/environment/article/new-delhi-burning-season-
makes-air-even-more-dangerous-can-anything-be-done (accessed March 17, 2021).
9
While climate change can affect regions differently, where the collection of carbon dioxide and other greenhouse gas
emissions in the atmosphere originates affects the global climate all the same. Joseph Majkut, “Climate Science: A Guide
to the Public Debate,” The Niskanen Center, March 8, 2017, https://www.niskanencenter.org/wp-content/uploads/old_
uploads/2017/03/NISKANEN-CLIMATE-PRIMER-2017-03-13.pdf (accessed March 17, 2021).
The Heritage Foundation, “Methodology,” 2021 Index of Economic Freedom, https://www.heritage.org/index/pdf/2021/
10
book/02_2021_IndexOfEconomicFreedom_METHODOLOGY.pdf (accessed March 17, 2021).
11
Yale University, “Environmental Performance Index 2020,” https://epi.yale.edu/downloads/epi2020report20210112.pdf
(accessed March 17, 2021).
12
Yale’s report finds a similar positive correlation. “Finally, we find that economic liberalism is positively associated with en-
vironmental performance. While our results do not give countries carte blanche to pursue laissez-faire economic strategies
without regard for the environment, they do cast doubt on the implicit tension between economic development and environ-
mental protection.”
15
Matthew E. Kahn and Matthew J. Kotchen, “Environmental Concern and the Business Cycle: The Chilling Effect of Recession,”
National Bureau of Economic Research, July 2010, https://www.nber.org/papers/w16241 (accessed March 17, 2021).
16
Matthew E. Kahn and Matthew J. Kotchen, “Environmental Concern and the Business Cycle: The Chilling Effect of Recession,”
National Bureau of Economic Research, July 2010, https://www.nber.org/papers/w16241 (accessed March 17, 2021).
Yale University, “Environmental Performance Index 2020,” https://epi.yale.edu/downloads/epi2020report20210112.pdf
17
(accessed March 17, 2021).
FREE ECONOMIES ARE CLEAN ECONOMIES | 1718
Originally, Kuznets examined the relationship between GDP and income inequality. See, Bruce Yandle, Maya Vijayaraghavan,
and Madhusudan Bhattarai, “The Environmental Kuznets Curve: A Primer,” The Property and Environment Research Center,
May 2002, https://www.perc.org/wp-content/uploads/2018/05/environmental-kuznets-curve-primer.pdf (accessed March
17, 2021).
Donald J. Boudreaux, “Cleaned by Capitalism,” The Foundation for Economic Education, February 1, 2000, https://fee.
19
org/articles/cleaned-by-capitalism/?__cf_chl_jschl_tk__=c262c641548e931fc6ffe43c928a73449fd60062-1615213787-
0-AVHcQXSM8C5shgcZ5h8BNZR1HXxnZnV1eerekOu_HObyHQ9yKKRkBWza95_lrEyvya0weHTPp7FNrX87vMS0N0ze-
KYjeoy2oUN5j5HOCBx4LxaOBaMwkiWhngZBU0xeQBYVdpigKz6d9KGH9d7QTM8oEnzVKKXn_UUnZZ8uoPFaq6cPUC-
2nOMx5BIAB8j9zFi32AjAxm8-GxdMRfRNnHMikMN88skt-t06XDcoo0_gW5QUJ7dqs4bA3lLfUNeffkNdmNicqng7o-
JA3eYTIgbJ9AcHg_aZ68TSdlCr9MYfkskD0Ef1Jx7uov1eD2z_P2DuS7MMvV2Af8DZNy0AiYNsJKh7702ZZfdDdZ8BNPjPFPN
(accessed March 17, 2021).
20
Usama Al-mulali, Chor Foon Tang, and Ilhan Ozturk, “Estimating the Environment Kuznets Curve hypothesis: Evidence from
Latin America and the Caribbean countries,” Renewable and Sustainable Energy Reviews, Vol. 50, pp. 918-924, October 2015,
http://openaccess.cag.edu.tr/xmlui/bitstream/handle/20.500.12507/567/%C4%B0lhan%20%C3%96ZT%C3%9CRK.pd-
f?sequence=1&isAllowed=y (accessed March 17, 2021).
21
Sisay Demissew Beyene and Balázs Kotosz, “Testing the environmental Kuznets curve hypothesis: an empirical study for East
African countries,” International Journal of Environmental Studies, Vol. 77, pp. 636-654, November 28, 2019, https://www.
tandfonline.com/doi/pdf/10.1080/00207233.2019.1695445?needAccess=true (accessed March 17, 2021).
22
Nutnaree Maneejuk, Sutthipat Ratchakom, Paravee Maneejuk, and Woraphon Yamaka, “Does the Environmental Kuznets
Curve Exist? An International Study,” Sustainability, November 2, 2020, https://www.mdpi.com/2071-1050/12/21/9117
(accessed March 17, 2021)
23
Bjørnskov, Christian, Economic Freedom and the CO2 Kuznets Curve (January 8, 2020). Available at SSRN: https://ssrn.
com/abstract=3508271 or http://dx.doi.org/10.2139/ssrn.3508271
24
Bruce Yandle, Maya Vijayaraghavan, and Madhusudan Bhattarai, “The Environmental Kuznets Curve: A Primer,” The
Property and Environment Research Center, May 2002, https://www.perc.org/wp-content/uploads/2018/05/environmen-
tal-kuznets-curve-primer.pdf (accessed March 17, 2021); and Sisay Demissew Beyene and Balázs Kotosz, “Testing the envi-
ronmental Kuznets curve hypothesis: an empirical study for East African countries,” International Journal of Environmental
Studies, Vol. 77, pp. 636-654, November 28, 2019, https://www.tandfonline.com/doi/pdf/10.1080/00207233.2019.169544
5?needAccess=true (accessed March 17, 2021).
25
Recep Ulucak and Faik Bilgili, “A reinvestigation of EKC model by ecological footprint measurement for high, middle and low
income countries,” Journal of Cleaner Production, Vol. 188, pp. 144-157, July 1, 2018, https://www.sciencedirect.com/science/
article/abs/pii/S095965261830862X (accessed March 17, 2021).
Michael ‘t Sas-Rolfes, “Saving African Rhinos: A Market Success Story,” The Property and Environment Research Center,
26
2011, https://www.perc.org/wp-content/uploads/2011/08/Saving-African-Rhinos-final.pdf (accessed March 17, 2021).
27Kathryn Baragwanath and Ella Bayi, “Collective property rights reduce deforestation in the Brazilian Amazon,” Pro-
ceedings of the National Academy of Sciences of the United States of America, August 25, 2020, https://www.pnas.org/
content/117/34/20495 (accessed March 17, 2021).
28
Hobart M. King, “Mineral Rights: Basic information about mineral, surface, oil and gas rights,” Geology.com, https://geology.
com/articles/mineral-rights.shtml (accessed March 17, 2021).
FREE ECONOMIES ARE CLEAN ECONOMIES | 18Mine Yücel and Michael D. Plante, “GDP Gain Realized in Shale Boom’s First 10 Years,” Federal Reserve Bank of Dallas,
29
August 20, 2019, https://www.dallasfed.org/research/economics/2019/0820 (accessed March 17, 2021).
30
Energy In Depth, “Compendium of Studies Demonstrating the Safety and Health Benefits of Fracking,” 2017, https://
eidhealth.org/wp-content/uploads/2017/04/Positive-Health-Compendium.pdf (accessed March 17, 2021); and United States
Energy Information Administration, “U.S. Energy-Related Carbon Dioxide Emissions, 2019,” September 2020, https://www.
eia.gov/environment/emissions/carbon/ (accessed March 17, 2021).
Press release, “Latest Inventory of U.S. Greenhouse Gas Emissions and Sinks Shows Long-Term Reductions, with Annual
Variation,” U.S. Environmental Protection Agency, April 13, 2020, https://www.epa.gov/newsreleases/latest-inventory-us-
greenhouse-gas-emissions-and-sinks-shows-long-term-reductions-0 (accessed March 24, 2021).
31
Institute for Energy Research, “Global Fossil Fuel Consumption Subsidies Abound, But Not in the United States,” April 2,
2018, https://www.instituteforenergyresearch.org/fossil-fuels/global-fossil-fuel-consumption-subsidies-abound-not-unit-
ed-states/ (accessed March 17, 2021).
32
Institute for Energy Research, “Global Fossil Fuel Consumption Subsidies Abound, But Not in the United States,” April 2,
2018, https://www.instituteforenergyresearch.org/fossil-fuels/global-fossil-fuel-consumption-subsidies-abound-not-unit-
ed-states/ (accessed March 17, 2021).
33
Institute for Energy Research, “Global Fossil Fuel Consumption Subsidies Abound, But Not in the United States,” April 2,
2018, https://www.instituteforenergyresearch.org/fossil-fuels/global-fossil-fuel-consumption-subsidies-abound-not-unit-
ed-states/ (accessed March 17, 2021).
34
Edward Wong, “Nearly 14,000 Companies in China Violate Pollution Rules,” The New York Times, June 13, 2017, https://
www.nytimes.com/2017/06/13/world/asia/china-companies-air-pollution-paris-agreement.html (accessed March 17, 2021).
The Heritage Foundation, “China,” 2021 Index of Economic Freedom, https://www.heritage.org/index/country/china
35
(accessed March 17, 2021).
The Heritage Foundation, “China,” 2021 Index of Economic Freedom, https://www.heritage.org/index/country/china
36
(accessed March 17, 2021).
Pedro H. S. Brancalion, Danilo R. A. de Almeida, Edson Vidal, Paulo G. Molin, Vanessa E. Sontag, Saulo E. X. F. Souza, and
37
Mark D. Schulze, “Fake legal logging in the Brazilian Amazon,” Science Advances, August 15, 2018, https://advances.sci-
encemag.org/content/4/8/eaat1192 (accessed March 17, 2021).
38
Linda Givetash, “The Amazon is still on fire. Conservation groups blame illegal logging and criminal networks,” NBC,
September 22, 2019, https://www.nbcnews.com/news/world/amazon-still-fire-conservation-groups-blame-illegal-log-
ging-criminal-networks-n1056236 (accessed March 17, 2021); and Liz Kimbrough, “More than 260 major, mostly illegal
Amazon fires detected since late May,” Mongabay, August 13, 2020, https://news.mongabay.com/2020/08/more-than-
260-major-mostly-illegal-amazon-fires-detected-since-late-may/ (accessed March 17, 2021).
The Heritage Foundation Index began in 1995. Fred McMahon, “Venezuela’s tragedy fed by cronyism and the death of free
39
markets,” The Globe and Mail, August 13, 2016, https://www.theglobeandmail.com/opinion/venezuelas-tragedy-fed-by-cro-
nyism-and-the-death-of-free-markets/article31388305/ (accessed March 17, 2021).
40
The Fraser Institute, “Economic Freedom Ranking 2018,” https://www.fraserinstitute.org/economic-freedom/map?geo-
zone=world&page=map&year=2018 (accessed March 17, 2021); and The Heritage Foundation, “Country Rankings,” 2021
Index of Economic Freedom, https://www.heritage.org/index/ranking (accessed March 17, 2021).
FREE ECONOMIES ARE CLEAN ECONOMIES | 1941
Amelia Cheatham and Rocio Cara Labrador, “Venezuela: The Rise and Fall of a Petrostate,” Council on Foreign Relations
Backgrounder, last updated January 22, 2021, https://www.cfr.org/backgrounder/venezuela-crisis (accessed March 17, 2021).
42
Frank A. Verrastro and Andrew J. Stanley, “The Oil Industry Won’t Save Venezuela,” Center for Strategic and International
Studies, March 28, 2019, https://www.csis.org/analysis/oil-industry-wont-save-venezuela (accessed March 17, 2021).
43
Fabiola Zerpa and Peter Millard, “Venezuela Is Plucking Pieces Off Oil Pipelines to Sell as Scrap,” Financial Post, September
11, 2020, https://financialpost.com/pmn/business-pmn/venezuela-is-plucking-pieces-off-oil-pipelines-to-sell-as-scrap
(accessed March 17, 2021).
44
Fabiola Zerpa, Peter Millard, and Andrew Rosati, “Toxic Spills in Venezuela Offer a Bleak Vision of the End of Oil,” Bloomberg
Green, December 15, 2020, https://www.bloomberg.com/news/features/2020-12-15/oil-spills-in-venezuela-offer-bleak-vi-
sion-of-what-lies-ahead?sref=vxSzVDP0 (accessed March 17, 2021).
45
Sheyla Urdaneta, Anatoly Kurmanaev, and Isayen Herrera, “Venezuela, Once an Oil Giant, Reaches the End of an Era,” The
New York Times, last updated November 26, 2020, https://www.nytimes.com/2020/10/07/world/americas/venezue-
la-oil-economy-maduro.html (accessed March 17, 2021).
46
Sheyla Urdaneta, Anatoly Kurmanaev, and Isayen Herrera, “Venezuela, Once an Oil Giant, Reaches the End of an Era,” The
New York Times, last updated November 26, 2020, https://www.nytimes.com/2020/10/07/world/americas/venezue-
la-oil-economy-maduro.html (accessed March 17, 2021).
The World Bank, “The Role of Trade in Ending Poverty,” Joint Publication by the World Bank Group and the World Trade
47
Organization, 2015, https://www.worldbank.org/en/topic/trade/publication/the-role-of-trade-in-ending-poverty (accessed
March 17, 2021).
48
Ian Sheldon, “Trade and Environmental Policy: A Race to the Bottom?,” Journal of Agriculture Economics, Vol. 57, No. 3, pp.
365-392, June 2006, https://aede.osu.edu/sites/aede/files/publication_files/Trade%20and%20Environmental%20Policy.pdf
(accessed March 17, 2021).
Matthew A. Cole, Robert J.R. Elliott, and Liyun Zhang, “Foreign Direct Investment and the Environment,” Annual Review
49
of Environment and Resources, Vol. 42, pp. 465-487, October 2017, https://www.annualreviews.org/doi/full/10.1146/an-
nurev-environ-102016-060916 (accessed March 17, 2021).
50
Ibid.
51
Matthew A. Cole, “Trade, the pollution haven hypothesis and the environmental Kuznets curve: examining the linkages,”
Ecological Economics, Vol. 48, Issue 1, pp. 71-81, January 2004, https://www.sciencedirect.com/science/article/abs/pii/
S0921800903002556 (accessed March 17, 2021).
Werner Antweiler, Brian R. Copeland, and M. Scott Taylor, “Is Free Trade Good for the Environment?,” American Economic
52
Review, Vol. 91, No. 4, pp. 877-908, September 2001, https://www.aeaweb.org/articles?id=10.1257/aer.91.4.877 (accessed
March 17, 2021).
Organization for Economic Co-operation and Development, “Trade and the environment: How are trade and environmental
53
sustainability compatible?,” https://www.oecd.org/trade/topics/trade-and-the-environment/ (accessed March 17, 2021).
Organization for Economic Co-operation and Development, “Trade and the environment: How are trade and environmental
54
sustainability compatible?,” https://www.oecd.org/trade/topics/trade-and-the-environment/ (accessed March 17, 2021).
FREE ECONOMIES ARE CLEAN ECONOMIES | 2055
The Economist Intelligence Unit, “Climate change and trade agreements: Friends or foes?,” The Economist, 2019, https://
iccwbo.org/content/uploads/sites/3/2019/03/icc-report-trade-and-climate-change.pdf (accessed March 17, 2021).
Shery Ahn and Dan Murtaugh, “Singapore wants to trade renewable energy with its neighbors,” Renewable Energy World,
56
November 4, 2019, https://www.renewableenergyworld.com/solar/singapore-wants-to-trade-renewable-energy-with-its-
neighbors/#gref (accessed March 18, 2021).
57
Sam Winstel, “U.S. LNG Exports Fuel Natural Gas Consumption In South Asia,” American Petroleum Institute, August 31,
2020, https://www.api.org/news-policy-and-issues/blog/2020/08/31/lng-exports-fuel-natural-gas-consumption-south-
asia (accessed March 18, 2021); and Selina Roman-White, Srijana Rai, James Littlefield, Gregory Cooney, and Timothy J.
Skone, “Life Cycle Greenhouse Gas Perspective on Exporting Liquefied Natural Gas from the United States,” National Energy
Technology Laboratory, September 12, 2019, https://www.energy.gov/sites/prod/files/2019/09/f66/2019%20NETL%20
LCA-GHG%20Report.pdf (accessed March 18, 2021).
Juan Manuel Ávila, “Can free trade deliver cheaper renewable energy? Ask Mexico,” World Economic Forum, January 24,
58
2019, https://www.weforum.org/agenda/2019/01/can-free-trade-deliver-cheaper-renewable-energy-ask-mexico/ (accessed
March 18, 2021).
59
The Economist Intelligence Unit, “Climate change and trade agreements: Friends or foes?,” The Economist, 2019, https://
iccwbo.org/content/uploads/sites/3/2019/03/icc-report-trade-and-climate-change.pdf (accessed March 17, 2021).
60
The World Trade Organization and United Nations Environment, “Making trade work for the environment, prosperity and
resilience,” 2018, https://www.wita.org/wp-content/uploads/2018/10/Making-trade-work-for-the-environment-prosperi-
ty-and-resilience-WTO.pdf (accessed March 18, 2021).
Bill Gates, “COVID-19 is awful. Climate change could be worse,” Gates Notes, August 4, 2020, https://www.gatesnotes.
61
com/Energy/Climate-and-COVID-19 (accessed March 18, 2021).
Bill Gates, “Bill Gates: Here’s a Formula That Explains Where We Need to Invest in Climate Innovation,” Time, January 22,
62
2021, https://time.com/5930098/bill-gates-climate-change/ (accessed March 18, 2021).
The Heritage Foundation, “Methodology,” 2021 Index of Economic Freedom, https://www.heritage.org/index/pdf/2021/
63
book/02_2021_IndexOfEconomicFreedom_METHODOLOGY.pdf (accessed March 17, 2021).
64
Todd Myers, “How Personal Technology is Democratizing Environmental Action,” The Property and Environment Research
Center, March 2, 2021, https://www.perc.org/2021/03/02/how-personal-technology-is-democratizing-environmental-ac-
tion/ (accessed March 18, 2021).
Jessica R. Lovering, Arthur Yip, and Ted Nordhaus, “Historical construction costs of global nuclear power reactors,” Energy
65
Policy, Vol. 91, pp. 371-382, April 2016, https://www.sciencedirect.com/science/article/pii/S0301421516300106?via%3Di-
hub#ec0005 (accessed March 24, 2021).
66
U.S. Nuclear Regulatory Commission, “Backgrounder on the Three Mile Island Incident,” June 21, 2018, https://www.nrc.gov/
reading-rm/doc-collections/fact-sheets/3mile-isle.html#effects (accessed March 24, 2021).
67
Diane Katz, “An Examination of Federal Permitting Processes Testimony before the Subcommittee on Interior, Energy, and
Environment Committee on Oversight and Government Reform, U.S. House of Representatives,” The Heritage Foundation
Statement, March 15, 2018, https://republicans-oversight.house.gov/wp-content/uploads/2018/03/Katz-Heritage-State-
ment-Federal-Permitting-3-15.pdf (accessed March 18, 2021).
FREE ECONOMIES ARE CLEAN ECONOMIES | 21You can also read