Free water diffusion tensor imaging improves the accuracy and sensitivity of white matter analysis in Alzheimer's disease - Nature
←
→
Page content transcription
If your browser does not render page correctly, please read the page content below
www.nature.com/scientificreports
OPEN Free‑water diffusion tensor
imaging improves the accuracy
and sensitivity of white matter
analysis in Alzheimer’s disease
Maurizio Bergamino1, Ryan R. Walsh2 & Ashley M. Stokes1*
Magnetic resonance imaging (MRI) based diffusion tensor imaging (DTI) can assess white matter
(WM) integrity through several metrics, such as fractional anisotropy (FA), axial/radial diffusivities
(AxD/RD), and mode of anisotropy (MA). Standard DTI is susceptible to the effects of extracellular
free water (FW), which can be removed using an advanced free-water DTI (FW-DTI) model. The
purpose of this study was to compare standard and FW-DTI metrics in the context of Alzheimer’s
disease (AD). Data were obtained from the Open Access Series of Imaging Studies (OASIS-3)
database and included both healthy controls (HC) and mild-to-moderate AD. With both standard and
FW-DTI, decreased FA was found in AD, mainly in the corpus callosum and fornix, consistent with
neurodegenerative mechanisms. Widespread higher AxD and RD were observed with standard DTI;
however, the FW index, indicative of AD-associated neurodegeneration, was significantly elevated
in these regions in AD, highlighting the potential impact of free water contributions on standard
DTI in neurodegenerative pathologies. Using FW-DTI, improved consistency was observed in FA,
AxD, and RD, and the complementary FW index was higher in the AD group as expected. With both
standard and FW-DTI, higher values of MA coupled with higher values of FA in AD were found in the
anterior thalamic radiation and cortico-spinal tract, most likely arising from a loss of crossing fibers. In
conclusion, FW-DTI better reflects the underlying pathology of AD and improves the accuracy of DTI
metrics related to WM integrity in Alzheimer’s disease.
Alzheimer’s disease (AD) is a neurodegenerative disorder and the most common cause of dementia in older
adults1. Current biomarkers for AD target the dominant pathological paradigm, characterized by beta-amyloid
and tau pathologies, as well as neurodegenerative changes. While much of the pathologic evidence of AD is found
in gray matter, it is well recognized that concomitant white matter (WM) alterations occur in the brains of AD
populations, suggesting an expanded role for WM-based biomarkers in A D 2.
Diffusion-based magnetic resonance imaging (dMRI) enables the in vivo evaluation of brain microstruc-
ture and, more specifically, WM integrity by probing water diffusivity associated with axons3; most commonly,
diffusion-related parameters are obtained by analysis using the diffusion tensor imaging (DTI) model. In WM,
faster diffusivity along the fibers, with lower perpendicular diffusivity, yields a higher fractional anisotropy (FA).
While decreased FA has been associated with demyelination, edema, gliosis, and inflammation, FA is unfortu-
nately an indirect marker of WM integrity because the individual microscopic contributions of various non-WM
components cannot be d isentangled4,5. Other DTI-derived metrics include axial diffusivity (AxD), which may be
related to axonal damage, and radial diffusivity (RD), which is correlated with myelin integrity, axonal diameter
and density, and fiber c oherence6. Prior DTI studies have shown that AD is associated with lower FA and higher
AxD and RD values across multiple regions in the WM, including the corpus callosum (CC), fornix, cingulum,
inferior longitudinal fasciculus (ILF), and superior longitudinal fasciculus (SLF)7–9. Moreover, changes in DTI
metrics may precede both neuronal loss and symptoms onset, suggesting their potential role as early biomarkers.
While several studies have shown a correlation between DTI-derived metrics and cognitive scores10–12, other
similar investigations have failed to show a significant correlation13–16 suggesting methodologic and/or analytic
impacts on dMRI-derived data.
1
Division of Neuroimaging Research, Barrow Neurological Institute, Phoenix, AZ 85013, USA. 2Muhammad
Ali Parkinson Center, Barrow Neurological Institute, Phoenix, AZ 85013, USA. *email: ashley.stokes@
barrowneuro.org
Scientific Reports | (2021) 11:6990 | https://doi.org/10.1038/s41598-021-86505-7 1
Vol.:(0123456789)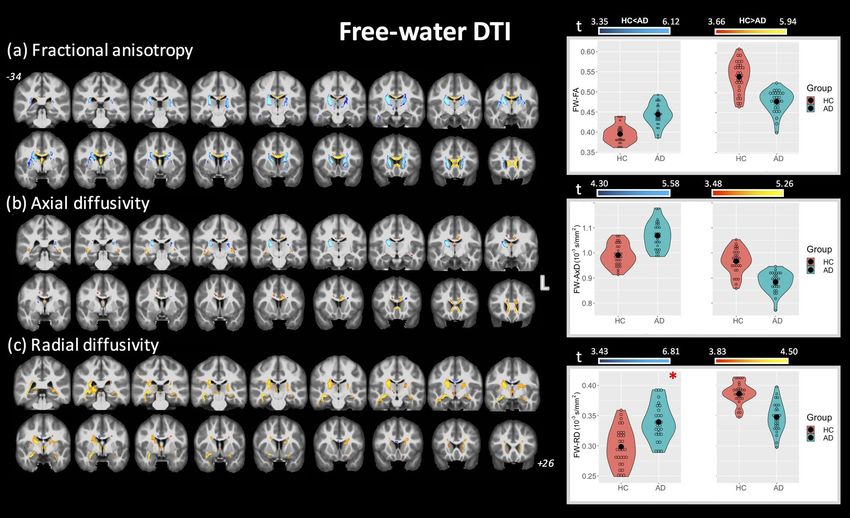
www.nature.com/scientificreports/
N subjects N females Age MMSE CDR
HC 30 17 73 (6) 29.10 (1.24) 0 (0)
AD 28 15 75 (7) 24.18 (5.02) 0.82 (0.55)
t-test t = − 1.51; p = 0.137 t = − 5.21; p < 0.0001* t = − 8.22; p < 0.0001*
CDR HC AD
CDR 0 (none) 30 0
CDR 0.5 (very mild) 0 16
CDR 1 (mild) 0 10
CDR 2 (moderate) 0 1
CDR 3 (severe) 0 1
Table 1. Group demographics with MMSE and CDR scores. *Student t-test demonstrated differences in
MMSE and CDR between AD and HC cohorts.
Although dMRI is a well-recognized method for assessing WM, it has several limitations, including known
inaccuracies related to partial volume effects (PVEs), wherein the resulting DTI metrics reflect a weighted aver-
age of multiple diffusion components within a voxel and are thus no longer specific to a single tissue t ype17. The
impact of PVEs may be particularly profound in AD, where neuronal loss leads to secondary ex vacuo increases
in cerebrospinal fluid (CSF) and free water (FW) across the brain. To overcome the effects of extracellular FW
on DTI-derived metrics, a FW correction algorithm has been developed to quantify and remove the contribu-
tion of extracellular F W18. FW-DTI has been shown to improve both tissue s pecificity19 and DTI-based tract
reconstruction18. This model has previously been used to study several neurological diseases, including A D20–24,
Parkinson’s disease25, and depression26,27.
Using FW-DTI in a healthy aging population enriched for AD risk, Hoy et al. found that DTI-based markers
of altered microstructure were significantly associated with CSF biomarkers of preclinical AD pathology20. FW
correction may be particularly important in the fornix, due to both its proximity to the lateral ventricles and its
association with the hippocampus22, and may also improve sensitivity to conversion to mild cognitive impair-
ment (MCI) relative to uncorrected DTI metrics23. The FW index has separately been proposed as a standalone
biomarker of AD-related pathology. This index has been associated with cognitive decline in multiple domains
and may enable separation of vascular and neurodegenerative contributions to cognitive decline in the presence
of mixed d ementia21. More recently, an elevated FW index was observed in MCI and AD patients compared with
healthy controls (HC), even after correction for white matter hyperintensities28. However, none of these studies
have directly compared standard and FW-DTI metrics in the context of distinguishing between AD and HC. As
AD-related WM degeneration leads to a significant intravoxel FW component, FW-DTI may improve sensitivity
to early brain changes and provide a clearer and more specific interpretation of results compared to standard DTI.
In this study, we compared FA, AxD, RD, and MA from both standard DTI and FW-DTI between AD and
HC subjects obtained from the Open Access Series of Imaging Studies (OASIS-3) brain p roject29. This dataset
was previously used to investigate AD-related changes in the size and shape of the C C30,31. We also investigated
the complementary FW index for both groups and analyzed voxel-based correlations between all DTI-derived
metrics (from DTI and FW-DTI) and the mini-mental state examination (MMSE) s core32. We hypothesize that
FW-DTI will improve the sensitivity and specificity for detection of WM tract abnormalities in AD. More spe-
cifically, increased FW due to neurodegeneration reduces the accuracy of diffusion-derived metrics, and thus,
the removal of FW contributions improves the estimation of DTI metrics and may increase confidence in the
patterns observed across DTI studies. In addition, the ability to quantify FW may yield complementary insight
into sub-voxel WM neurodegenerative processes. The application of FW-DTI for AD better reflects the underly-
ing pathology and should thus further improve interpretation of AD WM pathology.
Materials and methods
Subjects. All data were downloaded from the OASIS-3 brain project (http://oasis-brains.org/), which is a
neuroimaging dataset for normal aging and Alzheimer’s disease and is freely available to the scientific com-
munity. Inclusion criteria were participants between the ages of 60 and 90 years who had 3 T dMRI data avail-
able with more than 30 directions. Exclusion criteria were cognitively impaired participants with dementia not
attributed to AD, healthy control participants with significant comorbidities, and participants for whom the
MMSE was not available. Only one time-point was used per subject. Subsequently, this study included 30 HCs
(17 females; age (standard deviation, S.D.) = 73 (6) years) and 28 AD subjects (primarily mild AD; 15 females;
age = 75 (7) years). Four AD subjects had remote mood disorders and one had a remote hypothyroidism as sec-
ondary medical diagnoses. The Clinical Dementia Rating (CDR)33, which is a 5-point scale used to characterize
multiple domains of cognitive and functional abilities, was zero for all HCs and between 0.5 and 3.0 for the AD
group. The MMSE is a 30-point assessment commonly used to measure cognitive impairment. The mean value
of MMSE was 29.10 (S.D. 1.24) for HC and 24.18 (S.D. 5.02) for AD. All subject characteristics are summarized
in Table 1.
MRI protocol for DTI. All dMRI data collected from the OASIS-3 database were acquired using a 3 T scan-
ner (Siemens). For all subjects, the acquisition was performed using 64 diffusion-encoding directions (b value:
Scientific Reports | (2021) 11:6990 | https://doi.org/10.1038/s41598-021-86505-7 2
Vol:.(1234567890)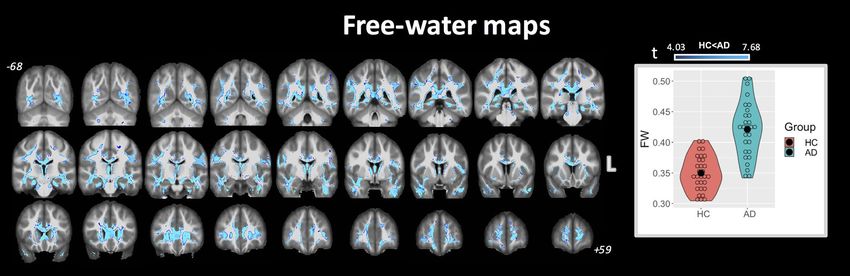
www.nature.com/scientificreports/
1000 s/mm2; TR/TE: 11,000/87.0 ms; flip-angle = 90°; matrix: 96 × 96; field of view (FOV): 24.0 × 24.0 cm; slice
thickness: 2.5 mm; 64 axial slices) and one non-diffusion-weighted image (B0 image).
Data preprocessing. DMRI data were downloaded in NIFTI format and processed as previously
described26,27. Briefly, the data were preprocessed using the functional magnetic resonance imaging of the brain
(FMRIB) software library tool (FSL, version 5.0.4)34. Following translation and rotation estimation, the raw
dMRI images were corrected for eddy currents and m otion35. After motion correction, the gradient orientations
were compensated (prior to calculating B-matrices) to account for the rotational component of registration. A
brain mask was defined for each subject using the Brain Extraction Toolbox (BET)36 for the single B0 images. DTI
standard (uncorrected for FW) and FW-corrected maps were calculated using an in-house MATLAB s cript26,
which is available upon request. The FW maps were computed by fitting the following model at each v oxel18:
Ag D, f = f · (exp −bg T Dg ) + (1 − f ) · exp[−bDwater ] (1)
where Ag is the modeled attenuated signal (normalized by B0) for the applied diffusion gradient g, and b is the
b-value (1000 s/mm2). The first term reflects the tissue compartment, where D is the diffusion tensor of this com-
partment, f is the fractional volume of the compartment, and gT is the transpose of the vector g. The second term
reflects an isotropic free-water compartment with a fractional volume of (1 − f), where the diffusion coefficient
Dwater is set to the diffusivity of water at body temperature (3 × 10⁻³ mm2/s). AxD, RD, and FA were obtained
from D. Standard DTI metrics are reported as AxD, RD, and FA, while FW-corrected DTI metrics are reported
as AxDt, RDt, and FAt, where the t is indicative of greater tissue specificity from FW-DTI.
While FA indicates deviation from a spherical-shaped tensor (FA = 0; isotropic diffusion), the mode of ani-
sotropy (MA) is a complementary measure that discriminates between linear and planar anisotropy. MA is
mathematically orthogonal to FA and relates to the skewness of the DTI eigenvalues ( 1 , 2 , 3 )37:
(− 1 − 2 + 2 3 )(2 1 − 2 − 3 )(− 1 + 2 2 − 3 )
MA = 3/2 (2)
2( 21 + 22 + 23 − 1 2 − 1 3 − 2 3 )
After quantifying all DTI-derived metrics, the B0 images from each subject were used to create a B0 group-
wise template image using buildtemplateparallel.sh included in ANTs; this procedure has been demonstrated to
improve the final normalization procedure38. The B0 group-wise template image was subsequently normalized to
the IIT_mean_b0 image by ANTs symmetric image normalization (SyN) a lgorithm39. The warp fields obtained
from this normalization and from the B0 group-wise template creation were used to transfer all DTI maps (stand-
ard and FW-corrected) to the Illinois Institute of Technology (IIT) Human Brain Atlas (v.4.1), which contains
both anatomical and DTI brain templates in International Consortium for Brain Mapping (ICBM)-152 space40.
All DTI maps in standard space were smoothed using FSL with an isotropic Gaussian kernel (sigma, 3 mm).
Statistical analysis. Age, MMSE, and CDR scores are presented as mean and standard deviation (SD) for
each group. Differences in age, sex, and cognitive test scores between groups were assessed using the Student’s
t-test. Comparisons of all DTI-, FW-DTI- metrics, and FW maps between groups were performed using the FSL
Randomise tool41 with threshold‐free cluster enhancement (TFCE)42 and a correction for multiple comparisons
via Family‐Wise Error (FWE) r ate38 at a 0.01 level. A WM mask was defined using a threshold of 0.2 on the aver-
age values of FA (from standard DTI) and was applied to the other DTI maps. For each voxel, the DTI-derived
metrics were fitted by an Analysis of Covariance model (ANCOVA), which included age and sex as covariates.
The number of randomized permutations was set at 5,000. The clusters identified to be statistically different
between groups were labeled according to the JHU DTI-based white-matter atlases43,44. All results are reported
with a significance threshold of p value < 0.01, corrected for FWE, except where otherwise noted.
For the cognitively impaired group (AD only), the voxel-based relationship between MMSE scores and DTI
metrics was assessed through Randomise with significance at p-value < 0.01 (FWE-corrected).
Results
Student’s t-test did not show any difference in age (t = − 1.51; p = 0.137) or sex (t = 0.233; p = 0.817) between HC
and AD. Significant differences were found for MMSE (t = − 5.21; p < 0.0001) and for CDR (t = − 8.22; p < 0.0001),
as shown in Table 1.
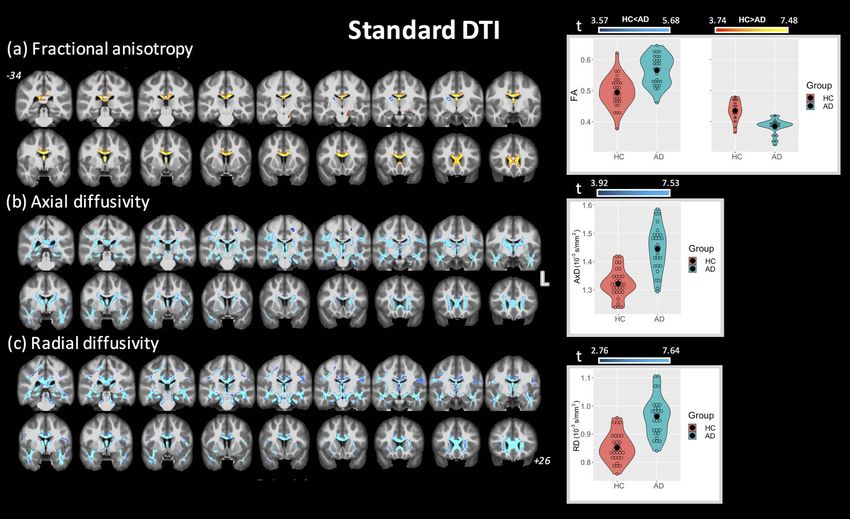
Standard DTI. Figure 1 shows the clusters of significant differences between the two groups obtained with
standard DTI metrics with the corresponding violin plots quantifying the DTI differences for each group (across
all combined clusters). For FA (panel (a)), lower FA was observed in AD compared with HC mainly in the fornix
(cluster covering 93.3% of the fornix) and CC (covering 35.5% of CC). Small clusters where AD had higher FA
values than HC were found in the right anterior thalamic radiation (ATR), cortical spinal tract (CST), posterior
limb of internal capsule (PLIC), and superior corona radiata (SCR). More widespread differences between HC
and AD were observed using AxD and RD (panel (b) and (c), respectively). Additionally, all significant clusters
corresponded to higher values of AxD and RD metrics in the AD group, with no clusters corresponding to lower
AxD or RD.
For each brain region, the significant cluster sizes (as percent volume) are reported in Table 2. Several clus-
ters were observed where multiple DTI metrics were simultaneously altered between HC and AD groups, as
shown in Supplementary Table 1. Regions where lower FA values overlapped with higher AxD and RD included
the fornix, CC, forceps minor, and left cingulum. Higher FA values were found to overlap with higher AxD in
Scientific Reports | (2021) 11:6990 | https://doi.org/10.1038/s41598-021-86505-7 3
Vol.:(0123456789)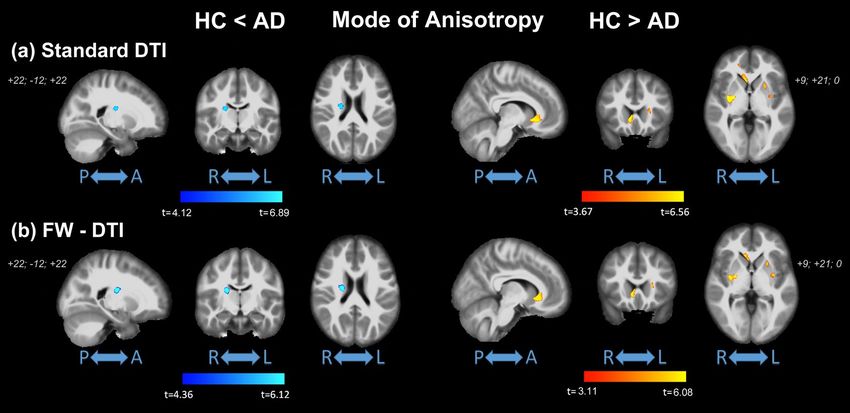
www.nature.com/scientificreports/
Figure 1. Coronal view of ANCOVA analysis between HC and AD subjects for standard DTI metrics. Clusters
are reported at a significance threshold of p-value < 0.01 corrected for FWE. (a) FA, (b) AxD, and (c) RD
analysis. The color bars indicate values that are lower in AD than HC (red-to-yellow) and higher in AD than HC
(blue-to-cyan). For axial and radial diffusivities, only clusters with higher values in AD than HC were found.
The corresponding violin plots represent the DTI metrics inside the significant clusters for each group.
the right PLIC, CST, and SCR. Substantial overlap was observed for clusters with higher AxD and higher RD,
including 85% of the cingulum (hippocampus), 76% of the fornix, and 49% of the sagittal stratum. Finally, Sup-
plementary Table 2 shows the corresponding mean DTI values inside each significant cluster for regions with
higher and lower values for each group.
FW‑DTI. Figure 2 shows the clusters of significant differences between groups for FW-DTI metrics with
the corresponding violin plots quantifying the DTI differences for each group (across all combined clusters),
where FAt, AxDt, and R Dt are displayed in panels (a), (b), and (c) (at p < 0.01 FWE corrected, unless otherwise
indicated). The clusters where AD had lower F At values than HC correspond to the same WM locations as those
observed using standard FA (specifically, fornix and CC); however, these clusters (covering 71% and 19.2% of
fornix and CC, respectively) are smaller than standard FA (93.3% and 35.5%, respectively). Higher FAt values in
AD compared with HC were found bilaterally for ATR, CST, limb of internal capsule (LIC), SCR, and superior
fronto-occipital fasciculus (SFOF). With regard to AxDt and RDt, both higher and lower values were observed in
multiple regions in the AD group (recall that only higher AxD and RD were observed using standard DTI). More
specifically, AxDt was lower in the AD group in CC and fornix and predominantly higher in the ATR, CST, and
retrolenticular part of internal capsule. Lower RDt was observed with AD mainly in the ATR, CST, PLIC, and
SFOF, corresponding to similar areas with higher F At. A small cluster inside the body of the CC showed higher
RDt in the AD group, albeit at p < 0.05 FWE corrected.
For each brain region, the significant cluster sizes (as percent volume) are reported in Table 2. As for standard
DTI, several clusters were observed where multiple DTI metrics were simultaneously altered between HC and
AD groups, as shown in Supplementary Table 1. No regions were observed where lower F At values overlapped
with higher A xDt and R Dt; however, lower F At values overlapped with lower A xDt and R Dt values in the fornix
(4.8%), while lower F At corresponded with lower A xDt in several regions including the CC and forceps minor.
Higher FAt values were found to overlap with higher A xDt and lower R Dt in the SFOF, right PLIC, SCR, and
anterior LIC. Several clusters were observed with higher A xDt and lower R Dt, including the left CST, right PLIC,
and right SCR. Unlike standard DTI, no clusters demonstrated simultaneously higher AxDt and higher RDt.
Finally, Supplementary Table 3 shows the corresponding mean FW-DTI values inside each significant cluster
for regions with higher and lower values for each group.
FW‑index. Figure 3 shows the significant differences between groups using the FW index (obtained from
the fit in Eq. 1) at p < 0.01 FWE corrected. The corresponding violin plots are also shown for FW values for each
group (across all combined clusters). Only clusters with higher FW values in AD compared with HC were found,
Scientific Reports | (2021) 11:6990 | https://doi.org/10.1038/s41598-021-86505-7 4
Vol:.(1234567890)www.nature.com/scientificreports/
Standard DTI Free-water DTI
AD RD AD AD RD
FA (HC) > FA FA (HC) < FA (HC) < AD (HC) < RD FA (HC) > FA FA (HC) < FA (HC) > AD (HC) < AD (HC) > RD RD (HC) < RD
(AD) (AD) (AD) (AD) (AD) (AD) (AD) (AD) (AD) (AD)*
% % % % % % % % % %
JHU WM tract. atlas
Left ATR – – 34.13 31.06 – 7.91 0.42 1.95 6.12 –
Right ATR – 1.14 31.99 28.51 – 9.96 0.53 1.64 6.79 –
Left CST – – 12.67 10.72 – 3.96 – 2.92 5.11 –
Right CST – 1.59 14.34 16.38 – 8.47 – 6.06 8.97 –
Left CGC 6.41 – 9.77 38.37 1.90 – 4.34 – – –
Right CGC – – 24.44 41.83 – – 1.62 – – –
CGH – – 60.13 61.44 – – – – 3.8 (only R) –
Forceps major – – 7.68 39.35 – – – – – –
Forceps minor 7.76 – 18.98 33.10 4.78 – 5.60 – – –
IFOF left ATR – – 19.25 43.47 – – 2.19 – 1.67 –
ILF – – 23.83 43.79 – – 1.48 – 3.86 –
SLF – – 14.15 19.48 – – – – – –
UF – – 30.18 48.35 – – 0.61 – – –
ICBM-DTI-81 WM atlas
Genu of CC 44.91 – 39.39 88.39 30.35 – 34.10 – – –
Body of CC 57.12 – 11.17 70.68 31.19 – 13.59 – – 1.21
Splenium of
9.73 – 33.36 58.75 1.45 – – – – –
CC
Fornix 93.33 – 73.93 93.74 70.91 – 45.99 – – –
Left SCP – – – 10.60 – – – – – –
CP – – 25.01 59.53 – – – – – –
Anterior LIC – – 30.96 – – 29.10 – 2.63 12.43 –
Right posterior
– 5.83 39.59 – – 39.77 – 30.58 38.67 –
LIC
Left posterior
– – 23.00 – – 26.97 – 4.17 32.23 –
LIC
Retrolenticular
– – 23.24 27.28 – 10.26 16.94 7.12 12.96 –
part of IC
Right anterior
– – 18.73 29.55 – – 1.47 – – –
CR
Left anterior
8.88 – 26.05 42.95 – – 2.96 1.26 – –
CR
Right superior
– 1.22 28.58 – – 17.71 – 6.93 18.13 –
CR
Left superior
– – 20.72 – – 9.08 – – – –
CR
Right posterior
5.30 – 29.71 16.34 – 7.08 – 3.69 11.16 –
CR
Left Posterior
– – 14.94 – – – – 2.98 – –
CR
Sagittal
– – 50.70 82.00 – – 8.15 – 16.92 (only R) –
stratum
External
– – 22.84 33.57 – 8.23 – – – –
capsule
Right CGC – – 30.58 62.75 – – – – – –
Left CGC 8.11 – 13.79 61.95 – – 2.74 – – –
Cingulum
(hippocam- – – 85.22 86.79 – – – – – –
pus)
SFOF – – 87.14 – – 61.03 – 10.94 40.13 –
Table 2. Brain locations where clusters of significant differences between groups were found for both standard
and FW-DTI analyses. All results are shown for p < 0.01 (FWE corrected), except for the last column, indicated
by *, where RD (HC) < RD (AD) is reported at p < 0.05 (FWE corrected). % columns indicate the percent
volume of the cluster inside the corresponding brain area. For JHU white-matter tractography atlas: ATR
anterior thalamic radiation, CST cortical spinal tract, CGCcingulum (cingulate gyrus part), CGH cingulum
(hippocampal part), IFOF inferior fronto-occipital fasciculus, ILF inferior longitudinal fasciculus, UF uncinate
fasciculus. For ICBM-DTI-81 white-matter atlas: CC corpus callosum, LIC limb of internal capsule, IC internal
capsule, CR corona radiate, SS sagittal stratum, SFOF superior fronto-occipital fasciculus.
Scientific Reports | (2021) 11:6990 | https://doi.org/10.1038/s41598-021-86505-7 5
Vol.:(0123456789)www.nature.com/scientificreports/
Figure 2. Coronal view of ANCOVA analysis between HC and AD subjects for the FW-DTI metrics. Clusters
are reported at a significance threshold of p-value < 0.01 corrected for FWE, except for R Dt (HC) FW (AD). The
corresponding violin plots represent the FW metrics inside the significant clusters for each group.
with clusters covering 34% of the total WM mask. These differences were observed in several WM regions,
including most prominently the fornix, cingulum (both hippocampal and cingulate gyrus parts), and CC. The
complete list of group-wise significant clusters for the FW index between HC and AD is reported in Table 3.
MA‑index. The results for MA are reported in Fig. 4. Significantly higher values of MA (from both standard
DTI and FW-DTI) in AD compared with HC were observed in the right CST, right PLIC, right SCR, and right
SFOF, corresponding to more linear anisotropy. On the other hand, lower MA values (from standard DTI and
FW-DTI) in AD compared with HC were found mainly in the genu of CC and in the external capsule (EC), cor-
responding to more planar anisotropy. It should be noted that similar results for MA were obtained with both
standard DTI and FW-DTI analysis. The complete list of group-wise significant clusters is reported in Table 4.
Scientific Reports | (2021) 11:6990 | https://doi.org/10.1038/s41598-021-86505-7 6
Vol:.(1234567890)www.nature.com/scientificreports/
% FW (HC) FW (AD)
JHU WM tract. atlas
ATR 31.39 0.36 (0.03) 0.42 (0.04)
CST 12.98 0.30 (0.02) 0.35 (0.02)
CGC 56.34 0.28 (0.03) 0.33 (0.04)
CGH 85.16 0.33 (0.03) 0.41 (0.06)
Forceps major 40.10 0.33 (0.03) 0.38 (0.05)
Forceps minor 39.19 0.34 (0.04) 0.40 (0.04)
IFOF 39.92 0.28 (0.03) 0.32 (0.04)
ILF 52.05 0.27 (0.03) 0.32 (0.05)
SLF 30.08 0.28 (0.03) 0.33 (0.04)
UF 47.81 0.28 (0.03) 0.34 (0.04)
ICBM-DTI-81 WM atlas
Genu of CC 67.27 0.39 (0.03) 0.45 (0.04)
Body of CC 47.89 0.37 (0.04) 0.43 (0.03)
Splenium of CC 52.17 0.30 (0.04) 0.36 (0.04)
Fornix 95.62 0.72 (0.06) 0.81 (0.05)
CP 41.40 0.33 (0.03) 0.38 (0.03)
Left anterior LIC 10.09 0.25 (0.03) 0.30 (0.04)
Right retrolenticular part of IC 21.22 0.28 (0.03) 0.32 (0.03)
Anterior CR 29.23 0.25 (0.04) 0.30 (0.04)
Right posterior CR 19.87 0.26 (0.03) 0.31 (0.04)
SS 65.31 0.29 (0.02) 0.34 (0.04)
EC 30.24 0.26 (0.03) 0.31 (0.04)
CGH 90.64 0.34 (0.03) 0.41 (0.06)
Table 3. Brain locations where clusters of significant differences between groups were found for FW
maps analysis at p < 0.01 (FWE corrected). % columns indicate the percent volume of the cluster inside the
corresponding brain area. Only clusters with higher FW values in AD than HC were observed. For JHU white-
matter tractography atlas: ATRanterior thalamic radiation, CST cortical spinal tract, CGCcingulum (cingulate
gyrus part), CGH cingulum (hippocampal part), IFOF inferior fronto-occipital fasciculus, ILF inferior
longitudinal fasciculus, SLF superior longitudinal fasciculus, UF uncinate fasciculus. For ICBM-DTI-81 white-
matter atlas: CC corpus callosum, CP cerebral peduncle, LIC limb of internal capsule, IC internal capsule, CR
corona radiata, SS sagittal stratum, EC external capsule.
Figure 4. Coronal view of ANCOVA analysis between HC and AD subjects for MA index from (a) standard
DTI and (b) FW-DTI. Left: MA in HC < MA in AD; right: MA in HC > MA in AD. Clusters are reported at a
significance threshold of p-value < 0.01 corrected for FWE.
Scientific Reports | (2021) 11:6990 | https://doi.org/10.1038/s41598-021-86505-7 7
Vol.:(0123456789)www.nature.com/scientificreports/
Standard MA FW-MA
HC < AD HC > AD HC < AD HC > AD
% % % %
JHU WM tract. atlas
Left ATR – 0.87 – 0.50
Right CST 0.52 – 0.76 –
Forceps major – 0.42 – –
Forceps minor – 1.73 – 0.87
IFOF – 1.12 – 0.60
Left UF – 0.51 – –
Right UF – 3.31 – 1.97
ICBM-DTI-81 WM atlas
Genu of CC – 10.07 – 6.76
Left anterior LIC – 4.24 – 2.61
Right posterior LIC 1.61 – 2.81 –
Right anterior CR – 1.29 – –
Left anterior CR – 1.70 – 0.68
Right superior CR 2.34 – 2.87 –
EC – 10.40 – 6.26
Table 4. Brain locations where clusters of significant differences between groups were found for MA
index analysis at p < 0.01 (FWE corrected). % columns indicate the percent volume of the cluster inside the
corresponding brain area. For JHU white-matter tractography atlas: ATRanterior thalamic radiation, CST
cortical spinal tract, IFOF inferior fronto-occipital fasciculus, ILF inferior longitudinal fasciculus, UF uncinate
fasciculus. For ICBM-DTI-81 white-matter atlas: CC corpus callosum, LIC limb of internal capsule, CR corona
radiata, EC external capsule, SFOF superior fronto-occipital fasciculus.
Voxel‑based correlations between DTI/FW‑DTI metrics and MMSE. No significant voxel-based
correlation was found between MMSE and either standard or FW-DTI metrics at p < 0.05 FWE corrected level.
Correlations between standard and FW‑DTI metrics. Supplementary Fig. 1 shows the population
scatter-plots for standard and FW-DTI metrics, while the group-wise correlations for HC and AD are provided
in each plot. Panels (a) and (b) show the correlations between FA and AxD, while panels (c) and (d) show the
correlations between FA and RD. It should be noted that the correlations increased after FW correction (e.g., for
the AD group: the correlations between FA and AxD increased from 0.160 (standard) to 0.856 (FW-corrected)
and from − 0.464 (standard) to − 0.803 (FW-corrected) between FA and RD). Similar increases were observed
for both HC and AD groups, suggesting that older HC participants also have substantial FW contributions to
their dMRI-derived metrics.
Panels (e)–(g) show the correlations between FA and FW-FAt, AxD and FW-AxDt, RD and FW-RDt, respec-
tively. By removing the isotropic diffusion contribution, the impact of FW-correction is to increase FAt, decrease
AxDt, and decrease RDt, relative to the corresponding standard DTI metrics. These panels also show that FA is
less affected by the FW component than AxD and RD (i.e., the correlation for standard vs. FW FA is higher than
that for AxD and RD). As AxD and RD metrics are more influenced by free-water components (i.e., have lower
correlations between standard and FW metrics), this is consistent with the widespread AxD and RD changes
without FW-correction. Here again, there is not a strong group difference in the correlations. Additionally, the
striking differences for AxD and RD metrics between standard and FW-correction can be attributed to their
biophysical origin; that is, raw diffusivity parameters AxD and RD are likely to be more impacted by intravoxel
free-water diffusion than the composite metric FA.
Discussion
In this study, WM integrity was assessed in patients with Alzheimer’s disease using both standard and FW-
corrected DTI metrics. Although DTI is a commonly used method for assessing WM, PVEs can reduce the
accuracy of DTI metrics, ultimately limiting their interpretation. To mitigate PVE, free water‐contaminated
voxels were removed by incorporating a FW component in the conventional diffusion modeling p ipeline18, pro-
ducing more accurate FW-corrected DTI metrics and the complementary FW index. Using both standard and
FW-DTI, significant WM differences were observed between HC and AD subjects in several regions, including
both higher and lower FA. Both AxD and RD were highly impacted by the effects of FW, and FW-corrected
AxDt and RDt were more consistent with pathology-based expected spatial patterns of neurodegeneration. The
FW index was higher in AD than HC across many regions, as expected. The FW correction method has shown
promise in many neurological diseases of the WM21,24–27, particularly those with neurodegenerative aspects;
similarly, we now demonstrate that the application of FW correction in AD improves the accuracy and sensitiv-
ity of the resulting DTI metrics.
Scientific Reports | (2021) 11:6990 | https://doi.org/10.1038/s41598-021-86505-7 8
Vol:.(1234567890)www.nature.com/scientificreports/
Lower FA values, indicative of more isotropic motion, are consistent with neurodegenerative changes and were
observed in AD in multiple regions, including most prominently the fornix and CC. Of particular interest, the
fornix is the major output tract of the hippocampus and plays a major role in episodic memory2,45. In the con-
text of AD, pathological changes in the fornix may occur at an early disease stage before clinical manifestations.
Lower FA and higher MD in the fornix has been a robust and consistent finding in AD46,47 and may correlate
with cognitive d ecline46,48. Similarly, FA reductions in the fornix have been identified using skeletonized tract-
based spatial statistics (TBSS) in early-symptomatic individuals and those at high risk for developing A D49–52.
However, the fornix is particularly prone to PVEs due to its proximity to the lateral v entricles2, which may be
further exacerbated by atrophy-related ventricular expansion in AD. While decreases in standard FA may reflect
a complex combination of atrophy and microstructural changes, these decreases remained after correction for
FW, indicating that they reflect true pathological changes in the fornix.
Other significant changes were observed in AD in the CC, which is a major fiber bundle responsible for
interhemispheric connection. Using both standard and FW-DTI, large clusters of lower FA were observed in the
genu and body with minimal splenial changes, particularly using FW-DTI. Several other studies have similarly
reported decreased FA in the CC; however, these studies have shown inconsistent regional changes with AD, with
some studies finding changes throughout the CC53 and others reporting predominant changes in the genu9 or
splenium54. Early involvement of the genu would support the anterior-to-posterior progression of the retrogenesis
hypothesis, wherein degeneration occurs in reverse of myelination. In contrast, early changes in the splenium
would be consistent the posterior-to-anterior progression of Wallerian degeneration following neuronal loss,
wherein WM damage is subsequent to grey matter damage. To date, conclusive evidence of a gradient pattern has
remained elusive55,56. Given the substantial FW component observed in the CC, the inclusion of FW correction
algorithms could improve accuracy in the resulting DTI metrics in the presence of neurodegenerative changes,
and future studies should consider whether the implementation of FW correction could increase confidence in
the spatiotemporal patterns observed across DTI studies.
Higher FAt in AD compared with HC was observed seemingly paradoxically using FW-DTI in bilateral ATR
and CST, as well as internal capsule and corona radiata; with standard DTI, much smaller clusters of higher FA
were observed in the right hemisphere (versus bilateral for FW-DTI) in the ATR, CST, PLIC and SCR (see Table 2
and Supplementary Tables 2 and 3). In the presence of a unidirectional fiber tract, higher FA would suggest lower
RD and/or higher AxD, which are in contrast to the expected changes in the presence of neurodegeneration.
However, one of the major drawbacks of standard DTI methods is an inability to resolve different fiber orienta-
tions within a voxel57, which arises from the assumption of Gaussian diffusion implicit in the tensor model58.
In the presence of crossing fibers, FA is artificially diminished due to multi-directional fiber tracts; thus, AD-
related neurodegeneration in these regions may yield increased FA due to the loss of crossing fibers. In these
cases, MA—a metric of diffusion anisotropy—may provide insight in areas of crossing fibers; moreover, higher
MA has been related to a loss of crossing fibers in early AD pathology in regions with known complicated tract
topologies59. Further corroborating the presence of fiber crossing, MA was higher in AD subjects in the right
CST, PLIC, and SCR. Conversely, lower MA in AD was found in clusters in the left ATR, forceps major and minor,
IFOF, UF, genu of CC, anterior CR, and EC. Similar to these results, other studies have found parallel increases
of both FA and MA in AD patients in a large cluster extending along the CST and involving the ATR54,60. The
higher MA in AD subjects, together with higher FA, suggests a more linear shape of the diffusion tensor, indica-
tive of the loss of crossing fiber populations in these areas. As the CST is relatively preserved in AD pathology,
these changes suggest degeneration of fiber tracts in the ATR, CC, and fasciculus.
Using standard DTI, non-specific higher AxD and RD were observed across WM, while FW-AxDt and FW-
RDt had better agreement with regional F At changes. This may be reflective of a larger impact of isotropic FW
diffusion on AxD and RD metrics compared to FA. For example, lower FA in the CC and fornix is indicative
of altered WM integrity (e.g., demyelination) in the AD group; these changes were driven by both higher AxD
and RD with standard DTI, while FW correction showed that these changes in FAt may be driven by underlying
lower AxDt. Using FW-DTI, lower FW-AxDt (AD < HC) were found in WM locations corresponding to lower
FAt, while the fornix showed simultaneous lower FW-RDt (HC > AD) in a small cluster. With standard DTI, AxD
was higher across multiple regions, consistent with prior literature14,49,54,61,62. However, the mechanism of higher
AxD is unknown and contrary to prevailing theories of known AD p athology61. Using FW-DTI, regions of lower
AxDt corresponded to lower FAt values, suggesting that prior reports of higher AxD may have been sensitive to
the effects of FW. A similar trend of AxD decreasing with FW correction was previously reported using TBSS in
the context of AD and cerebrovascular disease21. After FW correction, higher AxDt in AD, compared with HCs,
was observed in regions with known crossing fibers, consistent with degeneration of select fiber tracts in these
regions. Additionally, clusters with higher FW-FAt values in AD (e.g., ATR, CST, anterior/posterior LIC, and
SFOF) were associated with higher FW-AxDt and lower FW-RDt. Using standard DTI analysis, no lower AxD
or RD values were detected in AD subjects.
The FW volume fraction was quantified using the FW-correction algorithm and, consistent with AD-related
neurodegeneration, was higher in AD in many WM areas and tracts. More specifically, large clusters of higher
FW were located in the cingulum (hippocampal and cingulate gyrus parts, 85.16% and 56.34%, respectively), ILF
and IFOF (52% and 40%, respectively), forceps major and minor (approximately 40% each), and ATR (31.39%).
Similar clusters were also found in the fornix (95.6%) and CC (genu, body, and splenium; approximately 56%
of the total CC). Additionally, approximately 42% of the FW clusters were located in WM outside the regions
specified by the atlases; in particular, FW increases were found in several regions bordering various sulcal fundi.
Consistent with DTI-based metrics, the FW index further demonstrates an important connection between the
fornix, CC, and AD. The high volume of FW in these regions may be related to loss of WM integrity; moreover,
the contaminating effects of FW further validates the significant differences observed between standard and FW-
DTI metrics. This metric may itself be a valuable biomarker, consistent with our hypothesis, as previous studies
Scientific Reports | (2021) 11:6990 | https://doi.org/10.1038/s41598-021-86505-7 9
Vol.:(0123456789)www.nature.com/scientificreports/
have shown that higher FW values were associated with poorer executive functioning, visual construction, and
visuomotor performance21. Overall, FW-DTI provides not only more accurate and consistent DTI-based bio-
markers, but also provides quantitative FW volume fractions, which may be a potential biomarker of sub-voxel
neurodegenerative processes.
Correlations between DTI metrics and various neuropsychology assessments could lend insight into the
role of WM changes on cognitive function in AD pathology. In this study, we did not observe any significant
voxel-wise correlations between MMSE and DTI metrics before or after FW correction in the AD cohort. This
may be attributable to the similar group characteristics (predominantly very mild to mild AD) and the relatively
narrow range of MMSE scores, while future studies could consider including more sensitive measures of cogni-
tive functioning, including various sub-domains such as memory and executive function. Despite the lack of
correlation in this study, the overall finding that FW-DTI metrics are more consistent with the pathology may
lend insight into the inconsistent correlative findings across the literature. While the relationship between WM
integrity as assessed by DTI and cognitive functions remains unsettled, the implementation of FW correction to
yield more accurate DTI metrics should be considered as a methodological improvement for future correlation
studies, particularly for the diffusivity metrics AxD and RD.
There are several limitations to this study. First, we used a voxel-based approach for WM analysis rather
than a skeletonized approach, such as TBSS. As TBSS minimizes tract variance across subjects using a common
skeletonized tract, it uses fewer voxels and is inherently less sensitive to partial volume effects. However, the
higher number of voxels available with voxel-based approaches may increase sensitivity to subtle differences in
microstructure63. Even so, all of these approaches necessitate the use of atlases, which may be limited in the WM
regions that are represented (in this case, the atlases covered 84% of the WM mask); this is particularly relevant
for the FW index that showed widespread changes across WM, even outside of the atlas regions. In the present
study, atrophy likely minimal due to the selected patient population, further enabling the use of a voxel-based
approach. Second, no significant voxel-based correlations (p < 0.01 FWE corrected) were observed between
standard DTI and FW-DTI metrics and the MMSE score, which is consistent with several previous s tudies13–16.
This suggests that while WM is altered in AD, the relationship between global cognitive scores and WM pathol-
ogy may not be linear. Future work could consider more sensitive measures of cognitive subdomains, and the
inclusion of a longitudinal aspect may further pinpoint the temporal ordering of WM alterations relative to GM
pathology and cognitive decline. Finally, as early biomarkers are of increasing interest, future studies should also
include cohorts of MCI or subjects at high risk of developing AD.
Conclusion
In conclusion, this study demonstrates that the implementation of a FW correction algorithm for DTI improves
both the sensitivity and specificity of derived DTI metrics by removing PVEs, and better captures underlying
AD-related pathologic changes than standard DTI approaches. We found significantly altered DTI metrics in AD
compared to HC for both standard and FW-DTI, but importantly FW-DTI identified changes were more con-
sistent with known AD pathology as hypothesized (both in terms of magnitude and direction of DTI changes).
In addition, MA may improve specificity related to crossing fibers, while the FW index may improve sensitivity
to sub-voxel neurodegeneration. Overall, FW-DTI improves the reliability and inter-parameter consistency of
DTI metrics in the presence of atrophy, and the resulting metrics provide more sensitive and specific insight into
AD-related pathological changes in white matter.
Received: 2 April 2020; Accepted: 9 March 2021
References
1. Ferri, C. P. et al. Global prevalence of dementia: A Delphi consensus study. Lancet 366(9503), 2112–2117 (2005).
2. Oishi, K. & Lyketsos, C. G. Alzheimer’s disease and the fornix. Front. Aging Neurosci. 6, 241 (2014).
3. Sexton, C. E., Kalu, U. G., Filippini, N., Mackay, C. E. & Ebmeier, K. P. A meta-analysis of diffusion tensor imaging in mild cogni-
tive impairment and Alzheimer’s disease. Neurobiol. Aging 32(12), 2322.e5–18 (2011).
4. Jones, D. K. & Cercignani, M. Twenty-five pitfalls in the analysis of diffusion MRI data. NMR Biomed. 23(7), 803–820 (2010).
5. Vos, S. B., Jones, D. K., Jeurissen, B., Viergever, M. A. & Leemans, A. The influence of complex white matter architecture on the
mean diffusivity in diffusion tensor MRI of the human brain. Neuroimage 59(3), 2208–2216 (2012).
6. Concha, L. A macroscopic view of microstructure: Using diffusion-weighted images to infer damage, repair, and plasticity of white
matter. Neuroscience 276, 14–28 (2014).
7. Liu, Y. et al. Diffusion tensor imaging and tract-based spatial statistics in Alzheimer’s disease and mild cognitive impairment.
Neurobiol. Aging 32(9), 1558–1571 (2011).
8. Stricker, N. H. et al. Decreased white matter integrity in late-myelinating fiber pathways in Alzheimer’s disease supports retrogen-
esis. Neuroimage 45(1), 10–16 (2009).
9. Ukmar, M. et al. Evaluation of white matter damage in patients with Alzheimer’s disease and in patients with mild cognitive
impairment by using diffusion tensor imaging. Radiol. Med. 113(6), 915–922 (2008).
10. Bozzali, M. et al. White matter damage in Alzheimer’s disease assessed in vivo using diffusion tensor magnetic resonance imaging.
J. Neurol. Neurosurg. Psychiatry 72(6), 742–746 (2002).
11. Shim, G. et al. Predicting neurocognitive function with hippocampal volumes and DTI metrics in patients with Alzheimer’s
dementia and mild cognitive impairment. Brain Behav. 7(9), e00766 (2017).
12. Xue, Y. et al. Characterization of Alzheimer’s disease using ultra-high b-values apparent diffusion coefficient and diffusion kurtosis
imaging. Aging Dis. 10(5), 1026–1036 (2019).
13. Ibrahim, I. et al. Combination of voxel based morphometry and diffusion tensor imaging in patients with Alzheimer’s disease.
Neuro Endocrinol. Lett. 30(1), 39–45 (2009).
14. Mayo, C. D. et al. Relationship between DTI metrics and cognitive function in Alzheimer’s disease. Front. Aging Neurosci. 10, 436
(2018).
Scientific Reports | (2021) 11:6990 | https://doi.org/10.1038/s41598-021-86505-7 10
Vol:.(1234567890)www.nature.com/scientificreports/
15. Patil, R. B. & Ramakrishnan, S. Analysis of sub-anatomic diffusion tensor imaging indices in white matter regions of Alzheimer
with MMSE score. Comput Methods Programs Biomed 117(1), 13–19 (2014).
16. Stahl, R. et al. White matter damage in Alzheimer disease and mild cognitive impairment: Assessment with diffusion-tensor MR
imaging and parallel imaging techniques. Radiology 243(2), 483–492 (2007).
17. Pierpaoli, C., Jezzard, P., Basser, P. J., Barnett, A. & Di Chiro, G. Diffusion tensor MR imaging of the human brain. Radiology 201(3),
637–648 (1996).
18. Pasternak, O., Sochen, N., Gur, Y., Intrator, N. & Assaf, Y. Free water elimination and mapping from diffusion MRI. Magn. Reson.
Med. 62(3), 717–730 (2009).
19. Metzler-Baddeley, C., O’Sullivan, M. J., Bells, S., Pasternak, O. & Jones, D. K. How and how not to correct for CSF-contamination
in diffusion MRI. Neuroimage 59(2), 1394–1403 (2012).
20. Hoy, A. R. et al. Microstructural white matter alterations in preclinical Alzheimer’s disease detected using free water elimination
diffusion tensor imaging. PLoS ONE 12(3), e0173982 (2017).
21. Ji, F. et al. Distinct white matter microstructural abnormalities and extracellular water increases relate to cognitive impairment in
Alzheimer’s disease with and without cerebrovascular disease. Alzheimers Res. Ther. 9(1), 63 (2017).
22. Fletcher, E., Carmichael, O., Pasternak, O., Maier-Hein, K. H. & DeCarli, C. Early brain loss in circuits affected by alzheimer’s
disease is predicted by fornix microstructure but may be independent of gray matter. Front. Aging Neurosci. 6, 106 (2014).
23. Maier-Hein, K. H. et al. Widespread white matter degeneration preceding the onset of dementia. Alzheimers Dement. 11(5),
485–493.e2 (2015).
24. Ofori, E. et al. Free-water imaging of the hippocampus is a sensitive marker of Alzheimer’s disease. Neuroimage Clin. 24, 101985
(2019).
25. Arribarat G., O. Pasternak, A. De Barros, M. Galitzky, O. Rascol and P. Peran, Substantia nigra locations of iron-content, free-water
and mean diffusivity abnormalities in moderate stage Parkinson’s disease. Parkinsonism Relat. Disord. 65, 146–152 (2019). https://
doi.org/10.1016/j.parkreldis.2019.05.033.
26. Bergamino, M., Kuplicki, R., Victor, T. A., Cha, Y. H. & Paulus, M. P. Comparison of two different analysis approaches for DTI
free-water corrected and uncorrected maps in the study of white matter microstructural integrity in individuals with depression.
Hum. Brain Mapp. 38(9), 4690–4702 (2017).
27. Bergamino, M., Pasternak, O., Farmer, M., Shenton, M. E. & Hamilton, J. P. Applying a free-water correction to diffusion imaging
data uncovers stress-related neural pathology in depression. Neuroimage Clin. 10, 336–342 (2016).
28. Dumont, M. et al. Free water in white matter differentiates MCI and AD from control subjects. Front. Aging Neurosci. 11, 270
(2019).
29. Marcus, D. S., Fotenos, A. F., Csernansky, J. G., Morris, J. C. & Buckner, R. L. Open access series of imaging studies: Longitudinal
MRI data in nondemented and demented older adults. J. Cogn. Neurosci. 22(12), 2677–2684 (2010).
30. Ardekani, B. A., Bachman, A. H., Figarsky, K. & Sidtis, J. J. Corpus callosum shape changes in early Alzheimer’s disease: An MRI
study using the OASIS brain database. Brain Struct. Funct. 219(1), 343–352 (2014).
31. Bachman, A. H., Lee, S. H., Sidtis, J. J. & Ardekani, B. A. Corpus callosum shape and size changes in early Alzheimer’s disease: A
longitudinal MRI study using the OASIS brain database. J. Alzheimers Dis. 39(1), 71–78 (2014).
32. Folstein, M. F., Folstein, S. E. & McHugh, P. R. “Mini-mental state”. A practical method for grading the cognitive state of patients
for the clinician. J. Psychiatr. Res. 12(3), 189–198 (1975).
33. Khan, T.K. Clinical Diagnosis of Alzheimer’s Disease in Biomarkers in Alzheimer’s Disease, Elsevier, Editor. (Academic Press,
2016). ISBN 978-0-12-804832-0. https://doi.org/10.1016/C2015-0-04217-4.
34. Smith, S. M. et al. Advances in functional and structural MR image analysis and implementation as FSL. Neuroimage 23(Suppl 1),
S208–S219 (2004).
35. Andersson, J. L. R. & Sotiropoulos, S. N. An integrated approach to correction for off-resonance effects and subject movement in
diffusion MR imaging. Neuroimage 125, 1063–1078 (2016).
36. Smith, S. M. Fast robust automated brain extraction. Hum. Brain Mapp. 17(3), 143–155 (2002).
37. Ennis, D. B. & Kindlmann, G. Orthogonal tensor invariants and the analysis of diffusion tensor magnetic resonance images. Magn.
Reson. Med. 55(1), 136–146 (2006).
38. Keihaninejad, S. et al. The importance of group-wise registration in tract based spatial statistics study of neurodegeneration: A
simulation study in Alzheimer’s disease. PLoS ONE 7(11), e45996 (2012).
39. Avants, B. B., Epstein, C. L., Grossman, M. & Gee, J. C. Symmetric diffeomorphic image registration with cross-correlation:
Evaluating automated labeling of elderly and neurodegenerative brain. Med. Image Anal. 12(1), 26–41 (2008).
40. Varentsova, A., Zhang, S. & Arfanakis, K. Development of a high angular resolution diffusion imaging human brain template.
Neuroimage 91, 177–186 (2014).
41. Winkler, A. M., Ridgway, G. R., Webster, M. A., Smith, S. M. & Nichols, T. E. Permutation inference for the general linear model.
Neuroimage 92, 381–397 (2014).
42. Smith, S. M. & Nichols, T. E. Threshold-free cluster enhancement: Addressing problems of smoothing, threshold dependence and
localisation in cluster inference. Neuroimage 44(1), 83–98 (2009).
43. Hua, K. et al. Tract probability maps in stereotaxic spaces: Analyses of white matter anatomy and tract-specific quantification.
Neuroimage 39(1), 336–347 (2008).
44. Wakana, S. et al. Reproducibility of quantitative tractography methods applied to cerebral white matter. Neuroimage 36(3), 630–644
(2007).
45. Hopper, M. W. & Vogel, F. S. The limbic system in Alzheimer’s disease. A neuropathologic investigation. Am. J. Pathol. 85(1), 1–20
(1976).
46. Oishi, K., Mielke, M. M., Albert, M., Lyketsos, C. G. & Mori, S. The fornix sign: A potential sign for Alzheimer’s disease based on
diffusion tensor imaging. J. Neuroimaging 22(4), 365–374 (2012).
47. Ringman, J. M. et al. Diffusion tensor imaging in preclinical and presymptomatic carriers of familial Alzheimer’s disease mutations.
Brain 130(Pt 7), 1767–1776 (2007).
48. Mielke, M. M. et al. Regionally-specific diffusion tensor imaging in mild cognitive impairment and Alzheimer’s disease. Neuroim-
age 46(1), 47–55 (2009).
49. Bosch, B. et al. Multiple DTI index analysis in normal aging, amnestic MCI and AD. Relationship with neuropsychological per-
formance. Neurobiol. Aging 33(1), 61–74 (2012).
50. Damoiseaux, J. S. et al. White matter tract integrity in aging and Alzheimer’s disease. Hum. Brain Mapp. 30(4), 1051–1059 (2009).
51. Douaud, G. et al. Brain microstructure reveals early abnormalities more than two years prior to clinical progression from mild
cognitive impairment to Alzheimer’s disease. J. Neurosci. 33(5), 2147–2155 (2013).
52. Honea, R. A., Vidoni, E., Harsha, A. & Burns, J. M. Impact of APOE on the healthy aging brain: A voxel-based MRI and DTI study.
J. Alzheimers Dis. 18(3), 553–564 (2009).
53. Sun, X. et al. Destruction of white matter integrity in patients with mild cognitive impairment and Alzheimer disease. J. Investig.
Med. 62(7), 927–933 (2014).
54. Palesi, F. et al. Specific patterns of white matter alterations help distinguishing Alzheimer’s and vascular dementia. Front. Neurosci.
12, 274 (2018).
Scientific Reports | (2021) 11:6990 | https://doi.org/10.1038/s41598-021-86505-7 11
Vol.:(0123456789)www.nature.com/scientificreports/
55. Alves, G. S. et al. Integrating retrogenesis theory to Alzheimer’s disease pathology: Insight from DTI-TBSS investigation of the
white matter microstructural integrity. Biomed. Res. Int. 2015, 291658 (2015).
56. Di Paola, M. et al. When, where, and how the corpus callosum changes in MCI and AD: A multimodal MRI study. Neurology
74(14), 1136–1142 (2010).
57. Tuch, D. S. et al. High angular resolution diffusion imaging reveals intravoxel white matter fiber heterogeneity. Magn. Reson. Med.
48(4), 577–582 (2002).
58. Alexander, A. L., Hasan, K. M., Lazar, M., Tsuruda, J. S. & Parker, D. L. Analysis of partial volume effects in diffusion-tensor MRI.
Magn. Reson. Med. 45(5), 770–780 (2001).
59. Douaud, G. et al. DTI measures in crossing-fibre areas: Increased diffusion anisotropy reveals early white matter alteration in MCI
and mild Alzheimer’s disease. Neuroimage 55(3), 880–890 (2011).
60. Teipel, S. J. et al. Fractional anisotropy changes in Alzheimer’s disease depend on the underlying fiber tract architecture: A mul-
tiparametric DTI study using joint independent component analysis. J. Alzheimers Dis. 41(1), 69–83 (2014).
61. Acosta-Cabronero, J., Alley, S., Williams, G. B., Pengas, G. & Nestor, P. J. Diffusion tensor metrics as biomarkers in Alzheimer’s
disease. PLoS ONE 7(11), e49072 (2012).
62. Huang, H. et al. Distinctive disruption patterns of white matter tracts in Alzheimer’s disease with full diffusion tensor characteriza-
tion. Neurobiol. Aging 33(9), 2029–2045 (2012).
63. Preti, M. G. et al. Assessing corpus callosum changes in Alzheimer’s disease: Comparison between tract-based spatial statistics
and atlas-based tractography. PLoS ONE 7(4), e35856 (2012).
Acknowledgements
The authors thank Elliott Mufson, PhD, for many helpful discussions. This work was supported by the Barrow
Neurological Foundation and the Arizona Alzheimer’s Consortium. Data was provided by the OASIS project,
supported by the following NIH Grants: P50 AG05681, P01 AG03991, R01 AG021910, P50 MH071616, U24
RR021382, R01 MH56584.
Author contributions
M.B. and A.M.S. conceived of the idea. M.B. performed data analysis and prepared all figures. M.B. and A.M.S.
contributed to interpretation of the results. M.B. and A.M.S. wrote the manuscript, and all authors reviewed
the manuscript.
Competing interests
The authors declare no competing interests.
Additional information
Supplementary Information The online version contains supplementary material available at https://doi.org/
10.1038/s41598-021-86505-7.
Correspondence and requests for materials should be addressed to A.M.S.
Reprints and permissions information is available at www.nature.com/reprints.
Publisher’s note Springer Nature remains neutral with regard to jurisdictional claims in published maps and
institutional affiliations.
Open Access This article is licensed under a Creative Commons Attribution 4.0 International
License, which permits use, sharing, adaptation, distribution and reproduction in any medium or
format, as long as you give appropriate credit to the original author(s) and the source, provide a link to the
Creative Commons licence, and indicate if changes were made. The images or other third party material in this
article are included in the article’s Creative Commons licence, unless indicated otherwise in a credit line to the
material. If material is not included in the article’s Creative Commons licence and your intended use is not
permitted by statutory regulation or exceeds the permitted use, you will need to obtain permission directly from
the copyright holder. To view a copy of this licence, visit http://creativecommons.org/licenses/by/4.0/.
© The Author(s) 2021
Scientific Reports | (2021) 11:6990 | https://doi.org/10.1038/s41598-021-86505-7 12
Vol:.(1234567890)You can also read