Design and Evaluation of a Macroarray for Detection, Identification, and Typing of Viral Hemorrhagic Septicemia Virus (VHSV) - MDPI
←
→
Page content transcription
If your browser does not render page correctly, please read the page content below
animals
Article
Design and Evaluation of a Macroarray for Detection,
Identification, and Typing of Viral Hemorrhagic Septicemia
Virus (VHSV)
Carmen López-Vázquez                      , Isabel Bandín       and Carlos P. Dopazo *

                                            Unidad de Ictiopatología, Instituto de Acuicultura y Departamento de Microbiología,
                                            Universidad de Santiago de Compostela, 15782 Santiago de Compostela, Spain;
                                            mdelcarmen.lopez.vazquez@usc.es (C.L.-V.); isabel.bandin@usc.es (I.B.)
                                            * Correspondence: carlos.pereira@usc.es

                                            Simple Summary: In the present report will be the first of a series of PCR-based macroarrays for the
                                            detection, typing, and quantification of several viruses of importance in fish aquaculture. The way of
                                            preparing the array—under patent process—differs from macroarrays reported by other researchers
                                            because it ensures its reliability after storage times up to 1 year at −25 ◦ C. In this study, we show
                                            the results of the evaluation of a macroarray designed for the viral hemorrhagic septicemia virus
                                            (VHSV), of great importance for fish farmers worldwide, and the same procedure of validation is
                                            ongoing with macroarrays for other fish viruses.

                                            Abstract: The viral hemorrhagic septicemia virus (VHSV) is the causative agent of an important
                                  disease in freshwater and marine fishes. Its diagnosis officially relies on the isolation of the virus in

                                            cell culture and its identification by serological or polymerase chain reaction (PCR) methodologies.
Citation: López-Vázquez, C.;
                                            Nowadays, reverse transcription real-time quantitative PCR (RT-qPCR) is the most widely employed
Bandín, I.; Dopazo, C.P. Design and
                                            technique for the detection of this virus and some studies have reported the validation of RT-qPCR
Evaluation of a Macroarray for
                                            procedures for the detection, typing, and quantification of VHSV isolates. However, although the
Detection, Identification, and Typing
                                            efficacy of this technique is not in doubt, it can be cumbersome and even impractical when it comes
of Viral Hemorrhagic Septicemia
Virus (VHSV). Animals 2021, 11, 841.
                                            to processing large numbers of samples, a situation in which cross-contamination problems cannot be
https://doi.org/10.3390/ani11030841         ruled out. In the present study, we have designed and validated a macroarray for the simultaneous
                                            detection, typing, and quantification of VHSV strains. Its analytical sensitivity (5–50 TCID50 /mL ),
Academic Editor: Daniel                     analytical specificity (intra and intergroup), efficiency (E = 100.0–101.1) and reliability (repeatability
Padilla Castillo                            and reproducibility with CV < 5%, and standard curves with R2 < 0.95) with strains from any VHSV
                                            genotype have been widely demonstrated. The procedure is based on the ‘binary multiplex RT-qPCR
Received: 22 February 2021                  system (bmRT-qPCR)’ previously reported by the same team, applied to arrays of 96-well PCR strip
Accepted: 12 March 2021                     tubes plates, which can be stored at −25 ◦ C for three months and up to one year before their use,
Published: 16 March 2021
                                            without significant loss of efficiency.

Publisher’s Note: MDPI stays neutral
                                            Keywords: diagnosis; viral haemorrhagic septicaemia virus
with regard to jurisdictional claims in
published maps and institutional affil-
iations.

                                            1. Introduction
                                                 Viral hemorrhagic septicemia (VHS), a disease widely distributed among freshwater
                                            and marine fishes, is one of the most serious viral diseases affecting farmed rainbow trout
Copyright: © 2021 by the authors.
                                            in Europe [1,2]. The causative agent, the viral hemorrhagic septicemia virus (VHSV), causes
Licensee MDPI, Basel, Switzerland.
                                            mortality in fish throughout their life cycle, and in many cases can produce a persistent
This article is an open access article
distributed under the terms and
                                            carrier state in the host. Those carrier fish can release virus into the environment and act as
conditions of the Creative Commons
                                            a source of infection to healthy fish and other marine organisms [3].
Attribution (CC BY) license (https://
                                                 VHSV is a member of the genus Novirhabdovirus, belonging to the family Rhabdoviridae.
creativecommons.org/licenses/by/            Based on genome sequencing, the VHSV isolates have been divided into four genogroups,
4.0/).

Animals 2021, 11, 841. https://doi.org/10.3390/ani11030841                                                    https://www.mdpi.com/journal/animals
Animals 2021, 11, 841                                                                                            2 of 16

                        named from genogroups I to IV; additionally, genogroups I and IV are divided into different
                        sublineages [4–9].
                              The international standards to facilitate the control of the disease caused by this virus
                        include isolation of the virus in cell culture and further identification by serological tech-
                        niques or by reverse transcription PCR (RT-PCR) [10]. In addition, due to the implications
                        that the viral genotypes—recognized by the OIE—can have on its real risk level of the
                        disease, and due to the international norms regarding aquaculture trade [11], the typing of
                        new isolates is becoming an additional need for diagnostic laboratories. In fact, genotyping
                        is accepted as an important tool for tracing isolates in molecular epidemiology [12]. To this
                        regard, our group has recently reported reverse transcription real-time quantitative PCR
                        (RT-qPCR) procedures for diagnosis and quantification [13] and for typing [14] of this virus.
                        Since those procedures were based on TaqMan® probes, we considered the possibility of
                        adapting them to the array technology.
                              Such technology was originally designed by immobilizing oligonucleotide probes to
                        solid membranes for subsequent colorimetric detection [15]; it has created a breakthrough
                        in diagnostics, allowing many specific sequences to be analyzed simultaneously, and has
                        been adapted for detection of a number of viruses [16]. Arrays work in a number of
                        different ways, but the common characteristic is that many specific pieces of nucleic acid
                        can be identified by the use of complementary probes that make up the array [17]. However,
                        since it is based on nucleic acid hybridization (NAH), and because the handicap of NAH
                        is its relative low sensitivity [18], it would not be an appropriate option for diagnosis
                        of this virus, especially in asymptomatic fish. Nevertheless, its combination with PCR
                        amplification solves this drawback, and thus it has been widely applied in recent studies
                        using both macro and microarrays for the diagnosis of viral diseases [19–24].
                              In the study cited above [14], we reported the validation of a binary multiplex RT-
                        qPCR (bmRT-qPCR) for the diagnosis and typing of VHSV strains from any genotype.
                        Therefore, we used that method to design an RT-qPCR based macroarray for the diagnosis
                        and typing of VHSV. By using two sets of multiplex PCR and five DNA probes with three
                        different fluorophores, we have developed a simple, robust, and rapid diagnostic platform
                        capable of the simultaneous detection and characterization of the four genotypes of VHSV
                        including sublineages IVa and IVb. Although the qPCR procedure the array was based
                        on has been already validated, we thought necessary to demonstrate that the macroarray
                        maintained all the characteristics of high analytical sensitivity, analytical specificity, and
                        efficiency of the bmRT-qPCR method; therefore, we have carried out the present study,
                        where we have demonstrated the reliability of the proposed macroarray.

                        2. Materials and Methods
                        2.1. Cell Culture and Virus
                              The epithelioma papulosum cyprinid (EPC) fish cell line (ECACC 93120820), derived
                        from common carp (Cyprinus carpio L.) was maintained at 20 ◦ C in Eagle’s minimum essen-
                        tial medium (EMEM; GIBCO, ThermoFisher, Madrid, Spain) containing 10% fetal bovine
                        serum (FBS; GIBCO), penicillin (100 IU/mL) (GIBCO) and streptomycin (100 µg/mL)
                        (GIBCO), buffered with 7.5% sodium bicarbonate (GIBCO).
                              Since the macroarray is based on a previously reported PCR amplification procedure
                        validated against a large number of VHSV and non-VHSV rhabdoviruses [14], the number
                        of VHSV strains employed in the present study was limited, focused to ensure that that
                        reliability of the array was not affected. The reference VHSV viral strains used were
                        FR-07-71 (Genogroup Ia; [25]), DK-1p49 (Genogroup II; [1]), MLA98/6WH1 (G. III; [26]),
                        US-MAKAH (G. IVa; [27]), Goby 1-5 (G. IVb; [28]). The viruses were replicated in EPC cells
                        using EMEM with 2% FBS and antibiotics as described. When the cytopathic effect became
                        extensive, the supernatant was harvested and centrifuged to eliminate cell debris. Clarified
                        supernatants were then used for the subsequent experiments.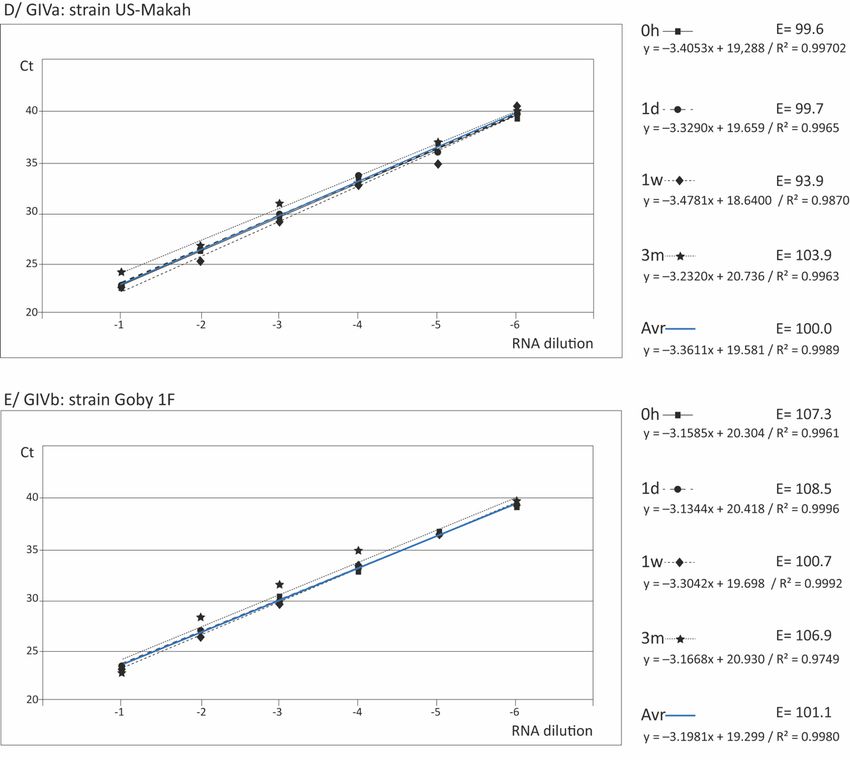
Animals 2021, 11, 841                                                                                          3 of 16

                        2.2. Viral Titration
                             The viral titrations were performed using the endpoint dilution method, as previously
                        described [29], using 96-well plates with EPC cells (3 replicas per dilution), and the titers
                        determined by the Reed and Müench [30] procedure, and given as TCID50 /mL .

                        2.3. Primers and Probes
                             The PCR amplification step of this macroarray is on in the binary multiplex RT-qPCR
                        (bmRT-qPCR) for the diagnosis and typing of VHSV strains of the 4 genogroups, designed
                        and validated by Vázquez et al. [14]. In this procedure, the system consists of 2 PCR
                        tubes, MSI and MSII (multiplex systems I and II). MSI uses a set of 2 primers and 3 probes
                        designed for the European genotypes; the probes are specific for genotypes I (FAM labelled),
                        II (HEX labelled) and III (Tex Red labelled). MSII uses 2 sets of 2 primers and 1 probe; one
                        is specific for genogroup IVa (FAM labelled), and the second one for genotype IVb (HEX
                        labelled). The specificity of the binary multiplex system was successfully evaluated against
                        a panel of 79 VHSV strains of all genogroups and sublineages [14].

                        2.4. The Array System
                              For the construction of the array system, 96-well PCR strip tube plates (FrameStar
                        Break-A-Way (4titude® Limited, Surrey, UK) were employed. Four replicas of the bmRT-
                        qPCR system (2 tubes per replica: MSI and MSII) were placed per strip, loading the
                        corresponding mixture of primers/probes (MSI or MSII; see reference [14]) in the bottom of
                        the tubes. The loaded volume was calculated to obtain the final concentration in the reaction
                        as indicated below. Then, the plates were subjected to a procedure—patent pending—to
                        fix the primers and probes to the bottom of the well. The dried plates were then stored at
                        −25 ◦ C until use or used immediately. After the corresponding conservation time (see
                        below), the plates were removed from the freezer, allowed to warm to room temperature,
                        and used immediately.
                              The array was evaluated to be used for qPCR using pre-synthetized cDNA, or for
                        RT-qPCR, using extracted viral RNA. At the time of use, the corresponding master mix
                        was loaded, followed by the 10-fold serial dilutions (in triplicate) of each cDNA or viral
                        RNA (respectively). Thereafter, the appropriate amplification procedure was applied, as
                        indicated below.

                        2.5. RNA Extraction and Quantification
                             Total RNA was extracted from 200 µL of clarified virus using the RNeasy mini kit
                        (Qiagen, Madrid, Spain) following the manufacturer’s instructions, to a final elution
                        volume of 50 µL. RNA quantification was performed with a ND-1000 spectrophotometer
                        (Nanodrop Technologies, Wilmington, NC, USA), and its quality evaluated from the ratios
                        A260/280 and A260/A230. Finally, the RNA concentration was adjusted to 1 ng/µL, and
                        serial 10-fold dilutions were prepared.

                        2.6. Reverse Transcription
                              The cDNA synthesis was performed using Superscript III RT (GIBCO, ThermoFisher,
                        Madrid, Spain). For this purpose, 9 µL of the extracted RNA were mixed with 2.5 ng/µL of
                        random primers, and the mixture was incubated at 95 ◦ C for 5 min, and then kept on ice for
                        at least 1 min. A reverse transcription mixture containing 10 U/µL of enzyme, 0.5 mM of
                        dNTPs, and 0.05 M dithiothreitol (DTT) in 1× ‘first strand buffer’ was then added, and the
                        final mixture was incubated at 25 ◦ C for 10 min, followed by 50 min at 50 ◦ C. The reaction
                        was finally stopped by heating at 85 ◦ C for 5 min.

                        2.7. TaqMan Real-Time PCR
                             The real-time PCR was performed using the KAPA PROBE FAST universal qPCR
                        Kit (Kapa Biosystems, SIGMA, Barcelona, Spain). The PCR mixture (25 µL final volume)
                        contained 2.5 µL of cDNA, 12.5 µL of Kapa probe Fast Universal 2× qPCR Master Mix, and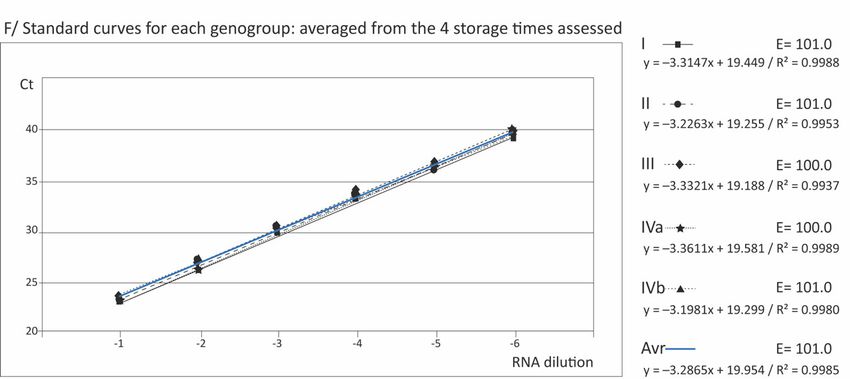
Animals 2021, 11, 841                                                                                           4 of 16

                        the corresponding mixture of primers/probes sets (see reference [14]), previously loaded
                        and fixed to the PCR wells as indicated below, to obtain final concentrations of 500 nM per
                        primer and 200 mM per probe. Following an initial 2 min activation/denaturation step
                        at 95 ◦ C, the mixture was subjected to 45 cycles of amplification (denaturation for 15 s at
                        95 ◦ C, annealing and extension for 30 s at 58 ◦ C), in an iCycler iQ CFX96TM Real Time
                        System (BioRad, Madrid, Spain).

                        2.8. One Step Real-Time RT-PCR
                             Real-time RT-PCR was performed using QuantiFast Probe RT-PCR Master Mix without
                        ROX (Qiagen). The reaction, with a final volume of 25 µL, contained 5 µL of RNA, 12.5 µL
                        of 2× Master Mix, 0.25 µL of RT Mix, and the corresponding mixture of primers/probes
                        as indicated above. All reactions were carried out in an iCycler iQ CFX96TM Real Time
                        System (BioRad) with the following thermal profile: An initial reverse transcription step
                        at 50 ◦ C for 10 min, followed by a PCR activation step at 10 ◦ C for 5 min, and 45 cycles
                        of denaturation at 95 ◦ C for 10 s, and annealing and extension of 30 s at an optimized
                        temperature of 58 ◦ C with end point fluorescence data collection.

                        2.9. Evaluation of the Efficiency and Reliability of the Array
                               The evaluation has been performed following stages 1 (analytical characteristic) and
                         3 (repeatability and reproducibility) of the OIE “Principles and methods of validation of
                         diagnostic assays for infectious diseases” [10], testing several parameters:
                               Sensitivity—The sensitivity of the macroarray was evaluated in terms of the detection
                         limit (DL), as the minimum viral titer (in TCID50 /mL ) detectable (by RT-qPCR and by
                        qPCR) in the 3 replicas performed. In addition, another condition to admit the value was
                         that the detection was performed with an average Ct below 41, and that the standard curve
                         at that point was reliable (with R2 ≤ 0.95).
                               Specificity—The PCR procedure that the array is based on—the bmRT-qPCR—was
                        previously validated [14] against a panel of 79 VHSV strains from all genogroups and
                         sublineages (intragroup specificity, to ensure that any VHSV strain in detected): 2 from
                         genogroup I, 19 from sublineage Ia, 13 from Ib, 3 from Ic, 3 from Id, and 1 from Ie; 4 from
                         genogroup II; 12 from genogroup III; 17 from genogroup IV, sublineage a, and 5 from
                         sublineage IVb. In addition, in that study, intergroup specificity (to ensure that only VHSV
                         strains are detected) was evaluated against 13 non-VSHV rhabdovirus strains and an
                         aquabinavirus. Therefore, to confirm its intra-group specificity in this macroarray, a set of
                         5 strains, one from each genogroup including both genogroup IV sublineages, was selected
                        (see Section 2.1)
                               Repeatability and reproducibility—Three replicas per assay (all strains and dilutions)
                        were performed with both types of assays (RT-qPCR and qPCR), to evaluate repeatability,
                        which is defined as the precision of the procedure when replicas are simultaneously per-
                         formed (the same time) on a single sample, by a certain operator, with the same method,
                         materials, and equipment. Furthermore, taking advantage of the array stability testing, re-
                        producibility was also tested to evaluate the precision of the array by varying the parameter
                        ‘time’ (storage time).
                               Stability—As indicated above, after fixing the primer/probe sets, the arrays were used
                         immediately (0h storage time or stored at −25 ◦ C for 1 day, 1 week, or 3 months before
                         being tested.
                               Reliability of the curves—In addition to the repeatability and reproducibility as a
                        parameter to ensure the reliability of the arrays, an important parameter considered to
                         evaluate the reliability of the curves was the amplification efficiency, calculated from the
                         formula E = 10−1/S−1 (where S is the slope of the regression line). Although the optimum
                         E value is 100%, values between 95 and 110% are also considered acceptable. On the other
                         hand, to ensure the reliability of the standard curves for quantification, the coefficient of
                         determination (R2 ) of the curves was also calculated (R2 ≥ 0.95 is considered acceptable,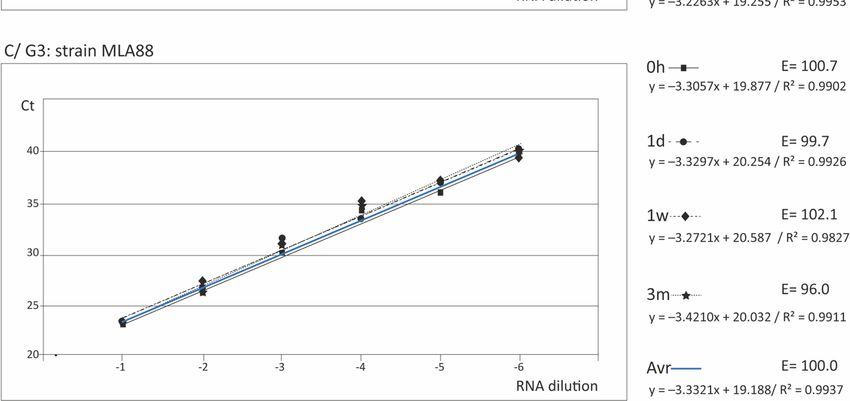
Animals 2021, 11, 841                                                                                            5 of 16

                        and optimum for R2 ≥ 0.99). For comparative purposes, in parallel to the array tested at
                        0 h, the normal RT-qPCR and the qPCR procedures were also carried out.

                        2.10. Statistical Analysis
                             To evaluate repeatability and reproducibility (R&R), the coefficient of variation (CV
                        = standard deviation/average × 100) from the 3 replicas and 4 repeats, respectively, was
                        calculated. Values of CV ≤ 5% were considered indicative of high R&R, although values
                        ≤10% were also acceptable. Besides the analysis of reproducibility to assess the effect of
                        the storage time, a comparison of the amplification curves was carried out. To determine
                        if two or more curves were similar, the slopes and intersections were compared using an
                        F test, with the InStat Prism 5 statistical package (GraphPad Software Inc., La Jolla, CA,
                        USA). If the p-Value is small (p < 0.05) for both parameters, the idea that differences are due
                        to random sampling can be rejected and therefore both curves are different; if differences
                        are only demonstrated for the intersections, the curves are assumed to be parallel. In
                        addition, to confirm that the preparation of the macroarray did not affect the reliability of
                        the standard curves, the regression lines obtained with the array tested at 0 h storage time
                        were compared with those obtained with the normal RT-qPCR or qPCR procedures, by
                        means of a t-test using Mann–Whitney with SGPP5; as before, significant differences were
                        defined by p-Values ≤ 0.05.

                        3. Results
                             The macroarray designed for the detection, identification, and typing of VHSV was
                        tested with one strain from each genogroup to be used for qPCR or for a single-step
                        RT-qPCR, and the results are summarized in Table 1.

                        3.1. Evaluation of the Macroarray Used with RT-qPCR
                              As shown in the table, using the macroarray for RT-qPCR detection, the maximum
                        viral dilution allowing positive detection was 10−6 with strains of any of the genogroups.
                        Although positive amplification was obtained at dilution 10−7 in some cases (see Supple-
                        mentary Table S1, which shows results with all dilutions and replicas), to consider the
                        DL, a Ct value ≤ 41 in the three replicas was essential, and this was attained only with
                        dilution 10−6 . Considering that the stocks of virus were titrated at around 5 × 10⁶ and
                        5 × 10⁷ TCID50 /mL (European genogroups and genogroup IV, respectively) in EPC cells,
                        the limit of detection was established at around 5 for the European types (I to III) and 50
                        for genogroup IV strains. The average Ct values from the three replicas ranged from 22, at
                        the highest viral concentrations (Table S1), to around 39 (in most cases) at dilution 10−6
                        (Table 1). Only in one case (testing genogroup IV strains with the macroarray after three
                        months storage), was a Ct = 40.11 reached.
                              The reliability of the standard curves and, therefore, of the quantification, was demon-
                        strated by R2 values over 0.95 in all cases (and over 0.99 in most) with all genotypes and
                        after any storage time (Table 1), as well as with all replicas (Table S1). The standard curves
                        and their corresponding equations are shown in Figure 1 (and Supplementary Figure S1),
                        where the PCR reaction efficiencies (calculated from the formula E = [(10−1/slope −1) × 100]
                        are also included. As observed, the E values were always within the range [96-110] with
                        the European strains, and between 93.9 and 108.5 with strains from genotype IV, aver-
                        aging 101.3 ± 0.79 and 103.45 ± 5.44, respectively, at 0 h storage, and 97.47 ± 2.29 and
                        105.40 ± 2.12 after 3 m at −25 ◦ C (Table 1). Furthermore, no significant differences (p > 0.05)
                        with the standard curves obtained by the regular RT-qPCR procedure were observed (data
                        not shown).
                              The repeatability of the assay was evaluated using the coefficient of variation (CV)
                        among the replicas, which showed values in most cases below 5% (except in 2 cases, which
                        were between 5 and 10%) (Table S1). Regarding the reproducibility (calculated from the
                        Ct data of the 4 storage times), the values were always below 5 (Table S1). To confirm
                        reproducibility (i.e., the stability of the array at different storage times), the regression
Animals 2021, 11, 841 6 of 16
curves corresponding to the different storage times were compared to assess if significant
differences between slopes and intercepts existed. As observed in Figure 1, apparently no
differences were obtained between the curves corresponding to the different conservation
times. This was statistically confirmed by the slopes, as shown in Table 2; only in some cases
(labelled *), significant differences were observed in the intersection, mostly associated
with the array conserved during three months at −25 ◦ C. However, when the curves were
analyzed, those significant differences did not seem to be so significant. In fact, studying
the Ct data in Table S1 (and averages in Table 1), the differences were in most cases below
1.5, and always below 2.2. For instance, comparing the standard curves for genogroup I
between 1 d and 1 w conserved arrays (Intersects: p = 0.0027), the Ct values differed in
less than 0.92, or between 0.09 and 1.5 comparing genogroup IVa in 1 w and 3 m stored
arrays (Intersect: p < 0.0001). Moreover, considering that the average number of Ct values
associated to a change in 1 Log10 of dilution was 2.8 (data calculated from Table S1, but not
shown), those maximum differences of 2.2 Ct would correspond to differences in viral titer
always below 1 log10 , a difference that has been considered not significant [31,32].
Table 1. Reliability of the macroarray: Summary of results.
Strg 1 a/ RT-qPCR b/ qPCR
7 G I. II & III G. IV G I. II & III G. IV
0h 2 Dil 10−6 10−6 Dil 10−7 10−6
3 DL 5 TCID50 /mL 50 TCID50 /mL LD 0.5 TCID50 /mL 50 TCID50 /mL
4 Ct 39.21 ± 0.36 39.03 ± 0.23 Ct 38.65 ± 0.86 36.72 ± 0.47
5 E [101.0-102.2] [99.6-107.3] E [98.6-100.7] [98.6-105.4]
101.30 ± 0.79 103.45 ± 5.44 99.70 ± 1.05 102.0 ± 4.81
6 R2 0.9953 ± 0.0045 0.9966 ± 0.0006 R2 0.9963 ± 0.0019 0.9970 ± 0.0037
1d Dil 10−6 10−6 Dil 10−7 10−6
DL 5 TCID50 /mL 50 TCID50 /mL LD 0.5 TCID50 /mL 50 TCID50 /mL
Ct 39.61 ± 0.86 39.38 ± 0.37 Ct 38.48 ± 1.11 36.42 ± 1.10
E [99.5-104.7] [99.7-108.5] E [99.2-100.8] [95.1-109.0]
101.30 ± 2.98 104.10 ± 6.22 97.90 ± 2.81 102.05 ± 9.83
R2 0.9908 ± 0.0078 0.9980 ± 0.0022 R2 0.9967 ± 0.0022 0.9985 ± 0.0008
1w Dil 10−6 10−6 Dil 10−7 10−6
DL 5 TCID50 /mL 50 TCID50 /mL LD 0.5 TCID50 /mL 50 TCID50 /mL
Ct 39.16 ± 0.16 37.46 ± 3.37 Ct 38.87 ± 0.84 37.23 ± 0.32
E [102.1-110.0] [93.9-100.7] [95.0-99.0] [97.3-106.1]
E
105.33 ± 4.52 97.30 ± 4.81 96.47 ± 2.20 101.70 ± 6.22
R2 0.9883 ± 0.0077 0.9931 ± 0.0086 R2 0.9979 ± 0.0009 0.9997 ± 0.0055
3m Dil 10−6 10−6 Dil 10−7 10−6
DL 5 TCID50 /mL 50 TCID50 /mL LD 0.5 TCID50 /mL 50 TCID50 /mL
Ct 39.75 ± 0.03 40.11 ± 0.03 Ct 38.85 ± 0.97 37.68 ± 0.97
E [96.0-100.1] [103.9-106.9] [95.2-100.6] [95.4-102.0]
E
97.47 ± 2.29 105.40 ± 2.12 98.20 ± 2.75 98.7 ± 4.67
R2 0.9996 ± 0.0030 0.9856 ± 0.1513 R2 0.9961 ± 0.0013 0.9969 ± 0.0001
1Strg: Storage time; 2 Dil: Dilution; 3 DL: Detection limit; 4 Ct: Average Ct values ± standard deviation; 5 E: Efficiency of the amplification,
calculated from the formula E = 10−1/S −1 (where S is the slope of the regression line), shown as range (between square brackets) and
average ± standard deviation; 6 R2 : coefficient of determination (R2 ) of the curves; 7 G: Genogroup.
3.2. Evaluation of the Macroarray Used with qPCR
The results obtained applying qPCR are summarized in Table 1, and all the data are
shown in Table S2. The Ct values ranged from 17.25 to 39.71 at the lowest and highest
dilutions, respectively. Regarding the sensitivity of the procedure, with the genogroup
IV strains, the DL was the same than with RT-qPCR (50 TCID50 /mL ); however, with the
European strains the limit of detection was reduced to around 0.5 TCID50 /mL . The Ct
values at the DL ranges from 38.48 ± 1.11 (averaging the five strains ± standard deviation)
to 38.81 ± 0.84 (depending on the storage time) with the European strains, and from
36.42 ± 1.10 to 37.68 ± 0.97 with genogroup IV strains. Regarding the reliability of the
standard curves, as expected it was improved with respect to RT-qPCR, since the R2 values
were always higher than 0.99, regardless of the viral strain, replica, and storage time (Table 1
and Table S2). Similarly, the amplification efficiency was also improved, obtaining averageAnimals 2021, 11, 841 7 of 16
Animals 2021, 11, x 7 of 16
E values between 95 and 102. On the other hand, no significant differences (p > 0.05)
with the standard curves obtained by the regular qPCR procedure were observed (data
not shown).
Figure 1. Cont.Animals
Animals 11,11,
2021,
2021, x 841 8 of 16 16
8 of
Figure
Figure 1. Standard
1. Standard curves
curves withwith RT‐qPCR.
RT-qPCR. For each
For each genogroup,
genogroup, the standard
the standard curvescurves obtained
obtained with
with the the macroarray
macroarray applying
applying RT-qPCR
RT‐qPCR after
immediately immediately after its
its preparation (0preparation
h) and after (0
theh)three
and storage
after thetimes
threeassessed
storage (one
timesday,
assessed (oneand
one week, day,three
one week, and
months) arethree
shown.
months) are shown. The 1equation of each curve (1), its reliability in terms of coefficient of determination (R2) (2), and the
2 2
The equation of each curve ( ), its reliability in terms of coefficient of determination (R ) ( ), and the efficiency of the amplification
(E) efficiency of the amplification
the formula(E) E =(10
3), calculated from the formula E = 10−1/S−1 (where S is the slope of the regression line),
(3 ), calculated from −1/S −1 (where S is the slope of the regression line), are indicated. For each genogroup, the
are indicated. For each genogroup, the average line (averaged from the 4 storage times) is also shown (4).
average line (averaged from the 4 storage times) is also shown (4 ).
3.2. Evaluation of the Macroarray Used with qPCR
The results obtained applying qPCR are summarized in Table 1, and all the data are
shown in Table S2. The Ct values ranged from 17.25 to 39.71 at the lowest and highest
dilutions, respectively. Regarding the sensitivity of the procedure, with the genogroup IVAnimals 2021, 11, 841 9 of 16
With respect to repeatability and reproducibility, the intra run CV values were below
5% in most cases (as with RT-qPCR, two values were between 5 and 10%), and the inter-run
values were always below 5% (Table S2). It should be noted that, although these trials
have been carried out by a researcher with 20 years of experience, in charge of the qPCR
laboratory, additional trials were occasionally performed by a technician with shorter
experience, yielding similar reproducibility results (results not shown). Regarding the
stability of the array, as shown in Figure 2 (and Supplementary Figure S2), apparently no
differences were obtained between the curves (for any viral type) corresponding to the
different storage times, except for genotype IVb (Figure 2E).
The statistical analysis confirmed that there were no differences in the slopes and,
only between the intercepts, certain significant differences were demonstrated in few cases,
mainly with the array maintained for three months at −25 ◦ C (Table 2).
However, the Ct data (Supplementary Table S2) revealed that, within the observed
dynamic range, those differences were lower than 1 Ct in most cases, except with the
genogroup IVb strain, in which case the differences in Ct reached 2.23 with respect to a 3 m
storage time. Nevertheless, such differences represented less than 1 Log10 of titer (0.3 Log10
in most cases).
3.3. Reliability of the Standard Curves for Quantification
Having demonstrated the stability of the macroarray within the three months storage
time at −25 ◦ C, the average curves for each type strain were calculated (Figures 1F and 2F)
and statistically compared. As shown in Table 3, no significant differences among the
slopes were observed in most cases, both with qPCR and RT-qPCR, which demonstrates
that the curves are parallel. The exception was the genotype IVb strain, whose standard
curve slope showed significant differences with the rest, except the genotype III strain.
However, significant differences were observed, in most cases, between the intersections of
the curves.
Table 2. Statistical analysis of the effect of storage times on the stability of the array.
RT-qPCR qPCR
GI GI
0h 1d 1w 3m 0h 1d 1w 3m
0.6870 1 0.4279 0.2330 0.3392 0.0880 0.0913
0h - -
0.0572 2 0.2960 0.0003 0.4122 0.4912 0.6363
3 GI 0.1999
0.3355 0.4671 0.3581
1d - 0.0027 -Animals 2021, 11, 841 10 of 16
Table 2. Cont.
RT-qPCR qPCR
GI GI
0h 1d 1w 3m 0h 1d 1w 3m
GIII GIII
0h 1d 1w 3m 0h 1d 1w 3m
0.8874 0.8706 0.4591 0.7884 0.9183 0.7878
0h - -
0.1127 0.0942 0.0396 * 0.5733 0.1650 0.9543
GIII 0.7924 0.5924 0.7364 0.9692
1d - -
0.7207 0.7339 0.1266 0.6456
0.4752 0.7264
1w - -
0.9250 0.2148
3m - -
GIVa GIVa
0h 1d 1w 3m 0h 1d 1w 3m
0.5133 0.6104 0.1462 0.2099 0.6969 0.3377
0h - -
0.5999 0.1040 0.0002 * 0.1683 0.4638 0.4003
GIVa 0.3190 0.4383 0.4641 0.9200
1d - -
0.0569 0.0013 * 0.0467 * 0.0369 *
0.1061 0.5878
1w - -Animals
Animals 11,11,x 841
2021,
2021, 1110
of 16
of 16
Figure 2. Cont.Animals 2021, 11, 841 12 of 16
Animals 2021, 11, x 11 of 16
FigureFigure 2. Standard
2. Standard curves
curves with withqPCR.qPCR.
For For
eacheach genogroup,
genogroup, thethe standard
standard curves
curves obtained
obtained withthe
with themacroarray
macroarrayapplying
applyingqPCR
immediately after its preparation (0 h) and after the three storage times assessed (one day, one week, and three months) three
qPCR immediately after its preparation (0 h) and after the three storage times assessed (one day, one week, and are shown.
months)ofare
The equation shown.
each curveThe
(1 ), equation of each
its reliability curveof
in terms (1),coefficient
its reliability in terms of coefficient
of determination (R2 ) (2 ), of
anddetermination
the efficiency(Rof) the
2 (2), and the
amplification
efficiency of the amplification (E) (3), calculated from the formula E = 10−1/S−1 (where S is the slope of the regression line)
(E) (3 ), calculated from the formula E = 10−1/S −1 (where S is the slope of the regression line) are indicated. For each genogroup, the
are indicated. For each genogroup, the average line (averaged from the 4 storage times) is also shown (4).
average line (averaged from the 4 storage times) is also shown (4 ).Animals 2021, 11, 841 13 of 16
4. Discussion
The use of real-time PCR in viral diagnosis is as common nowadays as normal PCR
was in the late 1990s. Its high sensitivity, specificity, and robustness is well known, but
it also reduces the diagnostic time and minimizes the risk of carryover contamination.
However, the handicap of this technology comes about when diagnosis and typing of
multiple samples in necessary: Unless an expensive robotic equipment is available, the
process of preparing the PCR mixes corresponding to each sample is tedious and there is a
risk of cross contamination. A second issue comes up when multiple pathogens must be
detected in a single sample; this can be partially solved with a multiplex strategy, which
needs extensive research to ensure that interference between the different markers does
not reduce the reliability of the procedure. However, such strategy is quite limited by the
number of markers that can be used in a single reaction.
In the last decade, a new technology has become quite popular [33,34], namely DNA
arrays or chips, which allows the detection of a large number of pathogens in a single assay;
this solves the second issue, but not the first. Moreover, that technology is based on nucleic
acid hybridization (NAH), which reduces the sensitivity of the diagnosis [18] and scientists
therefore frequently combine it with previous amplification by PCR [22,23,35,36].
Other approaches combine both methodologies into one: qPCR-based macroarrays.
The use of this kind of array for viral detection has been reported by very few authors.
Venter et al. [21] designed a macroarray for diagnosis of meningoencephalitis, mostly of
viral etiology; however, that procedure actually requires an initial application of PCR to the
extracted nucleic acid, and then the array is used just for the detection by NAH. The real
concept of a PCR-based macroarray has been applied by Hasan et al. [20] for respiratory
pathogens, and by Ries et al. [19] for bluetongue virus. In both cases, 96-well PCR plates
are filled with the corresponding mixture of primers and probes, in a solution, and the
plates can be stored at −20 ◦ C until use; however, prior to their use, the plates must be
thawed and briefly centrifuged.
The method we have designed and validated here is similar to those described above,
although the first difference comes from the fact that the primer/probe mixture is not
in a liquid format in the well, but rather dried fixed to the bottom; therefore, thawing is
quick, and the plate does not need to be centrifuged to pellet the mixture. In addition,
although Ries et al. [19] ensured that the plates can be stored for months without affecting
sensitivity, they did not actually provide any evidence. In the present report, we have
demonstrated that the macroarray plate can be stored for one week obtaining the same
Ct values, and for three months with no loss of sensitivity: The Ct values at the highest
dilution increased between 1 and 2 using the array with RT-qPCR, and even less with qPCR.
Furthermore, we tested the array in a single assay after one year of storage and observed a
reduction of sensitivity of just 1 Log10 with strains from the genogroup IV, but not with the
European types (results not shown). The importance of this feature of our macroarray for
the organizational capacity of a diagnostic laboratory is obvious.
Regarding the sensitivity of the macroarray, initially we expected to obtain the same
DL with it than with the PCR procedure that was based on the bmRT-qPCR reported by
Vázquez et al. [14]. In fact, in that study, the minimum detectable viral titer was between
3.1 and 39 TCID50 /mL with the European genogroups, and around 56 with the strains
from genogroup IV. The results obtained here with the macroarray were quite similar to
the original bmRT-qPCR system [14], and even improved with qPCR with the European
strains. The validation of other arrays has resulted in higher DL values. For instance,
Tian et al. [35] designed a microarray for detection and discrimination of A and B types of
flu virus, and reported a DL of 102 copies/µL; but that value actually corresponds to 105
copies/mL, markedly higher than the DL of our macroarrray. Lien et al. [24], using a chip
for fish viruses (and bacteria), obtained a detection limit of 10 genome copies per microliter
(104 copies/mL), similar to what was obtained by Lievens et al. [22] with an array for three
cyprinid herpesviruses. With respect to arrays designed for human viruses, high DL values
have also been reported, from the 1 × 10² cps/µL (105 cps/mL) with a microarray for fluAnimals 2021, 11, 841 14 of 16
detection [35], to an average of 6.36 cps/reaction (1.3 × 10² cps/mL) with a macroarray
designed for a variety of human viruses [21].
The macroarray would be useless if it were demonstrated to be inappropriate for some
viral types. However, its sensitivity did not change within the European strains, and only
differed 1 Log10 with respect to the American and Asian types. Additionally, as already
indicated, the real-time system employed for the array –the bmRT-qPCR system– had
previously been successfully tested against a panel of 79 VHSV strains from all genogroups
and sublineages. Moreover, the binary system combined with the use of specific probes
for each genotype has the advantage of the typing the VHSV strain simultaneously with
its detection. Besides, its high repeatability, demonstrated by the low CV values between
replicas, ensures that the use of a single replica—a practice that is certainly not uncommon
in diagnostic laboratories—does not jeopardize the reliability of the result. Regarding
specificity, in none of those reports cited above, the intragroup specificity is ensured since
different types within each group assessed was not tested in most cases. Neither was
reproducibility tested in any of them.
The reliability of the standard curves, demonstrated by the R2 and E values, ensures
the reliability of the quantification using the corresponding standard for each genotype.
Nevertheless, since the slope of the curve for the genogroup III strain was demonstrated not
to differ from the remaining types, it could be used as a standard curve for quantification
of VHSV strains from any type, of course within the dynamic range obtained in this study.
Nevertheless, it is well known that extrapolating over or below the dynamic range is
risky in any case, since it compromises the reliability of the quantification. Finally, this
array has been validated against crude virus of reference strains, and under an analytical
point of view. A large diagnostic evaluation is at present been designed as a ring test, to
assess the reliability of the macroarray directly on infected fish tissue and will be part of a
further report.
5. Conclusions
Based on these results, we are convinced that this macroarray will be extremely useful
in all types of fish viral pathology diagnostic laboratories, in this specific case for the
detection, typing, and quantification of VHSV, and it will shortly be validated for other
viruses of interest in this field.
Supplementary Materials: The following are available online at https://www.mdpi.com/2076-261
5/11/3/841/s1, Table S1: Data of RT-qPCR and regression lines for all replicas and repeats; Table
S2: Data of qPCR and regression lines for all replicas and repeats; Figure S1: Standard curves with
RT-qPCR, showing the 3 replicas; Figure S2: Standard curves with qPCR, showing the 3 replicas.
Author Contributions: Conceived and designed the experiments: C.L.-V., I.B., and C.P.D. Performed
the experiments: C.L.-V. and I.B. Analyzed the data: C.L.-V. and C.P.D. Wrote the manuscript: C.L.-V.
and C.P.D. Revised the manuscript: I.B. and C.P.D. All authors have read and agreed to the published
version of the manuscript.
Funding: This research was partially funded by the Interreg VA Spain-Portugal cooperation program
(POCTEP) 2014-2020, 0474_BLUEBIOLAB project, co-funded by FEDER.
Institutional Review Board Statement: This study did not require ethical aproval.
Data Availability Statement: The data presented in this study are available in Supplementary
Material here.
Conflicts of Interest: The authors declare no conflict of interest.
References
1. Mortensen, H.F.; Heuer, O.E.; Lorenzen, N.; Otte, L.; Olesen, N.J. Isolation of viral haemorrhagic septicaemia virus (VHSV) from
wild marine fish species in the Baltic Sea, Kattegat, Skagerrak and the North Sea. Virus Res. 1999, 63, 95–106. [CrossRef]
2. Smail, D.A. Viral haemorrhagic septicaemia. In Fish Diseases and Disorders, Volume 3: Viral, Bacterial and Fungal Infections; Woo,
P.T.K., Bruno, D.W., Eds.; CABI Publishing: New York, NY, USA, 1999; pp. 123–147.Animals 2021, 11, 841 15 of 16
3. Ellis, A.E. Innate host defense mechanism of fish against viruses and bacteria. Dev. Comp. Immunol. 2001, 25, 827–839. [CrossRef]
4. Einer-Jensen, K.; Ahrens, P.; Forsberg, R.; Lorenzen, N. Evolution of the fish rhabdovirus viral haemorrhagic septicaemia virus.
J. Gen. Virol. 2004, 85, 1167–1179. [CrossRef] [PubMed]
5. Snow, M.; Bain, N.; Black, J.; Taupin, V.; Cunningham, C.O.; King, J.A.; Skall, H.F.; Raynard, R.S. Genetic population structure of
marine viral haemorrhagic septicaemia virus (VHSV). Dis. Aquat. Organ. 2004, 61, 11–12. [CrossRef]
6. He, M.; Yan, X.C.; Liang, Y.; Sun, X.W.; Teng, C.B. Evolution of the viral hemorrhagic septicemia virus: Divergence, selection and
origin. Mol. Phylogenet. Evol. 2014, 77, 34–40. [CrossRef] [PubMed]
7. Jensen, M.H. Research on the virus of Egtved disease. Ann. N. Y. Acad. Sci. 1965, 126, 422–426. [CrossRef]
8. Nishizawa, T.; Iida, H.; Takano, R.; Isshiki, T.; Nakajima, K.; Muroga, K. Genetic relatedness among Japanese, American and European
isolates of viral hemorrhagic septicemia virus (VHSV) based on partial G and P genes. Dis. Aquat. Organ. 2002, 48, 143–148. [CrossRef]
[PubMed]
9. Guðmundsdóttir, S.; Vendramin, N.; Cuenca, A.; Sigurðardóttir, H.; Kristmundsson, A.; Iburg, T.M.; Olesen, N.J. Outbreak of
viral haemorrhagic septicaemia (VHS) in lumpfish (Cyclopterus lumpus) in Iceland caused by VHS virus genotype IV. J. Fish Dis.
2019, 42, 47–62. [CrossRef]
10. OIE (World Organization for Animal Health). Manual of Diagnostic Tests for Aquatic Animals. 2019. Available online:
https://www.oie.int/en/standard-setting/aquatic-manual/access-online/ (accessed on 16 September 2020).
11. COUNCIL DIRECTIVE 2006/88/EC (of 24 October 2006). On Animal Health Requirements for Aquaculture Animals and
Products Thereof, and on the Prevention and Control of Certain Diseases in Aquatic Animals. Available online: http://eur-lex.
europa.eu/legal-content/EN/TXT/PDF/?uri=CELEX:32006L0088&from=EN (accessed on 6 December 2020).
12. Kahns, S.; Skall, H.F.; Kaas, R.S.; Korsholm, H.; Bang Jensen, B.; Jonstrup, S.P.; Dodge, M.J.; Einer-Jensen, K.; Stone, D.; Olesen, N.J.
European freshwater VHSV genotype Ia isolates divide into two distinct subpopulations. Dis. Aquat. Organ. 2012, 99, 23–35.
[CrossRef]
13. López-Vazquez, C.; Bandín, I.; Dopazo, C.P. RT-Real-time PCR for detection, identification and absolute quantitation of VHSV
using different types of standard. Dis. Aquat. Organ. 2015, 114, 99–116. [CrossRef]
14. Vázquez, D.; López-Vázquez, C.; Skall, H.F.; Mikkelsen, S.S.; Olesen, N.J.; Dopazo, C.P. A novel multiplex RT-qPCR method
based on dual-labeled probes suitable for typing all known genotypes of Viral Haemorrhagic Septicaemia Virus. J. Fish Dis.
2015, 39, 467–482. [CrossRef] [PubMed]
15. Saiki, R.K.; Walsh, P.S.; Levenson, C.H.; Erlich, H.A. Genetic analysis of amplified DNA with immobilized sequence-specific
oligonucleotide probes. Proc. Natl. Acad. Sci. USA 1989, 86, 6230–6234. [CrossRef] [PubMed]
16. Sugiyama, S.; Masuta, C.; Sekiguchi, H.; Uehara, T.; Shimura, H.; Maruta, Y. A simple, sensitive, specific detection of mixed
infection of multiple plant viruses using macroarray and microtube hybridization. J. Virol. Meth. 2008, 153, 241–244. [CrossRef]
17. Belàk, S.; Kiss, I.; Viljoen, G.J. New developments in the diagnosis of avian influenza. Rev. Sci. Tech. 2009, 28, 233–243. [CrossRef]
18. Dopazo, C.P.; Bandín, I. Techniques of diagnosis of fish and shellfish virus and viral diseases. In Safety Analysis of Foods of Animal
Origin; Nollet, L., Toldra, F., Eds.; CRC Press: Boca Ratón, FL, USA, 2011; Chapter 18; pp. 531–576. ISBN 978-1-4398-4817-3.
19. Ries, R.; Beer, M.; Hoffmann, B. BlueTYPE—A low density TaqMan-RT-qPCR array for the identification of all 24 classical
Bluetongue virus serotypes. J. Virol. Meth. 2020, 282, 113881. [CrossRef]
20. Hasan, M.R.; Al Mana, H.; Young, V.; Tang, P.; Thomas, E.; Tan, R.; Tilley, P. A novel real-time PCR assay panel for detection of
common respiratory pathogens in a convenient, strip-tube array format. J. Virol. Meth. 2019, 265, 42–48. [CrossRef]
21. Venter, M.; Zaayman, D.; van Niekerk, S.; Stivaktas, V.; Goolab, S.; Weyer, J.; Paweska, J.T.; Swanepoel, R. Macroarray assay for
differential diagnosis of meningoencephalitis in southern Africa. J. Clin. Virol. 2014, 60, 50–56. [CrossRef]
22. Lievens, B.; Frans, I.; Heusdens, C.; Justé, A.; Jonstrup, S.P.; Lieffrig, F.; Willems, K.A. Rapid detection and identification of viral
and bacterial fish pathogens using a DNA array-based multiplex assay. J. Fish. Dis. 2011, 34, 861–875. [CrossRef] [PubMed]
23. Feng, J.; Wang, Y.; Jin, R.; Hao, G. A universal random DNA amplification and labeling strategy for microarray to detect multiple
pathogens of aquatic animals. J. Virol. Meth. 2020, 275, 113761. [CrossRef] [PubMed]
24. Lien, K.-Y.; Lee, S.-H.; Tsai, T.-J.; Chen, T.-Y.; Lee, G.-B. A microfluidic-based system using reverse transcription polymerase chain
reactions for rapid detection of aquaculture diseases. Microfluid. Nanofluid. 2009, 7, 795–806. [CrossRef]
25. Le Berre, M.; de Kinkelin, P.; Metzger, A. Identification serologique des Rhabdovirus des Salmonide´s. Bull. Off. Internat. Epizoot.
1977, 87, 391–393.
26. King, J.A.; Snow, M.; Smail, D.A.; Raynard, R.S. Distribution of viral haemorrhagic septicaemia virus in wild fish species of the
North Sea, north east Atlantic Ocean and Irish Sea. Dis. Aquat. Organ. 2001, 47, 81–86. [CrossRef]
27. Brunson, R.; True, K.; Yancey, J. VHS virus isolated at Makah national fish hatchery. Am. Fish. Soc. Fish. Health Newslett. 1989, 17, 3–4.
28. Groocock, G.H.; Getchell, R.G.; Wooster, G.A.; Britt, K.L.; Batts, W.N.; Winton, J.R.; Casey, R.N.; Casey, J.W.; Bowser, P.R. Detection
of viral hemorrhagic septicemia in round gobies in New York State (USA) waters of Lake Ontario and the St. Lawrence River. Dis.
Aquat. Organ. 2007, 76, 187–192. [CrossRef]
29. López-Vázquez, C.; Bandín, I.; Panzarin, V.; Toffan, A.; Cuenca, A.; Olesen, N.J.; Dopazo, C.P. Steps of the replication cycle of the
viral haemorrhagic septicaemia virus (VHSV) affecting its virulence on fish. Animals 2020, 10, 2264. [CrossRef]
30. Reed, L.J.; Muench, H. A simple method of estimating fifty per cent endpoints. Am. J. Epidemiol. 1938, 27, 493–497. [CrossRef]Animals 2021, 11, 841 16 of 16
31. Dopazo, C.P.; Bandín, I.; López-Vazquez, C.; Lamas, J.; Noya, M.; Barja, J.L. Isolation of viral hemorrhagic septicemia virus
from Greenland halibut Reinhardtius hippoglossoides caught in the Flemish Cap. Dis. Aquat. Organ. 2002, 50, 171–179. [CrossRef]
[PubMed]
32. Meyers, T.R. A Reo-like virus isolated from juvenile American oysters (Crassostrea virginica). J. Gen. Virol. 1979, 43, 203–212.
[CrossRef]
33. Miller, M.B.; Tang, Y.-W. Basic Concepts of Microarrays and Potential Applications in Clinical Microbiology. Clin. Microb. Rev.
2009, 22, 611–633. [CrossRef]
34. Kabir, M.S. Molecular methods for detection of pathogenic viruses of respiratory tract-A review. Asian Pac. J. Trop. Biomed.
2018, 8, 237–244. [CrossRef]
35. Tian, M.; Tian, Y.; Li, Y.; Lu, H.; Li, X.; Li, C.; Xue, F.; Jin, N. Microarray Multiplex Assay for the Simultaneous Detection and
Discrimination of Influenza A and Influenza B Viruses. Indian J. Microbiol. 2014, 54, 211–217. [CrossRef] [PubMed]
36. Tung, H.Y.; Chen, W.C.; Ou, B.R.; Yeh, J.Y.; Cheng, Y.H.; Tsng, P.H.; Hsu, M.H.; Tsai, M.S.; Liang, Y.C. Simultaneous detection of
multiple pathogens by multiplex PCR coupled with DNA biochip hybridization. Lab. Anim. 2018, 52, 186–195. [CrossRef]You can also read