Fusing Visual, Textual and Connectivity Clues for Studying Mental Health
←
→
Page content transcription
If your browser does not render page correctly, please read the page content below
Fusing Visual, Textual and Connectivity Clues for Studying Mental Health
                                                         Amir Hossein Yazdavar1 , Mohammad Saeid Mahdavinejad1 , Goonmeet Bajaj
                                                         2
                                                           , William Romine3 , Amirhassan Monadjemi1 , Krishnaprasad Thirunarayan
                                                                          1
                                                                            , Amit Sheth1 , and Jyotishman Pathak4
                                                  1
                                                      Department of Computer Science & Engineering, Wright State University, OH, USA
                                                                        2
                                                                          Ohio State University, Columbus, OH, USA
                                                            3
                                                              Department of Biological Science, Wright State University, OH, USA
                                                       4
                                                         Division of Health Informatics, Weill Cornell University, New York, NY, USA
                                                                                  1
                                                                                    yazdavar.2@wright.edu
                                                                  Abstract                       methods employing phone or online question-
                                                                                                  naires. These approaches suffer from under-
                                                  With ubiquity of social media platforms,        representation as well as sampling bias (with very
                                                  millions of people are sharing their on-        small group of respondents.) In contrast, the
                                                  line persona by expressing their thoughts,      widespread adoption of social media where peo-
arXiv:1902.06843v1 [cs.CY] 19 Feb 2019

                                                  moods, emotions, feelings, and even their       ple voluntarily and publicly express their thoughts,
                                                  daily struggles with mental health issues       moods, emotions, and feelings, and even share
                                                  voluntarily and publicly on social media.
                                                  Unlike the most existing efforts which study
                                                                                                  their daily struggles with mental health problems
                                                  depression by analyzing textual content, we     has not been adequately tapped into studying men-
                                                  examine and exploit multimodal big data to      tal illnesses, such as depression. The visual and
                                                  discern depressive behavior using a wide va-    textual content shared on different social media
                                                  riety of features including individual-level    platforms like Twitter offer new opportunities for a
                                                  demographics. By developing a multimodal        deeper understanding of self-expressed depression
                                                  framework and employing statistical tech-       both at an individual as well as community-level.
                                                  niques for fusing heterogeneous sets of fea-
                                                                                                  Previous research efforts have suggested that lan-
                                                  tures obtained by processing visual, tex-
                                                  tual and user interaction data, we signifi-     guage style, sentiment, users’ activities, and en-
                                                  cantly enhance the current state-of-the-art     gagement expressed in social media posts can pre-
                                                  approaches for identifying depressed indi-      dict the likelihood of depression (De Choudhury
                                                  viduals on Twitter (improving the average       et al., 2013b, 2016). However, except for a few
                                                  F1-Score by 5 percent) as well as facili-       attempts (Manikonda and De Choudhury, 2017;
                                                  tate demographic inference from social me-      Andalibi et al., 2017; Reece and Danforth, 2017;
                                                  dia for broader applications. Besides pro-      Ahsan et al., 2017), these investigations have sel-
                                                  viding insights into the relationship between
                                                  demographics and mental health, our re-
                                                                                                  dom studied extraction of emotional state from vi-
                                                  search assists in the design of a new breed     sual content of images in posted/profile images.
                                                  of demographic-aware health interventions.      Visual content can express users’ emotions more
                                                                                                  vividly, and psychologists noted that imagery is
                                                                                                  an effective medium for communicating difficult
                                         1       Introduction                                     emotions3 .
                                                                                                     According to eMarketer4 , photos accounted for
                                         Depression is a highly prevalent public health           75% of content posted on Facebook worldwide
                                         challenge and a major cause of disability world-         and they are the most engaging type of content
                                         wide. Depression affects 6.7% (i.e., about 16            on Facebook (87%). Indeed, "a picture is worth
                                         million) Americans each year 1 . According to            a thousand words" and now "photos are worth a
                                         the World Mental Health Survey conducted in 17           million likes." Similarly, on Twitter, the tweets
                                         countries, on average, about 5% of people reported       with image links get twice as much attention as
                                         having an episode of depression in 2011 (Marcus          those without 5 , and video-linked tweets drive
                                         et al., 2012). Untreated or under-treated clinical       up engagement 6 . The ease and naturalness of
                                         depression can lead to suicide and other chronic         expression through visual imagery can serve to
                                         risky behaviors such as drug or alcohol addiction2 .     glean depression-indicators in vulnerable individ-
                                            Global efforts to curb clinical depression in-
                                                                                                     3
                                         volve identifying depression through survey-based             https://bit.ly/2zpHQzw
                                                                                                     4
                                                                                                       https://bit.ly/2rHtyGI
                                             1                                                       5
                                                 http://bit.ly/2okBKNy                                 https://bit.ly/1u31GbO
                                             2                                                       6
                                                 https://wb.md/2pb4lm4                                 https://bit.ly/2rQbKHj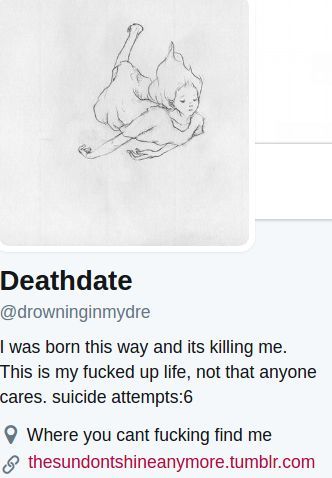
uals who often seek social support through social
media (Seabrook et al., 2016). Further, as psychol-
ogist Carl Rogers highlights, we often pursue and
promote our Ideal-Self 7 . In this regard, the choice
of profile image can be a proxy for the online per-
sona (Liu et al., 2016), providing a window into
an individual’s mental health status. For instance,
choosing emaciated legs of girls covered with sev-      Figure 1: Self-disclosure on Twitter from likely de-
                                                        pressed users discovered by matching depressive-
eral cuts as profile image portrays negative self-
                                                        indicative terms
view (Montesano et al., 2017).
                                                        works, specifically for image analysis task, can
   Inferring demographic information like gender
                                                        lead to determining demographic features such as
and age can be crucial for stratifying our un-
                                                        age and gender (Levi and Hassner, 2015). We
derstanding of population-level epidemiology of
                                                        show that by determining and integrating hetero-
mental health disorders. Relying on electronic
                                                        geneous set of features from different modalities
health records data, previous studies explored gen-
                                                        – aesthetic features from posted images (colorful-
der differences in depressive behavior from differ-
                                                        ness, hue variance, sharpness, brightness, blurri-
ent angles including prevalence, age at onset, co-
                                                        ness, naturalness), choice of profile picture (for
morbidities, as well as biological and psychoso-
                                                        gender, age, and facial expression), the screen
cial factors8 . For instance, women have been di-
                                                        name, the language features from both textual
agnosed with depression twice as often as men
                                                        content and profile’s description (n-gram, emo-
(Nolen-Hoeksema, 1987) and national psychiatric
                                                        tion, sentiment), and finally sociability from ego-
morbidity survey in Britain has shown higher risk
                                                        network, and user engagement – we can reliably
of depression in women (McManus et al., 2016).
                                                        detect likely depressed individuals in a data set of
On the other hand, suicide rates for men are three
                                                        8,770 human-annotated Twitter users.
to five times higher compared to that of the women
(Angst et al., 2002).                                      We address and derive answers to the following
                                                        research questions: 1) How well do the content of
   Although depression can affect anyone at any
                                                        posted images (colors, aesthetic and facial presen-
age9 , signs and triggers of depression vary for dif-
                                                        tation) reflect depressive behavior? 2) Does the
ferent age groups 10 . Depression triggers for chil-
                                                        choice of profile picture show any psychological
dren include parental depression, domestic vio-
                                                        traits of depressed online persona? Are they re-
lence, and loss of a pet, friend or family member.
                                                        liable enough to represent the demographic infor-
For teenagers (ages 12-18), depression may arise
                                                        mation such as age and gender? 3) Are there any
from hormonal imbalance, sexuality concerns and
                                                        underlying common themes among depressed in-
rejection by peers11 . Young adults (ages 19-29)
                                                        dividuals generated using multimodal content that
may develop depression due to life transitions,
                                                        can be used to detect depression reliably?
poverty, trauma, and work issues. Adult (ages 30-
60) depression triggers include caring simultane-
ously for children and aging parents, financial bur-
                                                        2   Related Work
den, work and relationship issues. Senior adults        Mental Health Analysis using Social Media:
develop depression from common late-life issues,        Several efforts have attempted to automatically de-
social isolation, major life loses such as the death    tect depression from social media content utilizing
of a spouse, financial stress and other chronic         machine/deep learning and natural language pro-
health problems (e.g., cardiac disease, demen-          cessing approaches. Conducting a retrospective
tia)12 . Therefore, inferring demographic informa-      study over tweets, (De Choudhury et al., 2013a)
tion while studying depressive behavior from pas-       characterizes depression based on factors such as
sively sensed social data, can shed better light on     language, emotion, style, ego-network, and user
the population-level epidemiology of depression.        engagement. They built a classifier to predict the
   The recent advancements in deep neural net-          likelihood of depression in a post (De Choudhury
   7
                                                        et al., 2013a; Shuai et al., 2016) or in an individ-
     http://bit.ly/2hLnmqn                              ual (De Choudhury et al., 2013b; Nguyen et al.,
   8
     https://bit.ly/2P4kWs9
   9
     https://bit.ly/2JJeBia
                                                        2014b; Yazdavar et al., 2016; Bajaj et al., 2017).
  10
     https://bit.ly/2Rlyzzg                             Moreover, there have been significant advances
  11
     https://bit.ly/2qw2MRm                             due to the shared task (Coppersmith et al., 2015)
  12
     https://wb.md/2D4jNJW                              focusing on methods for identifying depressed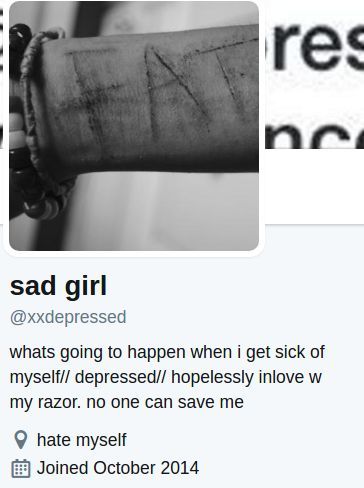
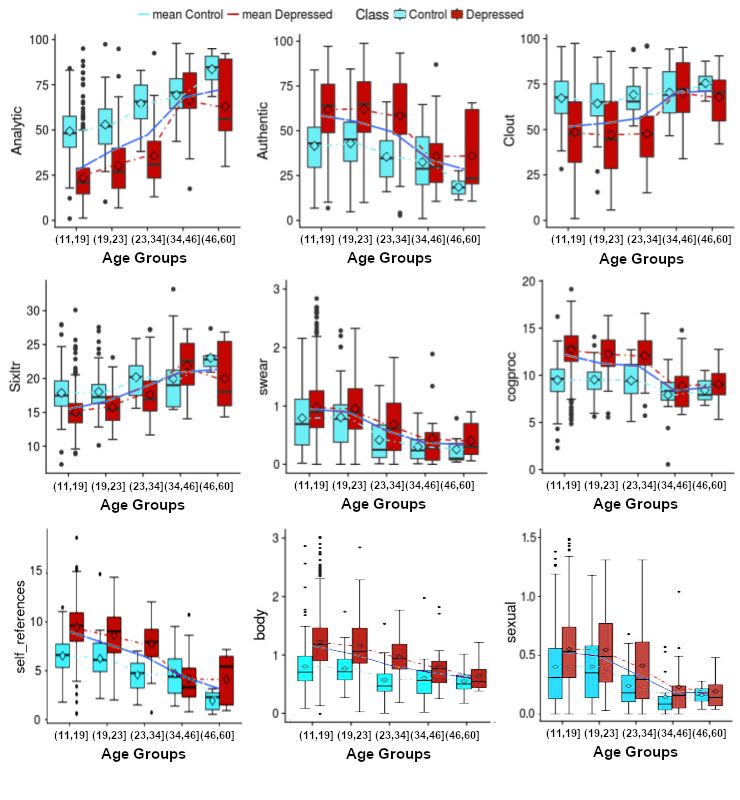
users on Twitter at the Computational Linguistics       to improve upon the prior works involving use of
and Clinical Psychology Workshop (CLP 2015).            images in multimodal depression analysis (Shen
A corpus of nearly 1,800 Twitter users was built        et al., 2017) and prior works on studying Insta-
for evaluation, and the best models employed topic      gram photos (Ahsan et al., 2017; Andalibi et al.,
modeling (Resnik et al., 2015), Linguistic Inquiry      2016).
and Word Count (LIWC) features, and other meta-
data (Preotiuc-Pietro et al., 2015). More recently,     Demographic information inference on Social
a neural network architecture introduced by (Yates      Media: There is a growing interest in understand-
et al., 2017) combined posts into a representation      ing online user’s demographic information due
of user’s activities for detecting depressed users.     to its numerous applications in healthcare (Mis-
Another active line of research has focused on cap-     love et al., 2011; Lerman et al., 2016). A super-
turing suicide and self-harm signals (Coppersmith       vised model developed by (Burger et al., 2011) for
et al., 2018; Thompson et al., 2014; De Choudhury       determining users’ gender by employing features
and Kıcıman, 2017; Wang et al., 2017; De Choud-         such as screen-name, full-name, profile descrip-
hury et al., 2016; Coppersmith et al., 2016). More-     tion and content on external resources (e.g., per-
over, the CLP 2016 (Milne et al., 2016) defined a       sonal blog). Employing features including emoti-
shared task on detecting the severity of the men-       cons, acronyms, slangs, punctuations, capitaliza-
tal health from forum posts. All of these stud-         tion, sentence length and included links/images,
ies derive discriminative features to classify de-      along with online behaviors such as number of
pression in user-generated content at message-          friends, post time, and commenting activity, a
level, individual-level or community-level. Re-         supervised model was built for predicting user’s
cent emergence of photo-sharing platforms such          age group (Rosenthal and McKeown, 2011). Uti-
as Instagram, has attracted researchers attention       lizing users life stage information such as sec-
to study people’s behavior from their visual narra-     ondary school student, college student, and em-
tives – ranging from mining their emotions (Wang        ployee, (Nguyen et al., 2013) builds age inference
et al., 2015b), and happiness trend (Abdullah et al.,   model for Dutch Twitter users. Similarly, rely-
2015), to studying medical concerns (Garimella          ing on profile descriptions while devising a set
et al., 2016). Researchers show that people use         of rules and patterns, a novel model introduced
Instagram to engage in social exchange and sto-         for extracting age for Twitter users (Sloan et al.,
rytelling about their difficult experiences (Andal-     2015). They also parse description for occupa-
ibi et al., 2017). The role of visual imagery as a      tion by consulting the SOC2010 list of occupa-
mechanism of self-disclosure by relating visual at-     tions13 and validating it through social surveys. A
tributes to mental health disclosures on Instagram      novel age inference model was developed while
was highlighted by (Manikonda and De Choud-             relying on homophily interaction information and
hury, 2017; Reece and Danforth, 2017) where in-         content for predicting age of Twitter users (Zhang
dividual Instagram profiles were utilized to build      et al., 2016). The limitations of textual content
a prediction framework for identifying markers          for predicting age and gender was highlighted by
of depression. The importance of data modal-            (Nguyen et al., 2014a). They distinguish language
ity to understand user behavior on social media         use based on social gender, age identity, biologi-
was highlighted by (Duong et al., 2017). More           cal sex and chronological age by collecting crowd-
recently, a deep neural network sequence mod-           sourced signals using a game in which players
eling approach that marries audio and text data         (crowd) guess the biological sex and age of a user
modalities to analyze question-answer style inter-      based only on their tweets. Their findings indicate
views between an individual and an agent has been       how linguistic markers can misguide (e.g., a heart
developed to study mental health (Duong et al.,         represented as
3 Dataset depressed class versus 19 for control class sug-
gesting either likely depressed-user population is
Self-disclosure clues have been extensively uti- younger, or depressed youngsters are more likely
lized for creating ground-truth data for numerous to disclose their age for connecting to their peers
social media analytic studies e.g., for predicting (social homophily.) (Al Zamal et al., 2012)
demographics (Mislove et al., 2011; Sloan et al.,
2015), and user’s depressive behavior (Yazdavar
et al., 2017; De Choudhury et al., 2017; Yazdavar
et al., 2018). For instance, vulnerable individuals
may employ depressive-indicative terms in their
Twitter profile descriptions. Others may share
their age and gender, e.g., "16 years old suicidal
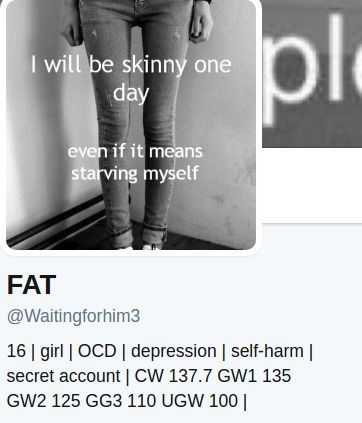
girl"(see Figure 1). We employ a huge dataset
of 45,000 self-reported depressed users introduced
in (Yazdavar et al., 2017) where a lexicon of de-
pression symptoms consisting of 1500 depression- Figure 2: The age distribution for depressed and con-
indicative terms was created with the help of psy- trol users in ground-truth dataset
chologist clinician and employed for collecting Gender Enabled Ground-truth Dataset: We se-
self-declared depressed individual’s profiles. A lected a subset of 1464 users Ug from Ut who
subset of 8,770 users (24 million time-stamped disclose their gender in their profile description.
tweets) containing 3981 depressed and 4789 con- From 1464 users 64% belonged to the depressed
trol users (that do not show any depressive be- group, and the rest (36%) to the control group.
havior) were verified by two human judges (Yaz- 23% of the likely depressed users disclose their
davar et al., 2017). This dataset Ut contains the gender which is considerably higher (12%) than
metadata 14 values of each user such as profile de- that for the control class. Once again, gender dis-
scriptions, followers_count, created_at, and pro- closure varies among the two gender groups. For
file_image_url. statistical significance, we performed chi-square
Age Enabled Ground-truth Dataset: We ex- test (null hypothesis: gender and depression are
tract user’s age by applying regular expression pat- two independent variables). Figure 3 illustrates
terns to profile descriptions (such as "17 years gender association with each of the two classes.
old, self-harm, anxiety, depression") (Sloan et al., Blue circles (positive residuals, see Figure 3-A,D)
2015). We compile "age prefixes" and "age suf- show positive association among corresponding
fixes", and use three age-extraction rules: 1. I row and column variables while red circles (nega-
am X years old 2. Born in X 3. X years old, tive residuals, see Figure 3-B,C) imply a repulsion.
where X is a "date" or age (e.g., 1994). We se- Our findings are consistent with the medical lit-
lected a subset of 1061 users among Ut as gold erature (Nolen-Hoeksema, 1987) as according to
standard dataset Ua who disclose their age. From (Ford et al., 2002) more women than men were
these 1061 users, 822 belong to depressed class given a diagnosis of depression. In particular, the
and 239 belong to control class. From 3981 de- female-to-male ratio is 2.1 and 1.9 for Major De-
pressed users, 20.6% disclose their age in contrast pressive Disorder and Dysthymic Disorder respec-
with only 4% (239/4789) among control group. tively. Our findings from Twitter data indicate
So self-disclosure of age is more prevalent among there is a strong association (Chi-square: 32.75, p-
vulnerable users. Figure 2 depicts the age distribu- value:1.04e-08) between being female and show-
tion in Ua . The general trend, consistent with the ing depressive behavior on Twitter.
results in (Zhang et al., 2016; Liao et al., 2014),
is biased toward young people. Indeed, accord- 4 Data Modality Analysis
ing to Pew, 47% of Twitter users are younger than
30 years old (Duggan et al., 2015). Similar data We now provide an in-depth analysis of visual and
collection procedure with comparable distribution textual content of vulnerable users.
have been used in many prior efforts (Al Zamal Visual Content Analysis: We show that the vi-
et al., 2012; Liao et al., 2014; Zhang et al., 2016). sual content in images from posts as well as
We discuss our approach to mitigate the impact of profiles provide valuable psychological cues for
the bias in Section 4.1. The median age is 17 for understanding a user’s depression status. Pro-
file/posted images can surface self-stigmatization
14
https://bit.ly/2Wgsgke (Barney et al., 2006). Additionally, as opposed
Female             Male
                                                                 Table 2: Statistics of Processed Shared/Profile Images
                                                                  # of Proc. Prof. Images   # of Proc. Shared Images
                       A               B                          Depressed       Control   Depressed       Control
                                                                     3466           4127     265785         401435

           Depressed                                             tain multiple faces, we measure the average emo-
                                                                 tion. Figure 4 illustrates the inter-correlation of
                       C               D                         these features. Additionally, we observe that emo-
                                                                 tions gleaned from facial expressions correlated
                                                                 with emotional signals captured from textual con-
                                                                 tent utilizing LIWC. This indicates visual imagery
                                                                 can be harnessed as a complementary channel for
Figure 3: Gender and Depressive Behavior Association             measuring online emotional signals.
(Chi-square test: color-code: (blue:association), (red:          General Image Features: The importance of
repulsion), size: amount of each cell’s contribution)            interpretable computational aesthetic features for
Table 1: Facial Presence Comparison in Profile/Posted            studying users’ online behavior has been high-
images for Depressed and Control Users
          Face_Found_in           % Of Users            χ2
                                                                 lighted by several efforts (Datta et al., 2006; Liu
            Media
                             Depressed
                               72%
                                          Control
                                            81%      163.52***
                                                                 et al., 2016; Celli et al., 2014). Color, as a pillar
            Profile            4%           12%      167.2***    of the human vision system, has a strong associa-
           Not_found           8%            7%         2.55
to typical computer vision framework for object                  tion with conceptual ideas like emotion (NAz and
recognition that often relies on thousands of pre-               Epps, 2004; Huang et al., 2006)17 . We measured
determined low-level features, what matters more                 the normalized red, green, blue and the mean of
for assessing user’s online behavior is the emo-                 original colors, and brightness and contrast rel-
tions reflected in facial expressions (Pantic, 2009),            ative to variations of luminance. We represent
attributes contributing to the computational aes-                images in Hue-Saturation-Value color space that
thetics (Datta et al., 2006), and sentimental quotes             seems intuitive for humans, and measure mean and
they may subscribe to (Figure 1) (Liu et al., 2016).             variance for saturation and hue. Saturation is de-
Facial Presence: For capturing facial presence,                  fined as the difference in the intensities of the dif-
we rely on (Zhou et al., 2013)’s approach that                   ferent light wavelengths that compose the color.
uses multilevel convolutional coarse-to-fine net-                Although hue is not interpretable, high saturation
work cascade to tackle facial landmark localiza-                 indicates vividness and chromatic purity which
tion. We identify facial presentation, emotion                   are more appealing to the human eye (Liu et al.,
from facial expression, and demographic features                 2016). Colorfulness is measured as a difference
from profile/posted images 15 . Table 1 illustrates              against gray background (San Pedro and Siersdor-
facial presentation differences in both profile and              fer, 2009). Naturalness is a measure of the de-
posted images (media) for depressed and control                  gree of correspondence between images and the
users in Ut . With control class showing signifi-                human perception of reality (San Pedro and Siers-
cantly higher in both profile and media (8%, 9%                  dorfer, 2009). In color reproduction, naturalness
respectively) compared to that for the depressed                 is measured from the mental recollection of the
class. In contrast with age and gender disclosure,               colors of familiar objects. Additionally, there is
vulnerable users are less likely to disclose their fa-           a tendency among vulnerable users to share senti-
cial identity, possibly due to lack of confidence or             mental quotes bearing negative emotions. We per-
fear of stigma.                                                  formed optical character recognition (OCR) with
Facial Expression: Following (Liu et al., 2016)’s                python-tesseract 18 to extract text and their senti-
approach, we adopt Ekman’s model 16 of six emo-                  ment score. As illustrated in Table 3, vulnerable
tions: anger, disgust, fear, joy, sadness and sur-               users tend to use less colorful (higher grayscale)
prise, and use the Face++ API to automatically                   profile as well as shared images to convey their
capture them from the shared images. Positive                    negative feelings, and share images that are less
emotions are joy and surprise, and negative emo-                 natural (Figure 1). With respect to the aesthetic
tions are anger, disgust, fear, and sadness. In                  quality of images (saturation, brightness, and hue),
general, for each user u in Ut , we process pro-                 depressed users use images that are less appeal-
file/shared images for both the depressed and the                ing to the human eye. We employ independent
control groups with at least one face from the                   t-test, while adopting Bonferroni Correction as a
shared images (Table 2). For the photos that con-                conservative approach to adjust the confidence in-
  15                                                               17
       https://www.faceplusplus.com/                                    https://bit.ly/2DALcTq
  16                                                               18
       https://bit.ly/2TcNuO5                                           https://pypi.org/project/pytesseract/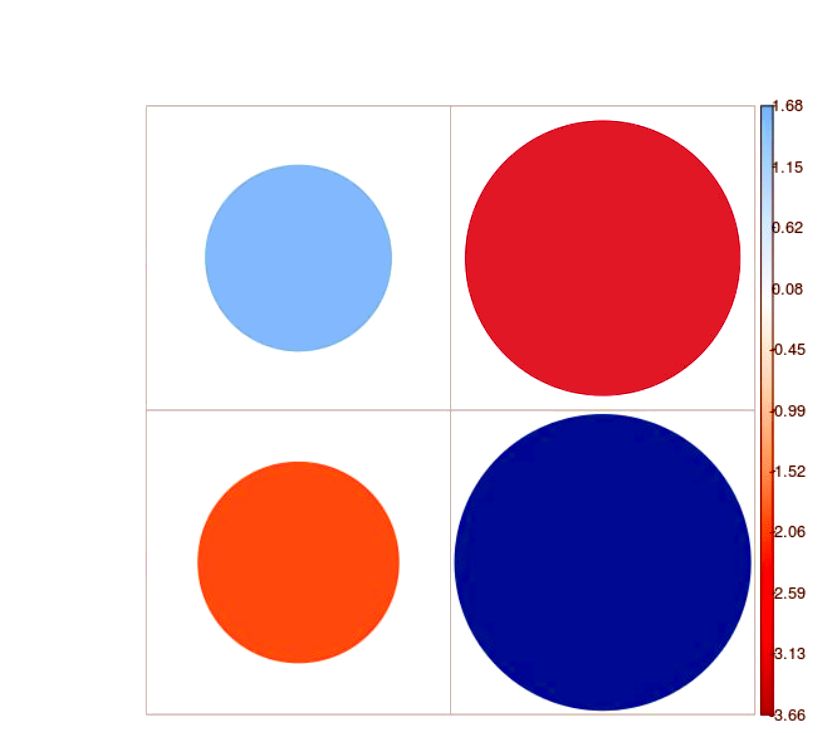
Table 3: Statistical significance (t-statistic) of the mean                           terms of language variables such as analytical
of salient features for depressed and control classes 20                              thinking, clout, authenticity, and emotional tone.
                                                          95 per.
                                     Depressed Control
                    Feature
                                       (µ)      (µ)
                                                          Conf.
                                                         interval
                                                                           T-stat     It also measures other linguistic dimensions such
                Prof._colorfulness   108       118.8     (-15.38, -6.22)   -4.6***    as descriptors categories (e.g., percent of target
                Prof._avgRGB         134.1     139       ( 2.3 6.92)       -3.92***
                Prof._naturalness    0.3       0.6       (-0.30, -0.19)    -12.7***   words gleaned by dictionary, or longer than six let-
                Prof._hueVAR         0.05      0.07      (-0.02, -0.008)   -4.6***
                Prof._Satu.VAR       0.03      0.04      (-0.01, -0.003)   -3.9***    ters - Sixltr) and informal language markers (e.g.,
                Prof._Satu.Mean      0.2       0.31      (-0.12, -0.07)    -8.9***
 Image-based
                Sha._BlueCh.Mean     119.5     134       (-9.82, -19.28)   -6***
                                                                                      swear words, netspeak), and other linguistic as-
                Sha._GraySc.Mean
                Sha._Colorfuln.
                                     0.5
                                     106.1
                                               0.49
                                               122
                                                         (0.03, 0.06)
                                                         (-14.9, -10.7)
                                                                           5.4***
                                                                           -11.9***
                                                                                      pects (e.g., 1st person singular pronouns.)
                Sha._Satu.VAR
                Sha._Satu.Mean
                                     0.03
                                     0.1
                                               0.04
                                               0.28
                                                         (-0.01, -0.01)
                                                         (-0.10, -0.07)
                                                                           -9.2***
                                                                           -10.9***
                                                                                      Thinking Style: Measuring people’s natural ways
                Sha._Naturalness     0.4       0.65      (-0.19, -0.13)    -16.2***   of trying to analyze, and organize complex events
                Friend._cnt          610.1     1380      (-1023, -516)     -5.9***
                Followers_cnt        589.4     1340      (-1148, -354)     -3.72**    have strong association with analytical thinking.
                Stat._cnt            3722      7766      (-6281, -1806)    -3.55**
 Social-based
                Avg_fav._cnt         0.2       0.67      (-0.78, -0.103)   -2.57      LIWC relates higher analytic thinking to more for-
                Avg_retw._cnt        876.7     2720      (-2673, -1013)    -4.3***
                Favourites_cnt       2021      5199      (-5038, -1317)    -3.3**     mal and logical reasoning whereas a lower value
tervals. Overall, we have 223 features, and choose                                    indicates focus on narratives. Also, cognitive pro-
Bonferroni-corrected alpha level of 0.05/223 =                                        cessing measures problem solving in mind. Words
2.24e − 4 (*** p < alpha, **p < 0.05).                                                such as "think," "realize," and "know" indicates
Demographics Inference & Language Cues:                                               the degree of "certainty" in communications. Crit-
LIWC21 has been used extensively for examining                                        ical thinking ability relates to education (Berger,
the latent dimensions of self-expression for ana-                                     1984), and is impacted by different stages of cog-
lyzing personality (Schwartz et al., 2013), depres-                                   nitive development at different ages 25 . It has
sive behavior, demographic differences (Nguyen                                        been shown that older people communicate with
et al., 2014a, 2013), etc. Several studies high-                                      greater cognitive complexity while comprehend-
light that females employ more first-person sin-                                      ing nuances and subtle differences (Chung and
gular pronouns (Chung and Pennebaker, 2007),                                          Pennebaker, 2007). We observe a similar pat-
and deictic language22 (Mukherjee and Liu, 2010),                                     tern in our data (Table 4.) A recent study high-
while males tend to use more articles (Argamon                                        lights how depression affects brain and thinking
et al., 2007) which characterizes concrete think-                                     at molecular level using a rat model (Calabrese
ing, and formal, informational and affirmation                                        et al., 2017). Depression can promote cognitive
words (Newman et al., 2008). For age analy-                                           dysfunction including difficulty in concentrating
sis, the salient findings include older individuals                                   and making decisions. We observed a notable dif-
using more future tense verbs (Chung and Pen-                                         ferences in the ability to think analytically in de-
nebaker, 2007) triggering a shift in focus while                                      pressed and control users in different age groups
aging. They also show positive emotions (Pen-                                         (see Figure 5- A, F and Table 4). Overall, vulner-
nebaker and Stone, 2003) and employ fewer self-                                       able younger users are not logical thinkers based
references (i.e. ’I’, ’me’) with greater first per-                                   on their relative analytical score and cognitive pro-
son plural (Chung and Pennebaker, 2007). De-                                          cessing ability.
pressed users employ first person pronouns more                                       Authenticity: Authenticity measures the degree
frequently (Rude et al., 2004), repeatedly use neg-                                   of honesty. Authenticity is often assessed by mea-
ative emotions and anger words. We analyzed psy-                                      suring present tense verbs, 1st person singular pro-
cholinguistic cues and language style to study the                                    nouns (I, me, my), and by examining the linguis-
association between depressive behavior as well                                       tic manifestations of false stories (Newman et al.,
as demographics. Particularly, we adopt Levin-                                        2003). Liars use fewer self-references and fewer
son’s adult development grouping 23 that partitions                                   complex words. Psychologists often see a child’s
users in Ua into 5 age groups: (14,19],(19,23],                                       first successfull lie as a mental growth26 . There
(23,34],(34,46], and (46,60]. Then, we apply                                          is a decreasing trend of the Authenticity with ag-
LIWC for characterizing linguistic styles for each                                    ing (see Figure 5-B.) Authenticity for depressed
age group for users in Ua .                                                           youngsters is strikingly higher than their control
   Qualitative Language Analysis: The recent                                          peers. It decreases with age (Figure 5-B.)
LIWC version 24 summarizes textual content in                                         Clout: People with high clout speak more con-
                                                                                      fidently and with certainty, employing more so-
  20
     ** alpha= 0.05, *** alpha = 0.05/223                                             cial words with fewer negations (e.g., no, not)
  21
     http://liwc.wpengine.com/                                                        and swear words. In general, midlife is relatively
  22
     deictic: context-dependent words
  23                                                                                    25
     https://bit.ly/2EuxUG8                                                                  https://bit.ly/2znp77G
  24                                                                                    26
     https://bit.ly/2PD8eQB                                                                  https://nyti.ms/2JDZlR7
(a) (b) Figure 4: The Pearson correlation between the average emotions derived from facial expressions through the shared images and emotions from textual content for depressed-(a) and control users-(b). Pairs without statistically significant correlation are crossed (p-value
Table 4: Statistical Significance Test of Linguistic Pat- (19,23]. The average accuracy of this model is
terns/Visual Attributes for Different Age Groups with 0.63 for depressed users and 0.64 for control class.
one-way ANOVA 31
Mean
Table 7 illustrates the performance of gender pre-
Feature (SD) F-value diction for each class. The average accuracy is
[11,19) [19,23) [23,34) [34,46) [46,60)
84*** 0.82 on Ug ground-truth dataset.
27.62 38.61 47.28 67.88 72.05
Analytic
(16.62) (19.16) (20.69) (18.51) (20.79)
22*** Prediction with Visual Imagery: Inspired by
58.54 55.04 49.21 33.99 28.39
Authentic
(19.54) (20.04) (22.05) (19.73) (19.04)
Text-based
Clout
51.6 53.43 56.27 70.28 71.21
9***
(Zhou et al., 2013)’s approach for facial landmark
(21.35) (21.26) (19.81) (17.46) (13.50)
Dic
85.04 82.63 80.48 75.87 74.09
37***
localization, we use their pretrained CNN con-
(6.06) (6.21) (6.56) (6.91) (5.95)
3.52 3.92 4.00 4.52 5.13 sisting of convolutional layers, including unshared
Article 35***
(0.78) (0.73) (0.80) (1.38) (1.00)
15.48 16.58 18.65 20.88 21.33
and fully-connected layers, to predict gender and
Sixltr 52***
(2.84) (3.07) (3.71) (4.74) (4.11)
12.17 11.24 10.99 8.36 8.75
age from both the profile and shared images. We
Cogn. words 28***
(2.53) (2.38) (2.55) (2.63) (1.96) evaluate the performance for gender and age pre-
14.13 12.45 10.96 9.05 7.55
Self-ref
(2.35) (2.56) (2.60) (3.69) (3.38)
85***
diction task on Ug and Ua respectively as shown
0.96 0.89 0.57 0.36 0.33
Swear 18*** in Table 5 and Table 7.
(0.59) (0.53) (0.48) (0.41) (0.30)
0.27 0.38 0.45 0.52 0.78
Money 15*** Demographic Prediction Analysis: We delve
(0.40) (0.19) (0.25) (0.22) (0.37)
0.80 1.09 1.31 1.67 2.02
Work 69*** deeper into the benefits and drawbacks of each
(0.39) (0.53) (0.76) (0.83) (1.01)
10*** data modality for demographic information pre-
37.80 48.05 52.33 64.33 68.07
Prof._natu.
(13.84) (18.64) (28.51) (24.53) (15.28)
9*** diction. This is crucial as the differences between
20.31 23.27 29.78 38.76 33.13
Image-based Prof._Satu.Mean
(1.95) (1.99) (1.99) (2.14) (1.94)
Prof._Colorful.
106.47 107.95 111.01 113.97 123.60
0.89
language cues between age groups above age 35
(42.70) (39.15) (42.09) (35.48) (27.60)
Shared_avgRGB
139.20 140.45 131.55 133.74 139.02
3**
tend to become smaller (see Figure 5-A,B,C) and
(18.12) (16.00) (16.32) (22.41) (22.30)
Prof._GrayMean
0.471 0.474 0.456 0.470 0.450
0.12
making the prediction harder for older people
(0.19) (0.16) (0.21) (0.14) (0.11)
(Eckert, 2017). In this case, the other data modal-
4 illustrates our findings, with a degree of freedom
ity (e.g., visual content) can play integral role as a
(df) of 1055. The null hypothesis is that the sam-
complementary source for age inference. For gen-
ple means’ for each age group are similar for each
der prediction (see Table 7), on average, the pro-
of the LIWC features.
file image-based predictor provides a more accu-
4.1 Demographic Prediction rate prediction for both the depressed and control
class (0.92 and 0.90) compared to content-based
We leverage both the visual and textual content for
predictor (0.82). For age prediction (see Table 5),
predicting age and gender.
textual content-based predictor (on average 0.60)
Prediction with Textual Content: We employ
outperforms both of the visual-based predictors
(Sap et al., 2014)’s weighted lexicon of terms
(on average profile:0.51, Media:0.53). However,
that uses the dataset of 75,394 Facebook users
not every user provides facial identity on his ac-
who shared their status, age and gender. The
count (see Table 1). We studied facial presentation
predictive power of this lexica was evaluated on
for each age-group to examine any association be-
Twitter, blog, and Facebook, showing promis-
tween age-group, facial presentation and depres-
ing results (Sap et al., 2014). Utilizing these
sive behavior (see Table 6). We can see youngsters
two weighted lexicon of terms, we are predicting
in both depressed and control class are not likely
the demographic information (age or gender) of
to present their face on profile image. Less than
useri (denoted byP Demoi ) using following equa-
3% of vulnerable users between 11-19 years reveal
tion: Demoi = termslex W eightlex (term) ∗ their facial identity. Although content-based gen-
F req(term,doc)i
W C(doc)i der predictor was not as accurate as image-based
where W eightlex (term) is the lexicon weight one, it is adequate for population-level analysis.
of the term, and F req(term, doc)i represents
the frequency of the term in the user generated 5 Multi-modal Prediction Framework
doci , and W C(doc)i measures total word count
We use the above findings for predicting depres-
in (doc)i . As our data is biased toward young peo-
sive behavior. Our model exploits early fusion
ple, we report age prediction performance for each
(Duong et al., 2017) technique in feature space
age group separately (Table 5). Moreover, to mea-
and requires modeling each user u in Ut as vec-
sure the average accuracy of this model, we build
tor concatenation of individual modality features.
a balanced dataset (keeping all the users above 23
As opposed to computationally expensive late fu-
-416 users), and then randomly sampling the same
sion scheme where each modality requires a sep-
number of users from the age ranges (11,19] and
arate supervised modeling, this model reduces
31
*** alpha = 0.001, ** alpha = 0.01, * alpha = 0.05 the learning effort and shows promising resultsTable 5: Age Prediction Performance from Visual and Textual Content for Different Age Group(in Years Old)
Image-based Image-based
Text-based
Group Measure (Profile) (Media)
(11,19] (19,23] (23,34] (34,46] (11,19] (19,23] (23,34] (34,46] (11,19] (19,23] (23,34] (34,46]
Sensitivity 0.23 0.38 0.65 0.33 0.29 0.29 0.22 1.0 0.11 0.1 0.19 0.22
Depressed Specificity 0.95 0.53 0.69 0.96 0.92 0.92 0.57 0.80 0.96 0.94 0.72 0.58
ACC 0.59 0.46 0.67 0.65 0.47 0.46 0.40 0.900 0.50 0.49 0.46 0.40
Sensitivity 0.14 0.31 0.62 0.69 0.12 0.1 0.40 0.25 0.15 0.30 0.63 0.64
Control Specificity 0.98 0.63 0.61 0.90 0.90 0.95 0.53 0.75 0.98 0.62 0.60 0.91
ACC 0.56 0.47 0.62 0.80 0.49 0.48 0.47 0.51 0.56 0.46 0.62 0.77
Table 6: Facial Presentation Distribution for Different Age Group(in Years Old) in Profile and Media
% Users Faces_Found_ in_Profile % Users Faces_Found_ in_Media
[11,19) [19,23) [23,34) [34,46) [46,60) [11,19) [19,23) [23,34) [34,46) [46,60)
Control 4.55 9.58 13.84 17.85 21.42 89.70 88.35 78.46 67.85 78.57
Depressed 2.71 5.88 10.52 8.33 14.28 90.21 90.58 76.31 83.33 85.71
(Snoek et al., 2005). To develop a generalizable Algorithm 1: Ensemble Feature Selection
model that avoids overfitting, we perform feature Function Main
selection using statistical tests and all relevant en- for each Feature Xj ∈ X do
ShadowF eatures ← RndP erm(Xj )
semble learning models. It adds randomness to RndForrest(ShadowF eatures, X);
Calculate Imp (Xj , M axImp(ShadowF eatures));
the data by creating shuffled copies of all features if Imp(Xj ) > M axImp(ShadowF eatures) then
(shadow feature), and then trains Random For- Generate next hypothesis , return Xj
est classifier on the extended data. Iteratively, it Once all hypothesis generated;
Perform Statistical Test H0 : Hi = E(H)vsH1 : Hi 6=
√
checks whether the actual feature has a higher Z- E(H) Hi ∼ N ((0.5N )(( 0.25N )2 )) //Binomial
Distribution;
score than its shadow feature (See Algorithm 1 and if Hi
E(H) then
Figure 6) (Kursa et al., 2010). Feature is important
else
Feature is important
Pn 0
L = i=1 l(yi , yi + ft (ui )) + ϕ(ft )
where ϕ incorporates L1 and L2 regulariza-
tion. In each iteration, the new ft (ui ) is
obtained by fitting weak learner to the neg-
ative gradient of loss function. Particularly,
by estimating the loss function with Taylor ex-
Pn 0
pansion 32 : L ∼ i=1 l(yi , yi ) +
0 0
∂l(yi ,yi ∂ 2 l(yi ,yi
( 0 )ft (u) + ( 0 2 )ft (ui )2
∂yi ∂yi
where its first expression is constant, the second
and the third expressions are first (gi ) and second
order derivatives (hi ) of the loss.
Xn
L = (gi ft (ui ) + hi ft (ui )) + ϕ(ft )
i=1
For exploring the weak learners, assume ft has
k leaf nodes, Ij be subset of users from Ut be-
longs to the node j, and wj denotes the prediction
for node j. Then, for each user i belonging to Ij ,
ft (ui ) = wj and ϕ(ft ) = 1/2λ kj=1 Wj2 + γk
P
Xk X X
L = [( gi )wj +1/2( hi +λ)wj2 )]+γk
j=1 iIj iIj
Figure 6: Ranking Features obtained from Different Next, for each leaf node j,
Pderiving w.r.t wj :
Modalities with an Ensemble Algorithm − iIi gi
wj = P
Next, we adopt an ensemble learning method iIj hi + λ
that integrates the predictive power of multiple and by substituting weights:
k ( iIj gi )2
P
learners with two main advantages; its inter-
X
pretability with respect to the contributions of each L = −1/2 P + γk
iIj hi + λ j=1
feature and its highPpredictive power. For predic-
which represents the loss for fixed weak learners
tion we have yi0 = m t=1 ft (ui ) where ft is a weak with k nodes. The trees are built sequentially such
learner and yi0 denotes the final prediction.
32
In particular, we optimize the loss function: https://bit.ly/2Ga1c0wTable 7: Gender Prediction Performance through Visual and Textual Content
Agreement Image-based Predictor Content-based Predictor
Face found
Depressed Control Depressed Control Depressed Control
in
Cohen’s Cohen’s
pct. pct. Sens. Spec. ACC (95% CI) Sens. Spec. ACC (95% CI) Sens. Spec. ACC (95% CI) Sens. Spec. ACC (95% CI)
kappa kappa
Profile 0.92 0.90
0.32*** 73.9 0.31*** 70.3 0.90 1.0 0.91 0.87
(0.80, 0.98) (0.81, 0.95)
0.82 0.82
Media 0.584 0.51 0.87 0.50 0.86 0.76
0.1* 53.4 0.09*** 52.3 0.57 0.70 0.46 0.65 (0.79, 0.85) (0.79, 0.85)
(0.546, 0.62) (0.4634, 0.5595)
that each subsequent tree aims to reduce the er-
rors of its predecessor tree. Although, the weak
learners have high bias, the ensemble model pro-
duces a strong learner that effectively integrate
the weak learners by reducing bias and variance
(the ultimate goal of supervised models) (Chen
and Guestrin, 2016). Table 8 illustrates our mul-
timodal framework outperform the baselines for
identifying depressed users in terms of average
specificity, sensitivity, F-Measure, and accuracy
in 10-fold cross-validation setting on Ut dataset.
Figure 7 shows how the likelihood of being classi-
fied into the depressed class varies with each fea-
ture addition to the model for a sample user in the
dataset. The prediction bar (the black bar) shows
that the log-odds of prediction is 0.31, that is, the
likelihood of this person being a depressed user is
57% (1 / (1 + exp(-0.3))). The figure also sheds
light on the impact of each contributing feature.
The waterfall charts represent how the probabil-
ity of being depressed changes with the addition
of each feature variable. For instance, the "An-
alytic thinking" of this user is considered high
48.43 (Median:36.95, Mean: 40.18) and this de-
creases the chance of this person being classified
into the depressed group by the log-odds of -1.41. Figure 7: The explanation of the log-odds prediction of
Depressed users have significantly lower "Analytic outcome (0.31) for a sample user (y-axis shows the out-
thinking" score compared to control class. More- come probability (depressed or control), the bar labels
over, the 40.46 "Clout" score is a low value (Me- indicate the log-odds impact of each feature)
dian: 62.22, Mean: 57.17) and it decreases the tioned general image feature, facial presence, and
chance of being classified as depressed. With re- facial expressions.)
spect to the visual features, for instance, the mean Content-based models: See table 8 for the per-
and the median of ’shared_colorfulness’ is 112.03 formance of our prediction framework against the
and 113 respectively. The value of 136.71 would state-of-the-art methods for predicting depressive
be high; thus, it decreases the chance of being de- behavior employing the same feature sets and hy-
pressed for this specific user by log-odds of -0.54. perparameter settings (see Models I-V.) Besides,
Moreover, the ’profile_naturalness’ of 0.46 is con- several prior efforts demonstrate that word embed-
sidered high compared to 0.36 as the mean for ding models can reliably enhance short text clas-
the depressed class which justifies pull down of sification (Wang et al., 2015a), Model VI em-
the log-odds by −0.25. For network features, for ploys pre-trained word embeddings trained over
instance, ’two_hop_neighborhood’ for depressed 400 million tweets 33 while representing a user
users (Mean : 84) are less than that of control users with retrieving word vectors for all the words a
(Mean: 154), and is reflected in pulling down the user employed in tweets/profile description. We
log-odds by -0.27. aggregate these word vectors through their means
Baselines: To test the efficacy of our multi-modal and feeding it as input to SVM classifier with a
framework for detecting depressed users, we com- linear kernel. In Model VII, we employ (Yaz-
pare it against existing content, content-network,
33
and image-based models (based on the aforemen- https://bit.ly/2sPR3OQTable 8: Model’s Performance for Depressed User Identification from Twitter using different data modalities
Model Features
Data Source Ref Year Model Spec. Sens. F-1 Acc.
# N-grams LIWC Sentiment Topics Metadata
I (Nadeem, 2016) 2016 X NB 0.69 0.70 0.69 0.70
II (Coppersmith et al., 2016) 2016 X X User Acti. Not Reported* 0.73 0.74 0.73 0.74
III (Coppersmith et al., 2014) 2015 X X X User Acti. Log-linear 0.83 0.80 0.81 0.82
IV (Preoţiuc-Pietro et al., 2015) 2015 X X X X LR 0.84 0.83 0.84 0.84
V Content (Tsugawa et al., 2015) 2015 X X X X User Acti. SVM 0.86 0.84 0.85 0.85
VI N/A N/A X SVM(Pre. embed.) 0.72 0.72 0.72 0.72
VII N/A N/A X SVM(Train w2vec) 0.70 0.70 0.70 0.70
VIII Cont., Net. (De Choudhury et al., 2013b) 2013 X X X SVM, PCA 0.84 0.80 0.83 0.85
IX N/A N/A LR 0.68 0.67 0.67 0.68
X Image N/A N/A N/A SVM 0.69 0.67 0.67 0.69
XI N/A N/A RF 0.72 0.70 0.69 0.71
Ours Cont.,Image,Net. N/A X X X X X X N/A 0.87 0.92 0.90 0.90
davar et al., 2017)’s dataset of 45000 self-reported from user’s network (De Choudhury et al., 2013b)
depressed users and train Skip- gram model with for reliable capturing of user context for depres-
negative sampling to learn word representations. sion prediction.
We chose this model as it generates robust word
embeddings even when words are sparse in the 6 Conclusion
training corpus (Mikolov et al., 2013). We set We presented an in-depth analysis of visual and
dimensionality to 300 and negative sampling rate contextual content of likely depressed profiles on
to 10 sample words, which shows promising re- Twitter. We employed them for demographic
sults with medium-sized datasets (Mikolov et al., (age and gender) inference process. We devel-
2013). Besides, we observed many vulnera- oped multimodal framework, employing statistical
ble users chose specific account names, such as techniques for fusing heterogeneous sets of fea-
"Suicidal_Thoughxxx," and "younganxietyyxxx," tures obtained by processing visual, textual and
which are good indicators of their depressive be- user interactions. Conducting extensive set of ex-
havior. We use Levenshtein distance 34 between periments, we assessed the predictive power of
depression indicative terms in (Yazdavar et al., our multimodal framework while comparing it
2017)’s depression lexicon and the screen name to against state-of-the-art approaches for depressed
capture their degree of semantic similarity. user identification on Twitter. The empirical eval-
Image-based models: We employ the afore- uation shows that our multimodel framework is
mentioned visual content features including facial superior to them and it improved the average
presence, aesthetic features, and facial expression F1-Score by 5 percent. Effectively, visual cues
for depression prediction. We use three different gleaned from content and profile shared on social
models: Logistic Regression (Model IX), SVM media can further augment inferences from tex-
(Model X), and Random Forrest (Model XI). The tual content for reliable determination of depres-
poor performance of image-based models suggests sion indicators and diagnosis.
relying on a unique modality would not be suffi-
cient for building a robust model given the com-
plexity and the abstruse nature of prediction task.
Network-based models: Network-based features
imply users’ desire to socialize and connect with
others. There is a notable difference between
number of friends and followers, favorites and
status count for depressed and control users (see
Table 3.) Besides, for building baseline Model
VIII, we obtained egocentric network measures
for each user based on the network formed using
@-replies interactions among them. The egocen-
tric social graph of a user u is an undirected graph
of nodes in u’s two-hop neighborhood in our Ua
dataset, where the edge between nodes u and v im-
plies that there has been at least one @-reply ex-
change. Network-based features including Reci-
procity, Prestige Ratio, Graph Density, Cluster-
ing Coefficient, Embeddedness, Ego components
and Size of two-hop neighborhood were extracted
34
https://bit.ly/1JtgTWJReferences Marie C Berger. 1984. Clinical thinking ability
and nursing students. Journal of Nursing Edu-
Saeed Abdullah, Elizabeth L Murnane, Jean MR
cation, 23(7):306–308.
Costa, and Tanzeem Choudhury. 2015. Collec-
tive smile: Measuring societal happiness from John D Burger, John Henderson, George Kim, and
geolocated images. In Proceedings of the 18th Guido Zarrella. 2011. Discriminating gender
ACM Conference on Computer Supported Co- on twitter. In Proceedings of the conference on
operative Work & Social Computing, pages empirical methods in natural language process-
361–374. ACM. ing, pages 1301–1309. Association for Compu-
Unaiza Ahsan, Munmun De Choudhury, and Irfan tational Linguistics.
Essa. 2017. Towards using visual attributes to
Francesca Calabrese, Paola Brivio, Piotr Gruca,
infer image sentiment of social events. In Neu-
Magdalena Lason-Tyburkiewicz, Mariusz Papp,
ral Networks (IJCNN), 2017 International Joint
and Marco A Riva. 2017. Chronic mild stress-
Conference on, pages 1372–1379. IEEE.
induced alterations of local protein synthesis: a
Faiyaz Al Zamal, Wendy Liu, and Derek Ruths. role for cognitive impairment. ACS chemical
2012. Homophily and latent attribute inference: neuroscience, 8(4):817–825.
Inferring latent attributes of twitter users from
neighbors. ICWSM, 270:2012. Fabio Celli, Elia Bruni, and Bruno Lepri. 2014.
Automatic personality and interaction style
Nazanin Andalibi, Oliver L Haimson, Munmun recognition from facebook profile pictures. In
De Choudhury, and Andrea Forte. 2016. Un- Proceedings of the 22nd ACM international
derstanding social media disclosures of sexual conference on Multimedia, pages 1101–1104.
abuse through the lenses of support seeking and ACM.
anonymity. In Proceedings of the 2016 CHI
Conference on Human Factors in Computing Tianqi Chen and Carlos Guestrin. 2016. Xgboost:
Systems, pages 3906–3918. ACM. A scalable tree boosting system. In Proceed-
ings of the 22nd acm sigkdd international con-
Nazanin Andalibi, Pinar Öztürk, and Andrea ference on knowledge discovery and data min-
Forte. 2017. Sensitive self-disclosures, re- ing, pages 785–794. ACM.
sponses, and social support on instagram: The
case of# depression. In CSCW, pages 1485– Cindy Chung and James W Pennebaker. 2007.
1500. The psychological functions of function words.
Social communication, 1:343–359.
Jules Angst, Alex Gamma, Markus Gastpar, J-P
Lépine, Julien Mendlewicz, and Andre Tylee. Glen Coppersmith, Mark Dredze, and Craig Har-
2002. Gender differences in depression. Euro- man. 2014. Quantifying mental health signals
pean archives of psychiatry and clinical neuro- in twitter. In Proceedings of the Workshop
science, 252(5):201–209. on Computational Linguistics and Clinical Psy-
Shlomo Argamon, Moshe Koppel, James W Pen- chology: From Linguistic Signal to Clinical Re-
nebaker, and Jonathan Schler. 2007. Mining the ality, pages 51–60.
blogosphere: Age, gender and the varieties of Glen Coppersmith, Mark Dredze, Craig Harman,
self-expression. First Monday, 12(9). Kristy Hollingshead, and Margaret Mitchell.
Goonmeet Bajaj, Amir Hossein Yazdavar, Krish- 2015. Clpsych 2015 shared task: Depression
naprasad Thirunarayan, and Amit Sheth. 2017. and ptsd on twitter. In Proceedings of the 2nd
Identifying depressive disorder in the twitter Workshop on Computational Linguistics and
population. Clinical Psychology.
Lisa J Barney, Kathleen M Griffiths, Anthony F Glen Coppersmith, Ryan Leary, Patrick Crutch-
Jorm, and Helen Christensen. 2006. Stigma ley, and Alex Fine. 2018. Natural language
about depression and its impact on help-seeking processing of social media as screening for
intentions. Australian & New Zealand Journal suicide risk. Biomedical informatics insights,
of Psychiatry, 40(1):51–54. 10:1178222618792860.Glen Coppersmith, Kim Ngo, Ryan Leary, and Chi Thang Duong, Remi Lebret, and Karl Aberer.
Anthony Wood. 2016. Exploratory analysis of 2017. Multimodal classification for analysing
social media prior to a suicide attempt. In Pro- social media. arXiv preprint arXiv:1708.02099.
ceedings of the Third Workshop on Computa-
tional Lingusitics and Clinical Psychology. Monireh Ebrahimi, Amir Hossein Yazdavar, and
Amit Sheth. 2017. Challenges of sentiment
Ritendra Datta, Dhiraj Joshi, Jia Li, and James Z analysis for dynamic events. IEEE Intelligent
Wang. 2006. Studying aesthetics in pho- Systems, 32(5):70–75.
tographic images using a computational ap-
proach. In European Conference on Computer Penelope Eckert. 2017. Age as a sociolinguis-
Vision, pages 288–301. Springer. tic variable. The handbook of sociolinguistics,
pages 151–167.
Munmun De Choudhury, Scott Counts, and Eric
Horvitz. 2013a. Social media as a measurement Earl S Ford, Wayne H Giles, and William H Dietz.
tool of depression in populations. In Proceed- 2002. Prevalence of the metabolic syndrome
ings of the 5th Annual ACM Web Science Con- among us adults: findings from the third na-
ference, pages 47–56. ACM. tional health and nutrition examination survey.
Jama, 287(3):356–359.
Munmun De Choudhury, Michael Gamon, Scott
Counts, and Eric Horvitz. 2013b. Predicting de- Venkata Rama Kiran Garimella, Abdulrahman Al-
pression via social media. In Seventh interna- fayad, and Ingmar Weber. 2016. Social media
tional AAAI conference on weblogs and social image analysis for public health. In Proceed-
media. ings of the 2016 CHI Conference on Human
Factors in Computing Systems, pages 5543–
Munmun De Choudhury and Emre Kıcıman. 5547. ACM.
2017. The language of social support in social
media and its effect on suicidal ideation risk. In Hu Han, Charles Otto, Anil K Jain, et al. 2013.
Proceedings of the... International AAAI Con- Age estimation from face images: Human vs.
ference on Weblogs and Social Media. Interna- machine performance. ICB, 13:1–8.
tional AAAI Conference on Weblogs and Social Kai-Qi Huang, Qiao Wang, and Zhen-Yang Wu.
Media, volume 2017, page 32. NIH Public Ac- 2006. Natural color image enhancement and
cess. evaluation algorithm based on human visual
Munmun De Choudhury, Emre Kiciman, Mark system. Computer Vision and Image Under-
Dredze, Glen Coppersmith, and Mrinal Kumar. standing, 103(1):52–63.
2016. Discovering shifts to suicidal ideation Barbara K Kaye and Barry S Sapolsky. 2004.
from mental health content in social media. In Watch your mouth! an analysis of profanity
Proceedings of the 2016 CHI Conference on uttered by children on prime-time television.
Human Factors in Computing Systems, pages Mass Communication & Society, 7(4):429–452.
2098–2110. ACM.
Miron B Kursa, Witold R Rudnicki, et al. 2010.
Munmun De Choudhury, Sanket S Sharma, Tomaz Feature selection with the boruta package. J
Logar, Wouter Eekhout, and René Clausen Stat Softw, 36(11):1–13.
Nielsen. 2017. Gender and cross-cultural dif-
ferences in social media disclosures of men- Kristina Lerman, Megha Arora, Luciano Gallegos,
tal illness. In Proceedings of the 2017 ACM Ponnurangam Kumaraguru, and David Garcia.
Conference on Computer Supported Coopera- 2016. Emotions, demographics and sociability
tive Work and Social Computing, pages 353– in twitter.
369. ACM.
Gil Levi and Tal Hassner. 2015. Age and gender
Maeve Duggan, Nicole B Ellison, Cliff Lampe, classification using convolutional neural net-
Amanda Lenhart, and Mary Madden. 2015. De- works. In Proceedings of the IEEE Conference
mographics of key social networking platforms. on Computer Vision and Pattern Recognition
Pew Research Center, 9. Workshops, pages 34–42.Lizi Liao, Jing Jiang, Ee-Peng Lim, and Heyan 2011. Understanding the demographics of twit-
Huang. 2014. A study of age gaps between ter users. ICWSM, 11:5th.
online friends. In Proceedings of the 25th
ACM conference on Hypertext and social me- Adrián Montesano, Guillem Feixas, Franz Caspar,
dia, pages 98–106. ACM. and David Winter. 2017. Depression and iden-
tity: Are self-constructions negative or conflict-
Leqi Liu, Daniel Preotiuc-Pietro, Zahra Riahi ual? Frontiers in psychology, 8:877.
Samani, Mohsen Ebrahimi Moghaddam, and
Lyle H Ungar. 2016. Analyzing personality Arjun Mukherjee and Bing Liu. 2010. Improv-
through social media profile picture choice. In ing gender classification of blog authors. In
ICWSM, pages 211–220. Proceedings of the 2010 conference on Empir-
ical Methods in natural Language Processing,
Lydia Manikonda and Munmun De Choudhury. pages 207–217. Association for Computational
2017. Modeling and understanding visual at- Linguistics.
tributes of mental health disclosures in social
media. In Proceedings of the 2017 CHI Confer- Moin Nadeem. 2016. Identifying depression on
ence on Human Factors in Computing Systems, twitter. arXiv preprint arXiv:1607.07384.
pages 170–181. ACM.
KAYA NAz and Helena Epps. 2004. Relationship
Marina Marcus, M Taghi Yasamy, Mark van Om- between color and emotion: A study of college
meren, Dan Chisholm, Shekhar Saxena, et al. students. College Student J, 38(3):396.
2012. Depression: A global public health con-
cern. WHO Department of Mental Health and Matthew L Newman, Carla J Groom, Lori D Han-
Substance Abuse, 1:6–8. delman, and James W Pennebaker. 2008. Gen-
der differences in language use: An analysis
Iacopo Masi, Anh Tuážěn Trážğn, Tal Hass-
of 14,000 text samples. Discourse Processes,
ner, Jatuporn Toy Leksut, and Gérard Medioni.
45(3):211–236.
2016. Do we really need to collect millions of
faces for effective face recognition? In Eu- Matthew L Newman, James W Pennebaker, Di-
ropean Conference on Computer Vision, pages ane S Berry, and Jane M Richards. 2003. Ly-
579–596. Springer. ing words: Predicting deception from linguistic
styles. Personality and social psychology bul-
Sally McManus, Paul Bebbington, Rachel Jenk-
letin, 29(5):665–675.
ins, and Terry Brugha. 2016. Mental Health
and Wellbeing in England: Adult Psychiatric
Dong Nguyen, Rilana Gravel, Dolf Trieschnigg,
Morbidity Survey 2014: a Survey Carried Out
and Theo Meder. 2013. " how old do you think
for NHS Digital by NatCen Social Research and
i am?" a study of language and age in twitter. In
the Department of Health Sciences, University
ICWSM.
of Leicester. NHS Digital.
Dong Nguyen, Dolf Trieschnigg, A Seza Doğruöz,
Tomas Mikolov, Ilya Sutskever, Kai Chen, Greg S
Rilana Gravel, Mariët Theune, Theo Meder, and
Corrado, and Jeff Dean. 2013. Distributed
Franciska De Jong. 2014a. Why gender and age
representations of words and phrases and their
prediction from tweets is hard: Lessons from a
compositionality. In Advances in neural infor-
crowdsourcing experiment. In Proceedings of
mation processing systems, pages 3111–3119.
COLING 2014, the 25th International Confer-
David N Milne, Glen Pink, Ben Hachey, and ence on Computational Linguistics: Technical
Rafael A Calvo. 2016. Clpsych 2016 shared Papers, pages 1950–1961.
task: Triaging content in online peer-support fo-
rums. In Proceedings of the Third Workshop on Thin Nguyen, Dinh Phung, Bo Dao, Svetha
Computational Lingusitics. Venkatesh, and Michael Berk. 2014b. Affec-
tive and content analysis of online depression
Alan Mislove, Sune Lehmann, Yong-Yeol Ahn, communities. IEEE Transactions on Affective
Jukka-Pekka Onnela, and J Niels Rosenquist. Computing, 5(3):217–226.You can also read