Future Employment and Automation1 - Cambridge Econometrics
←
→
Page content transcription
If your browser does not render page correctly, please read the page content below
Quaderni Fondazione G. Brodolini, STUDI e RICERCHE 2018, Vol. 61: 17-43

 Future Employment and Automation1
 Cornelia Suta2, Luca Barbieri and Mike May-Gillings
1. Introduction
The European Union has different strategies and initiatives both to improve the employability of
Europeans and to increase the competitiveness of the European economy through sustainable growth.
One strategy, the EU's Strategic Framework for Education and Training 2020 (ET2020), has attached
clear targets. One of the targets of ET2020 relates to the share of employed 20-34 year-olds having
successfully completed ISCED 3-8 (European Commission, 2012). At EU level, the target of 82% for
2020 is close to being achieved. Discussions about revising this target (to probably increase it) and on
the further improvement of skills in the EU have begun (European Commission, 2017). One European
Commission initiative, the New Skills Agenda (European Commission, 2016), recognises the need to
promote learning in the workplace and to further improve the foundation of basic literacy and numeracy
skills (European Commission, 2017). It appears that EU labour market policy is learning from the
impacts of the last financial crisis on a significant part of the labour force - i.e. young graduates and the
low skilled. Does this mean that the European labour force will be ready to face the future challenges
of the labour market?
Since the 1980s, several developed countries have seen a rise in labour market polarisation – i.e. a rise
in the employment share of low-skilled and high-skilled jobs alongside a decline in the share of middle-
skilled ones. Bárány and Siegel (2018) found that in the United States polarisation of occupations in
terms of wages and employment started as early as the 1950s and was driven by the long-term structural
change taking place in the economy. At the heart of the structural change was technological progress.
Moreover, from the 1980s onward, information and communication technologies (ICT) have replaced
primarily routine middle-skilled jobs (Bárány & Siegel, 2018), and thereby brought about the hourglass
shaped distribution of skills labour market (much demand at the top and bottom but much less in the
middle). Current technological developments, such as new developments in Artificial Intelligence (AI),
pose more of risk to low-skilled jobs than the previous waves of technological progress (Nedelkoska &
Quintini, 2018). So, will the labour market change its shape from that of an hourglass to one shaped
like a lightbulb as the demand for labour at the lower end of the skills distribution begins to shrink too?
Together with other notable findings, Nedelkoska and Quintini (2018) found that the risk of automation
is higher among young people’s jobs than those of older workers.3 Therefore, the authors conclude that
automation is much more likely to result in youth unemployment than in early retirements. Of course,
this outcome might be mitigated through young people being better skilled and so can adapt more easily
to the new jobs created as a result of the introduction of new technologies.
The current chapter aims to go beyond providing an estimate of the share of jobs in the EU at high risk
of automation. The underlying purpose is to raise the awareness of policy makers of the significant
changes that jobs will undergo as a result of the adoption of new technologies. The study builds on the
task analysis work undertaken by Eurofound and exploits the Cedefop Skills Forecast 2018 data to

1
 The authors would like to thank Terence Hogarth, Ilias Livanos, Sudipa Sarkar, Eva Alexandri, Chris
 Woolliscroft, Richard Lewney and Hector Pollitt for their comments and feedback on an early draft of
 the paper. Special thanks for Crystal Chu who has helped with the data preparation. This work was carried
 out under the Monroe project, which was funded by the European Commission’s Horizon 2020 research
 and innovation programme (grant agreement 727114).
2
 Corresponding author: Cornelia Suta, Rue Belliard 15-17, 1040 Brussels, Email: cs@camecon.com
3
 In OECD countries, most of the entry level jobs for young people are either in elementary occupations
 and sales and personal services, both occupations found by Nedelkoska and Quintini (2018) with high
 risk of automation.
analyse the distribution of risk among different population groups with a special focus on education
attainment needs. The Cedefop Skills Forecast is based, among others, on the assumption that all vacant
jobs will be replaced and this chapter puts into question this assumption.
2. Understanding the relationship between technology, employment, and skills
In this chapter automation is defined with reference to the replacement of people working in some jobs
by robots, artificial intelligence or machine learning technologies. The potential impact of job
automation on a country is driven by its industry composition (i.e. employment shares across sectors)
and the relative proportion of jobs at high risk of automation in each of those sectors (PwC, 2017).
In the literature, all previous studies on automation commence with an assessment by experts of the risk
of automation for a subset of occupational titles based on the tasks these occupations involve
(Nedelkoska & Quintini, 2018). Frey and Osborne (2013) were the first to identify the so-called
automation bottlenecks i.e. the tasks that, given the current state of technology, are difficult to automate.
The bottlenecks to automation identified stemmed from the fact that some jobs required: social
intelligence, such as the ability to effectively negotiate complex social relationships, including caring
for others or recognising cultural sensitivities; cognitive intelligence, such as creativity and complex
reasoning; and perception and manipulation, such as the ability to carry out physical tasks in an
unstructured work environment (Nedelkoska & Quintini, 2018). Nevertheless, Frey and Osborne (2013)
found 47% of jobs in the United States were at high risk of being automated.
Starting from the occupational-based approach of Frey and Osborne (2013), Arntz et al (2016).
developed a task-based approach to estimate the risk of automation for jobs in 21 OECD countries. The
approach is based on the idea that the automatibility of jobs ultimately depends on the tasks which
workers perform in these jobs, and how easily these tasks can be automated. Moreover, there is
considerable variation in the tasks involved in jobs having the same occupational title (Nedelkoska &
Quintini, 2018). With the task-based approach, Arntz et al. (2016) showed that the share of jobs at was
9% in the United States; substantially below the previous estimate of 47% by Frey and Osborne. Using
the same methodology as Arntz et al. (2016), Nedelkoska and Quintini (2018) increased the coverage
to 32 countries (from 22) and slightly modified the methodology. Their results showed that about 14%
of jobs in those OECD countries which participated in PIAAC were highly automatable (i.e., with a
probability of automation of over 70%), with high across countries variation (from 33% in Slovakia to
6% in Norway). Task-biased technological change due to automation will have similar implications to
ones of skill-biased technological change on real and relative wages, and employment levels and relative
employment.4 In task-biased technological change case, the important dimension will not be the level
of education of the labour force (as it is in skills-biased case), but the task content of jobs/ occupation,
meaning the degree to which the tasks in a job/ occupation can be routinised (Nedelkoska & Quintini,
2018).
The report published in January 2017 by McKinsey (2017) starts by assessing technical automation
potential occupations in a similar way to Frey and Osborne (2013), but by disaggregating of occupations
into constituent activities reflecting a combination of 18 performance capabilities (such as sensory
perception, cognitive capabilities, natural language processing, social and emotional capabilities, and
physical capabilities). The technical automation potential of these capabilities is assessed based on
existing technologies. For each capability, McKinsey defines four possible levels of requirement,

4
 Skill-biased technological change means the substitution of low-skilled labour and the increase in productivity
of the high-skilled workers by technology, while task-biased technological change means the substitutability of
tasks (and jobs) by technology is determined by the amount of routine that they involve, more than the skills that
they require (Fernández-Macías & Hurley, 2017).

 2
ranking from not required to essential. By estimating the amount of time spent on each of these work
activities by humans, McKinsey was able to estimate the automation potential of occupations in sectors
across the economy, comparing them with hourly wage levels (McKinsey Global Institute, 2017). Their
analysis focused on work activities rather than whole occupations and found that 49% of the activities
that people are paid to do in the global economy have the potential to be automated. Moreover, based
on this approach less than 5% of occupations can be fully automated, while about 30% of the tasks in 6
out of 10 current occupations can be automated (McKinsey Global Institute, 2017).
Furthermore, McKinsey (2017) considers that automation will not happen overnight since five key
factors will influence the pace and extent of its adoption: (i) technical feasibility, (ii) cost of developing
and deploying solutions, (iii) labour market dynamics (including the supply, demand, and costs of
human labour as an alternative to automation), (iv) economic benefits (labour cost savings), and (v)
regularity and social acceptance. The report published in December 2017 by McKinsey (2017) looks at
the number and types of jobs that might be created under different scenarios through to 2030, and
compares this with jobs that could be displaced by automation. Their analysis is based on several trends
that are likely to serve as catalysts of future labour demand and which could create demand for millions
of jobs by 2030. These includes caring for others in ageing societies, raising energy efficiency and
meeting climate challenges, producing goods and services for the expanding consumer class, especially
in developing countries, not to mention investments in technology, infrastructure, and buildings needed
in all countries. To bring about job creation, businesses and governments will be required to seize
opportunities to boost job creation and for labour markets to function well.
Another approach was taken for Germany by Wolter et al. (2016). Their study was focused on the
economic effects of the digitalisation of the economy as a whole (called “Economy 4.0”) and was based
on a five-step scenario analysis. Each scenario adds different impacts and is built upon the previous
one. The results of Wolter et al. (2016) show that Economy 4.0 will accelerate structural changes
towards the expansion of the service sector. In the digitised world, 1.5 million jobs will be eliminated
in 2025 compared with the baseline, i.e. no advanced development path towards the digitalisation of the
economy as a whole. At the same, Economy 4.0 will create 1.5 million new jobs (not included in the
baseline projection).
The International Federation of Robotics (International Federation of Robotics, 2017) has summarised
the findings in the literature and concluded that many studies show that productivity will increase
alongside demand, which in turn will create new job opportunities. Some impact, however, will be
noticed on the labour market since the structure of employment will change in favour of high-skilled
workers who will benefit from higher demand and wages, while middle- and low-skilled workers will
face downward wage pressures (caused by other structural factors in the economy). Moreover, robots
will complement labour, rather than substituting it, and that job losses in one sector are likely to be
compensated by gains in others, so that the aggregate employment growth could well be positive.
In addition to estimating the share of workers whose jobs are at very high risk of being automated using
the task-based methodology, Nedelkoska and Quintini (2018) shed light on a number of other crucial
issues, such as the substantially large number of workers whose job tasks are likely change significantly
as a result of the current wave of technological innovations; and the characteristics of the workers whose
jobs are risk of automation. One surprising finding by Nedelkoska and Quintini (2018) is the
relationship between automation and age is U-shaped in the sense that the elementary jobs many young
people find employment in – including student jobs, internships and low-skilled summer jobs – are
more likely to be affected negatively by automation. However, the effect on the overall youth
employment is mitigated by the fact that in many countries the younger cohort is more highly educated

 3
and, accordingly, are more likely to adapt to technological change compared with their older
counterparts.
Low-skills jobs are at risk (McKinsey Global Institute, 2017; Nedelkoska & Quintini, 2018) but they
are not the only ones to be affected. Rapid developments in technology will lead to the automation of
jobs in middle-skilled activities such as accounting, clerical work and repetitive production tasks
(OECD, 2017). Moreover, the least automatable occupations almost all require professional training
and/or tertiary education (Nedelkoska & Quintini, 2018). Therefore, the potential impact of job
automation varies according to the characteristics of the workers (skills and education) and jobs (tasks
and activities). The OECD (2017) and World Economic Forum (2016) recommend investing in both
education and training, and to make better use of skills, and better co-ordinate skills-related policies.
The European Jobs Monitor Task Indicator dataset (Eurofound, 2016) has information on both content
of tasks (what is done) and on the methods and tools used for carrying out the tasks (how it is done).
The content is related with the output of the economic sectors, while the methods of work are related
more to the technology used or organisation of the work (Eurofound, 2016). Each task is converted into
a job-level index measuring the extent to which a job involves a particular task. The indices are
constructed by aggregating information on the task from different sources (e.g. European Working
Conditions Survey (EWCS), OECD’s Survey of Adult Skills (PIAAC), Occupational Information
Network dataset (ONET)). Each score takes a value between 0-1 and it reflects the intensity of each
type of task content in each job (Eurofound, 2016). Moreover, the task scores for a job should not be
understood as the breakdown of total labour input into distinct and mutually exclusive categories of
tasks, therefore the sum of tasks scores will not add up to one (Eurofound, 2016).
Eurofound (2016) found that there is a strong correlation between the occurrence of the physical tasks,
working with machines, and routine tasks. While historically, computerisation has largely been
confined to manual and cognitive routine tasks involving explicit rule-based activities, recent
developments in machine learning and robotics allow for substitution of labour in a wide range of non-
routine tasks (Frey & Osborne, 2013).
Eurofound (2018) used the Cedefop Skills Forecast 2018 and looked at the changes in the distribution
of tasks over the forecast period. The task assignment is fixed at the beginning of the forecasting period
and remains constant up to 2030. According to this analysis, in the EU, the task distribution will change
towards: less physical tasks and more intellectual and social ones; more business literacy,
selling/persuading and serving/attending; more ICT skills; and some increase in autonomy and decrease
in routine work (Eurofound, 2018). The reported changes in the distribution of tasks are only attributable
to the compositional changes in the employment by occupation and sector and do not measure how the
tasks in specific jobs change over time (Eurofound, 2018).
The findings above are consistent with those of Autor (2016) who mentions that the tasks that have
proved most difficult to automate are those demanding flexibility, judgment and common sense, skills
that humans understand only tacitly. Brynjolfsson and Mitchell (2017) identify eight key criteria that
help distinguish “suitable for machine learning” tasks from tasks where machine learning is less likely
to be successful, at least when using the currently dominant machine learning paradigm. Moreover,
although parts of many jobs may be “suitable for machine learning”, other tasks within these same jobs
do not fit the criteria for machine learning well; hence, the effects on employment are more complex
than the simple replacement and substitution of jobs sometimes found in the literature suggests
(Brynjolfsson & Mitchell, 2017).
A similar view on partial automation and substitution of jobs is taken by Bessen (2016) when
investigating basic relationships between computer automation and occupations. By looking at detailed

 4
occupations since 1980 to explore whether computers are related to job losses or other sources of wage
inequality, Bessen (2016) finds that occupations that use computers grow faster, even for highly routine
and mid-wage occupations. Moreover, computer automation is not found as a source of significant
overall job losses.
Table 1 summarises the activities/ tasks that were found in the literature to belong to one of the two
groups and that will be used to identify of occupations with a high likelihood of being automatable by
2030 (see Section 3.1).
Table 1: Summary of automatable and non-automatable task/activity descriptions in the
literature

 Non-automatable Automatable
 Applying expertise to decision making, Processing data
 planning, and creative tasks.
 Interacting with stakeholders Collecting data
 Managing and developing people Performing physical activities and
 operating machinery in predictable
 environments
 Performing physical activities and Routine, codifiable tasks
 operating machinery in unpredictable
 environments
 Finger dexterity, i.e. tasks that involve Tasks that provides clear feedback with
 making precisely coordinated clearly definable goals and metrics
 movements of the fingers of one or both
 hands to grasp, manipulate, or assemble
 very small objects.
 Manual Dexterity, i.e. tasks that involve Tasks that do not need long chains of
 quickly moving your hand, your hand logic or reasoning that depend on diverse
 together with your arm, or your two background knowledge or common sense
 hands to grasp, manipulate, or assemble
 objects
 Working in cramped work spaces, or in Tasks that do not require detailed
 awkward positions explanation of how the decision was
 made
 Creative intelligence - originality Tasks that do not require specialized
 dexterity, physical skills, or mobility
 required
 Creative intelligence – fine arts The phenomenon or function being
 learned should not change rapidly over
 time
 Social perceptiveness
 Negotiation
 Persuasion

 5
Assisting and caring for others Tasks requiring problem solving capabilities, intuition, creativity and persuasion Source: Cambridge Econometrics based on review of the literature. In conclusion, many studies in the literature use the task-based approach to estimate the impact of automation on employment. Most studies assume complementary between labour and the new technologies behind automation, rather than perfect substitution; therefore, it is likely that some of replacement labour demand will be affected negatively. No studies were identified using pan-European data sources, and there is the gap that the analysis in this chapter is filling. The following research questions arise from the literature review. How many jobs from the replacement demand will be replaced by people and how many by robots? What are the main challenges that the policy makers should address in view of the automation? 3. Estimating the impact of automation on future employment There is consensus in the literature (Frey & Osborne, 2013; Nedelkoska & Quintini, 2018; PwC, 2017; McKinsey Global Institute, 2017) that artificial intelligence and machine learning will replace partially or fully many of the existing jobs. The methodologies used in these studies are based on existing jobs and the existing tasks/activities that the workers are performing in those jobs. Most of these studies acknowledge the fact that there is not enough information to estimate the impact on future jobs and tasks. Following the existing literature and the descriptions of tasks performed by the workers available from the European Jobs Monitor Task Indicator (Eurofound, 2016), a methodological approach to identify how many of the future jobs in the Cedefop Skills Forecast 2018 projections are likely to be affected by automation is specified. The methodological approach consists of three main steps: 1. Identification of occupations with a high likelihood of being automatable by 2030; 2. Adjusting the Cedefop Skills Forecast 2018 employment demand by removing the replacement demand in automatable occupations from 2025 onwards; 3. Implications for the labour supply by 2030. 3.1 Identification of occupations with a high likelihood of being automatable by 2030 Similar to other studies (Nedelkoska & Quintini, 2018; Arntz, et al., 2016; Ambrosetti Club, 2017), the starting point in the approach is using the automation label for occupations of Frey and Osborne (2013) as provided in Nedelkoska and Quintini (2018).5 The Frey and Osborne (2013) list of occupations is then aggregated to 2-digit ISCO-08 occupations since the European Jobs Monitor Task Indicator dataset (Eurofound, 2016) has this level of aggregation. In order to map the Frey and Osborne (2013) automation label to the 2-digit ISCO-08 occupations, it is assumed that if two or more 3-digit 5 See Table 2 in the mentioned study which contains the correspondence with the list of 3-digit ISCO-08 occupations. 6
occupations can potentially be automated then the entire parent 2-digit occupation is at risk of being
automatable.6
Table 2: Tasks corresponding to PIAAC variables and engineering bottlenecks

 Engineering Variable in PIAAC Eurofound Task Analysis (Eurofound,
 bottleneck (Nedelkoska and 2016)
 (Frey and Osborne, Quintini, 2018)
 2013)
 Perception Fingers, dexterity Physical Dexterity
 manipulation
 Creative intelligence Simple problem-solving Information-processing: Processing of
 codified information
 Creative intelligenceComplex problem- Problem-solving: finding solutions to
 solving complex/new issues
 Social intelligence Teaching Social: Teaching/ Coaching
 Social intelligence Advice and Social: Serving/ attending
 Communication
 Social intelligence Plan for others Social: Managing/ coordinating
 Social intelligence Negotiate, Influence, Sell Social: Selling/ persuading
Source: Cambridge Econometrics adaptation based on Table 4.2 in Nedelkoska and Quintini (2018) and Table
 2 in Eurofound (2016)

Following the approach in Nedelkoska and Quintini (2018) and using European Jobs Monitor Task
Indicator dataset (Eurofound, 2016), an automation label is used to split 2-digit occupations into
automatable and not automatable and then regression analysis is used to identify which task indicators
better describe the automatable characteristics of different occupations. For this purpose, analysis of
variance and logistic regression7 are run to identify which engineering bottlenecks from Table 2 have
the highest influence on an occupation being labelled automatable or not.
Once the main drivers of automation are identified and using others from the literature review, some
criteria are defined to divide the list of jobs (occupations by sectors) into two groups:
 1. automatable jobs; and
 2. non-automatable jobs.
The labelled occupations are then used to analyse the employment projections in the Cedefop Skills
Forecast 2018 dataset. In the forecast dataset, the increase/ decrease in jobs by 2030 is split in two
categories: new jobs and replacement jobs. While new job creation is based on the macro-economic
assumptions, the replacement jobs take into account the age distribution of the labour force.
The methodological approach is summarised in .

6
 This strong assumption is taken since the automation label information does not exist for many of the 3-
 digit occupation that belong to the 2-digit group. Moreover, for occupation “42 Customer services
 clerks”, there is information on two of the 3-digit occupations and one (Telephone switchboard operators)
 is described be being automatable and the other (Hotel receptionists) is not labelled as automatable. In
 this case, it is assumed that the entire 2-digit group is susceptible for automation given the other 3-digit
 occupations that belong to this group and which are mentioned in the literature as being automatable.
7
 The probability of an occupation being automated is modelled as a function of the tasks indicators using
 the logit model: ( = 1| , … , ) = 1/(1 + (−( + + ⋯ + ) , where y is the
 automatable binary variable and xi are the task indicators.

 7
Figure 1: Methodological approach summary

 •Map the Frey and Osborne (2013) automation label to the 2-digit occupations in the
 European Jobs Monitor Task Indicator dataset (Eurofound, 2016)
 •Map tasks in the European Jobs Monitor Task Indicator dataset (Eurofound, 2016) to
 emerging bottlenecks.

 •Use analysis of variance (ANOVA) decomposition and logistic regression to
 understand which tasks or methods used in the existing jobs are drivers of
 automation.

 •Define criteria based on task and method intensity to divide the jobs in two groups:
 automatable and non-automatable jobs.
 •Use the number of jobs in an occupation to label occupations in two groups:
 automatable and non-automatable occupations.

 •Adjust the Cedefop Skills Forecast 2018 employment estimation for 2030 by
 assuming zero replacement demand starting from 2025 in occupations that are
 automatable
 •Analyse the labour supply by age by 2030 in view of the change in demand.

Source: Cambridge Econometrics

The task scores from the European Jobs Monitor Task Indicator dataset (Eurofound, 2016) take values
between 0 and 1 and reflect the intensity of each type of task content in each job. A score above 0.7 is
considered very high and that reflects the importance of that task within the job, without prejudice to
other task intensities. Therefore, if a task which is unlikely8 to be automated with the existing technology
has an intensity higher than or equal to 0.7, then the job will have a low probability of disappearing by
2030. In turn, if a task which is likely9 to be automated with the existing technology has an intensity
higher and equal than 0.7 and the job does not have any non-automatable high intensity tasks, then the
job will have a high probability of low employment demand by 2030.
Based on this reasoning, the following ordered criteria are considered to split the jobs in the two above-
mentioned groups. The criteria are based both on the ANOVA and logistic regression results, but also
on the literature review. Each time a job is assigned to one of the two groups, then it is removed from
the list of available jobs on which the next criterion is applied.
 1. If the intensity of social managing task is higher than or equal to 70%, then the job is put in the
 non-automatable group.
 2. If the intensity of social serving and attending task is higher than or equal to 70%, then the job
 is put in the non-automatable group.
 3. If the intensity of creativity task is higher than or equal to 70%, then the job is put in the non-
 automatable group.

8
 The unlikelihood of a task to be automated is based on the literature review. See Table 1
9
 The likelihood of a task to be automated is based on the literature review. See Table 1

 8
4. If the social teaching intensity in the job is higher than or equal to 70% then the job is put in
 the non-automatable group.
 5. If the social selling and persuading task is higher than or equal to 70% then the job is put in the
 non-automatable group.
 6. If ICT programming is used on the job with an intensity higher than or equal to 70%, then the
 job is put in the non-automatable group.
 7. If teamwork is used on the job with an intensity higher than or equal to 70%, then the job is put
 in the non-automatable group.
 8. If the intensity of using machinery on the job is higher than or equal to 70%, then the job is put
 in the non-automatable group since it assumed that it has already reached a high level of
 automation and therefore jobs in the sector/ occupation will not disappear by 2030.
 9. If information gathering and evaluation task is higher than or equal to 70% then the job is put
 in the non-automatable group.
 10. If the intensity of repetitiveness of the task is higher than or equal to 70%, then the job is put in
 the automatable group since it was found in the literature that repetitive tasks are the easiest to
 replicate by computers.
 11. If the intensity of standardisation of the task is higher and equal than 70%, then the job is put
 in the automatable group since it was found in the literature that standardised tasks are the
 easiest to replicate by computers.
 12. If the numeracy accounting task is higher than or equal to 70%, then the job is put in the
 automatable group.
 13. If the technical literacy task is higher than or equal to 70%, then the job is put in the automatable
 group.
 14. Any jobs left that were not assigned to one of the two groups, will be evaluated using the mean
 probability of automation by occupation and sector found in Tables 4.3 and 4.4 of Nedelkoska
 and Quintini (2018). If the average of the two mean probabilities is higher and equal to 0.5,
 then the job is added in the automatable group.
 15. Any jobs remaining unassigned are put in the non-automatable group.
Once all the jobs are assigned to one of the two groups, the occupations will be assigned to one of the
two groups. A job is a combination of sector and occupation. Therefore, if more than two thirds of the
jobs in an occupation are automatable, then the entire 2-digit level occupation is more likely to be
automatable by 2030. Although, a task-based approach was used so far to identify jobs with a high
likelihood of being automatable, the aggregation of the jobs in 2-digit level occupation is necessary for
the next step of the analysis as Cedefop forecast data for replacement demand is made by occupation
and not sector.
3.2 Adjusting the Cedefop Skills Forecast 2018 employment demand
In this chapter, it is assumed that if the occupation is automatable, then there is a high probability that
the job opportunities based on the replacement of retired or exit workers (i.e. replacement demand) will
no longer materialise. In other words, the tasks in these occupations will be performed no longer by
people but by a form of automation (such as robot, machine learning software, artificial intelligence,
etc.). This will have in impact of the future number of jobs that will be available to young people (20-
34 year olds) in the period up to 2030.

 9
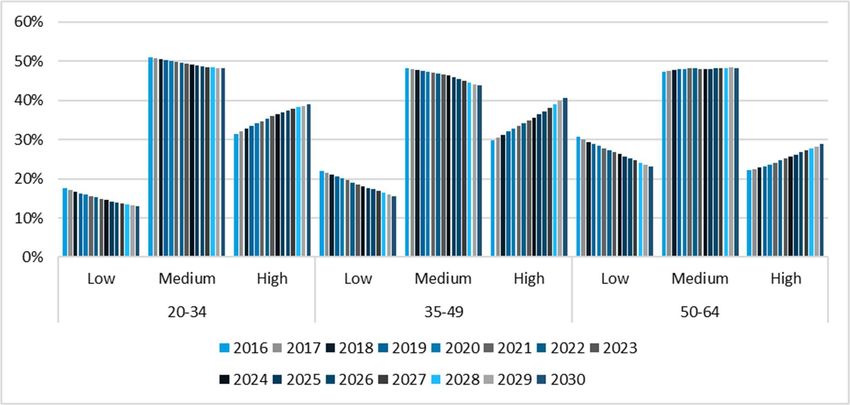
Based on the literature review, it is assumed there will be a delay in the pace and extent of adoption of
technology that will displace jobs. The delay is due to technical feasibility, cost of developing and
deploying solutions, and labour market dynamics. Therefore, in this chapter it is assumed that the job
displacement will not start until 2025 and that it will have an impact only on replacement demand. The
latter assumption is based on the strong assumptions made during the labelling of occupations into
automatable and non-automatable. Moreover, several studies (i.e. Bessen (2016)) imply a stronger
complementarity between people and technologies, i.e. meaning the same or an increased more amount
of work will be carried out by fewer workers as they will be assisted by technology. The choice of the
year, i.e. 2025, is in line with the early scenario from McKinsey (2017), in which all of the modelling
parameters are flexed to the extremes of the set of plausible assumptions that would result in faster
automation development and adoption.
4. Data sources
The data on task analysis is from the European Jobs Monitor Task Indicator dataset, Eurofound 2016.
Data for employment and replacement demands for the period 2016-2030 are from the Cedefop Skills
Forecast 2018 (Cedefop, 2018).
In order to make sense of future changes in employment and skills, consideration needs to be given to
the supply side.
Figure 1Error! Reference source not found. shows that across all age groups in EU-28 the share of
lower educated persons has decreased in the 2008-2017 period while the share of higher educated
persons has increased. Moreover, for the 20-24 years-old group follows the same distribution pattern as
the 20-64 years-old groups, i.e. the distribution of the share of lower-educated in the population is being
mirrored by the distribution of the share of the higher-educated in the population, the middle staying
almost constant over the period. The 25-34 and 35-49 years-old groups show a different distribution:
both the lower and middle educated groups have decreased over time while the higher educated group
has sharply increased over the period.
Figure 1 Share of population by educational attainment level10 and age, EU-28, 2008-2017

Source: Eurostat (lfsa_pgaed)

10
 Low qualification corresponds to ISCED 0-2 level; Medium qualification corresponds to ISCED 3-4
 level; and High qualification corresponds to ISCED 5-8 level

 10
Moreover, the share of middle-educated in the population remains the highest across all age groups
though in the higher-educated in the 25-34 years-old is getting closer to the middle-educated share.
The education upgrading of the population will impact upon the future education attainment of the
labour force over the forecast period, i.e. 2016-2030. Figure 3 shows that for the age groups 20-34 and
35-49, the share of lower-educated keeps decreasing while the higher educated reach the same share in
the labour force as the middle educated.
Figure 3: Share of labour force by qualification level11 and age, 2016-2030

Source: Cedefop Skills forecast 2018

Moreover, Figure 3 shows that by 2030, the share of low educated young people (20-34 year olds) is
expected to decrease close to 10%. This is encouraging in view of the expected decline in low-skill
young people’s jobs due to automation (Nedelkoska & Quintini, 2018). The overall tendency for
decrease in the lower-educated will result in less emphasis on up-skilling policies and more emphasis
on the re-skilling and re-qualification policies for the middle- and higher-educated to help them face
the new skills needs of the automated economy.
Throughout this chapter, a special attention will be given to the 20-34 age group. The analysis of this
age group is necessary since over the forecast period this age group is meant to be the labour supply for
most of the replacement jobs that are assumed to be displaced by automation. Therefore, from the entire
labour supply this age group is assumed to be the most affected by the changes in the economy due to
automation. Moreover, when analysing the qualification level of the labour supply, this age group will
be further split in two groups: 20-24 and 25-34 year-olds since it is assumed that some of the 20-24
year-olds might still pursue further education and therefore they are not yet part of the active labour
force.12 This trend can be observed in

Figure 1: the share of medium-qualified 20-24 year-olds is much higher in this age group than in the
25-34 year-old age group.

11
 Low qualification corresponds to ISCED 0-2 level; Medium qualification corresponds to ISCED 3-4
 level; and High qualification corresponds to ISCED 5-8 level.
12
 In their analysis of future changes in labour supply, Harris et al. (2018) identify a past trend of younger
 workers delaying entry into the workforce that is expected to continue due to automation.

 11
5 Analysis, results and implications
Logistic regression and ANOVA are run on a sample of 2-digit occupations to identify which
engineering bottlenecks have the highest influence on an occupation being labelled automatable or not.
The dependent variable is the automation binary variable (1 if the occupation is automatable, 0
otherwise), while the independent variables are Eurofound tasks indicators that correspond to the
engineering bottlenecks. Figure 2Error! Reference source not found. shows the results of the logistic
regression estimation. As expected, most of the engineering bottlenecks have a negative impact on the
extent to which the jobs in an occupation ca be automated. However, processing of codified information
(literacy and numeracy) and social selling/ persuading tasks have a positive impact on the extent to
which an occupation can be automated. Both tasks were expected to be negatively associated with
automatability. Physical dexterity is not a statistically significant driver of occupation’s susceptibility
to automation. It might be due to the high positive correlation with physical strength task intensity.
Figure 2: Logistic regression results: Automation as a function of engineering bottlenecks

 Coef. Std. Err. z P>|z| [95% Conf. Interval]
 Dexterity -1.01 1.00 -1 0.313 -2.96 0.95
 Information Processing 7.17 1.24 5.8 0.000*** 4.7 9.6
 Problem Solving -5.60 0.84 -6.7 0.000*** -7.2 -4
 Teaching -4.61 1.06 -4.4 0.000*** -6.7 -2.5
 Serving/Attending -11.37 0.90 -13 0.000*** -13 -9.6
 Managing/ Coordinating -8.97 1.03 -8.7 0.000*** -11 -7
 Selling/Persuading 5.10 0.91 5.6 0.000*** 3.3 6.89
 _cons 8.74 0.82 11 0.000*** 7.1 10.4
 Number of obs. 1,182
 LR chi2(7) 560.3
 Prob > chi2 0.0
 Pseudo R2 0.3
 Log likelihood -532.4
Note: Significant at: *** p
R-squared 0.4 4.16 27.14 Adj R-squared 0.4 38.91 253.85 Source: Cambridge Econometrics analysis based on data from European Jobs Monitor Task Indicator dataset (Eurofound, 2016) and Nedelkoska and Quintini (2018) Caring and entertaining is not included as a separate task, however it is partially included in social serving and attending (Eurofound, 2016). The key assumptions in the analysis that follows are: some 2-digit occupations have a high potential of being automated in the medium term; the automation will start in 2025 and will affect, at the beginning, only the replacement jobs; and lower and middle educated workers in these occupations are more likely to be affected than higher educated ones. After applying the rules described in Section 0, 46% of the 2-digit occupations in the Cedefop Skills Forecast 2018 are susceptible to being automated (see list in Appendix A). To be consistent with the literature, the impact of automation is introduced from 2025 only on the demand for replacements jobs, i.e. demand based on workers retiring or exiting the occupation. This assumption is based on the fact that the methodology to identify occupations as automatable is based on automatable tasks and hence it is assumed that by 2030 individuals will still work in these occupations, but the technological advancements will reduce the time spent on some tasks i.e. due to changing task content in the occupation (in line with Bessen (2016)). Moreover, while overall the EU’s labour force is declining, Figure 4 shows that the share accounted for by higher educated individuals across all age groups has been increasing. Therefore, it is expected that it will harder to find lower and middle educated workers to replace retired ones. Furthermore, the difficulty in replacing retirees might push wages upwards which would, in turn, increase of the economic feasibility for automating the jobs they previously undertook. The Cedefop Skills Forecast is based on certain assumptions regarding ageing, technological change, and the changing composition of GDP (Cedefop, 2018). Replacing workers with automation would require investment. Like other studies, an assumption is made that investment in technologies will start when it becomes economically feasible, i.e. after the cost of the technical solution falls below the level of wages for a given occupation and is offset by reduction in labour force costs. Over the forecast period, the labour force in all age groups is expected to increase only in the higher educated group – see Figure 4. This future distribution of EU labour force by qualification is in line with the expected automation impacts on low- and medium-skilled jobs. Many studies in the literature (Nedelkoska & Quintini, 2018; McKinsey Global Institute, 2017; Bessen, 2016; OECD, 2017) found that the demand in low- and medium-skilled jobs will be negatively affected by the new developments in technology. Figure 4: Labour force growth rate by qualification and age band, 2016-2030 13
0.4

 0.3

 0.2

 0.1
 Percentage

 0 20-24

 -0.1 25-34
 35-49
 -0.2
 50-64
 -0.3

 -0.4

 -0.5
 Low Medium High
 Qualification

Source: Cedefop Skills Forecast 2018

A closer look at the younger cohort (20-34 years-old) in Figure 5 shows that the slow increasing trend
in the higher qualified group and the steady decreasing trend in the other two groups was already in
evidence at the beginning of the 2000s. Overall this age group is expected to decrease by almost 7% by
2030. In 2017, the 20-34 year-olds represented 21% of the EU population and almost one-third of the
20-64 years-old population. So, while the share in higher educated is slowly increasing, the overall
population in the age group 20-64 is expected to decrease by 4% by 2030. Harris et al. (2018) consider
that the ageing of the labour force leads companies and investors to draw increasingly on automation
technologies in order to boost productivity.
Figure 5: Labour force growth rate, 20-34, by qualification, average annual growth by 5
years

 14
0.04

 0.03

 0.02

 0.01
 Low
 Percentage

 0 Medium
 High
 -0.01
 Total
 -0.02

 -0.03

 -0.04
 2005 2010 2015 2020 2025 2030

Source: Cambridge Econometrics analysis based on Cedefop Skills forecast 2018

On the future demand side, Figure 6 shows the magnitude of employment demand for 1-digit
occupations over the period 2016-2030. The number of replacement and jobs created/lost is taken from
the Cedefop Skills Forecast 2018. The “Adjusted Cedefop Skills forecast 2018 – Replacements” shows
the reduction in the forecasted replacement demand (Cedefop Skills forecast - Replacements) due to
automation.

 15
Figure 6: Replacements and jobs lost/created, by occupation, 2016-2030

 Thousands
 -5,000 0 5,000 10,000 15,000 20,000 25,000

 1.Legislators, senior officials and managers

 2.Professionals

 3.Technicians and associate professionals

 4.Clerks
 5.Service workers and shop and market sales
 workers
 6.Skilled agricultural and fishery workers

 7.Craft and related trades workers

8.Plant and machine operators and assemblers

 9.Elementary occupations

 Cedefop Skills forecast - Jobs lost/created
 Cedefop Skills forecast - Replacements
 Adjusted Cedefop Skills forecast - Replacements
 Adjusted Cedefop Skills forecast - Replacements (without low/medium skills)

Source: Cambridge Econometrics analysis based on Cedefop Skills forecast 2018

The “Adjusted Cedefop Skills forecast 2018 - Replacements (without low/medium skills)” shows the
reduction in the forecasted replacement demand due to automation only for the jobs requiring lower-
and middle-qualification.

Figure 6 shows that three 1-digit occupations (managers, professionals and service and sales workers)
are unlikely to be affected by automation in the mid-term. Skilled trades workers and elementary
workers seem to be to ones more likely to be affected by automation by 2030. Except associated
professionals and elementary workers, all the occupations which are likely to be affected by automation
are also forecasted to see a decline in size of employment over the period (see Cedefop sSkills forecast
– jobs lost/created in Figure 6).

Overall, replacements jobs will be reduced by 18% compared with the Cedefop Skills Forecast 2018
replacements if the identified 2-digit occupations are affected by automation as indicated above. If only
the jobs requiring lower- and middle-qualifications are replaced then the reduction will be smaller, i.e.
14%. This estimate is in line with the latest estimate of jobs with high automation potential in the OECD
countries – 14% (Nedelkoska & Quintini, 2018).

The analysis of the future labour supply shows that there will be more highly qualified workers. In
Error! Reference source not found., the analysis of the future labour demand (affected or not by
automation) shows that most of the jobs to be created will require the highest qualification level.
Moreover, in the EU about four in five new job openings will be related to high-skilled occupations
(Cedefop, 2018).

 16
Figure 7: Replacements and jobs lost/created, by qualification, 2016-2030

 Thousands
 -20,000 -10,000 0 10,000 20,000 30,000 40,000 50,000 60,000 70,000

 1.Low

 2.Medium

 3.High

 Cedefop Skills forecast - Jobs lost/created
 Cedefop Skills forecast - Replacements
 Adjusted Cedefop Skills forecast - Replacements
 Adjusted Cedefop Skills forecast - Replacements (without low/medium skills)

Source: Cambridge Econometrics analysis based on Cedefop Skills forecast 2018

The share in the population and the future workforce of the middle educated remains high – almost 50%
(see Figures 2 and 3 in the previous section). The distribution of replacements jobs by educational
requirements in Error! Reference source not found. shows that most of the replacements jobs will
require a middle-qualification level and these jobs are also likely to be affected the automation. This
means that some of those in the middle-qualified group will have to either upskill or compete for low-
skilled jobs in a shrinking market for low-skilled labour. This could lead to skills mismatches, if
employers employ those who are more highly qualified at the expense of those doing the job now.
Moreover, the increase in the qualification level of the labour supply accompanying a decrease in
overall labour demand may well lead to more high qualified workers competing for those jobs that will
not be affected by automation. This abundance of labour supply will lead to a decrease in wages and
working conditions. Moreover, the pace at which displaced workers migrate toward higher-skilled jobs
is likely to be too slow to alleviate the wage inequality arising on the labour market (Harris, et al., 2018;
Bessen, 2016).
6. Conclusions
Previous technological revolutions reduced the demand for labour in old jobs and created new demand
for labour in new ones. This chapter has only looked at the existing jobs without any reference to the
new jobs that will be created as a result of automation. To be consistent with the literature, the impact
of automation is introduced from 2025, although at least in some tasks, the speed of diffusion and
likelihood of adoption of such technologies can be faster. The estimates are based on the fact that, given
the current state of knowledge, tasks related to social intelligence, cognitive intelligence and perception
and manipulation cannot be automated.
Given these assumptions, the results show that by 2030 there might be some job displacement (between
14-18% of employment) in occupations where automatable tasks are important. From the highest
demand occupations - i.e. expected to grow by 2030 in the Cedefop Skills forecast 2018 - only associate
professionals are likely to be affected by automation; thus, the projected demand for this occupation
might not be realised.
From the point of view of qualification level, most jobs displacement will take place in occupations
requiring a middle-level qualification. This group is the most affected because most of the forecast

 17
replacement jobs are in this group and the current analysis is based on the assumptions that only these
jobs will disappear in the mid-term due to automation.
Overall, 46% of existing 2-digit level occupations were identified being at risk from automation. Since
full replacement of workers in these occupations is not assumed in this chapter, then higher
complementarities between humans and machine is expected in the fulfilment of the tasks. Therefore,
an up-skilling and/or re-skilling of the current workforce might be needed to make the adaption to the
new working conditions easier and ensure that fewer jobs are displaced. Nedelkoska and Quintini (2018)
conclude that automation has proven much more likely to redistribute the demand for various skills and
jobs than to eliminate work altogether. Analysing the changes brought by computer automation since
the 1980s, Bessen (2016) reached the same conclusion with respect to occupations, i.e. computerised
occupations substituting for other occupations, shifting employment and requiring new skills.
More high-skilled workers are needed to work with the new technologies, however even the higher-
qualified workers might find it hard to find employment. Labour force up-skilling is already in progress,
i.e. a slow increase in the share of higher-qualified for all age groups is already observed and the upward
trend is expected to be maintained in all age groups. An analysis of the qualification level of 20-24 age
group shows that more than 60% have only middle-qualification level in 2017, while almost 40% of the
34-25 year-olds have higher qualification level. By 2030, over 40% of the entire 20-34 age group is
expected to be highly qualified. The 20-34 age group will have to face the challenges from automation
in the long run, not only the mid-term analysis here. It certainly begs questions about how to assist these
young people to make the transition from school to work and if having higher qualifications is the
answer. Another striking result from the analysis is that there could be potentially less demand for even
highly educated individuals since some of the identified occupations require people who are highly
educated. Therefore, up-skilling policies are not the only answer. If the share of the highly qualified in
the labour force will increase beyond 60% and not enough jobs for that qualification level materialises,
then there will be an abundance of highly qualified individuals competing either for the same job
requiring high level qualifications or for the relatively few low- or middle-wage jobs (not yet affected
by automation). Either way it will have a negative impact on wages and increase inequality.
The new Education and Training target will need to consider the less than optimistic employment
outlook from automation and, at the same time, deal with existing issues. While the EU has moved
closer to the Education and Training 2020 target of recent graduates in employment, the extent of skills
mismatches remains high, particularly among those with bachelor’s degree (European Commission,
2017). The over-qualification rate of 25-34 year-old tertiary education (ISCED 5 or 6) graduates in
employment is already quite high in the EU – around 26% in the last three years.13 Therefore, re-skilling
and re-education programmes are also required. McKinsey (2017) suggest for the future of work in
Europe, effective retraining will be critical for mid-career workers who will need to make a transition
into new occupations and different types of work. In which case, will the new EU Education and
Training 2025 strategy target of 25% of people engaging in learning throughout their lives by 2025 be
sufficient?

References
Ambrosetti Club, 2017. Technology and Labour: Steering the Change, Milan: The European House -
 Ambrosetti.

13
 http://skillspanorama.cedefop.europa.eu/en/indicators/over-qualification-rate

 18
Arntz, M., Gregory, T. & Zierahn, U., 2016. The Risk of Automation for Jobs in OECD Countries: A
 Comparative Analysis, Paris: OECD Social, Employment and Migration Working Papers, No.
 189, OECD Publishing.
Autor, D. H., 2016. Why are there still so many jobs? The history and future of workplace automation
 and anxiety, MIT Initiative on the Digital Economy: MIT IDE RESEARCH BRIEF VOL.
 2016.07.
Bárány, Z. L. & Siegel, C., 2018. Job Polarization and Structural Change. American Economic
 Journal: Macroeconomics, 10(1), p. 57–89.
Bessen, J. E., 2016. How computer automation affects occupations: Technology, jobs, and skills,
 Boston: Boston Univ. School of Law, Law and Economics Research Paper No. 15-49,
Brynjolfsson, E. & Mitchell, T., 2017. What can machine learning do? Workforce implications.
 Science, 358(6370), pp. 1530-1534.
Cedefop, 2018. Cedefop skills supply and demand forecast 2018. Presentation at the Cedefop 2018
 Skills forecast launch event, Brussels: Cedefop.
Cedefop, 2018. Forecasting skill demand and supply. [Online]
 Available at: http://www.cedefop.europa.eu/en/events-and-projects/projects/forecasting-skill-
 demand-and-supply
 [Accessed 07 August 2018].
Cedefop, 2018. Reaching out to ‘invisible’ young people and adults, Thessaloniki: Cedefop Briefing
 Note.
Cedefop, 2018. Skills Forecast: key EU trends to 2030. [Online]
 Available at: http://skillspanorama.cedefop.europa.eu/en/analytical_highlights/skills-forecast-
 key-eu-trends-2030#_skills_forecast__key_eu_trends_to_2030
 [Accessed 07 August 2018].
Davies, R., 2015. Industry 4.0: Digitalisation for productivity and growth, Brussels: European Union
 - European Parliamentary Research Service.
Dellot, B. & Wallace Stephens, F., 2017. The age of automation: Artifcial intelligence, robotics and
 the future of low-skilled work, London: The RSA Future Work Centre.
Eurofound, 2016. What do Europeans do at work? A task-based analysis: European Jobs Monitor
 2016, Luxembourg: Publications Office of the European Union.
Eurofound, 2018. Automation, digitalisation and platforms: Implications for work and employment,
 Luxembourg: Publications.
Eurofound, 2018. Game changing technologies: Exploring the impact on production processes and
 work, Luxembourg: Publications Office of the European Union.
Eurofound, 2018. Projected wage and task structure. Presentation at "Future Jobs, Current
 Challenges", Cedefop 2018 Skills forecast launch event, Brussels: Cedefop.
European Commission, 2012. Education and Training Monitor 2012, Luxembourg: Publications
 Office of the European Union.
European Commission, 2016. COMMUNICATION FROM THE COMMISSION TO THE
 EUROPEAN PARLIAMENT, THE COUNCIL, THE EUROPEAN ECONOMIC AND SOCIAL
 COMMITTEE AND THE COMMITTEE OF THE REGIONS A NEW SKILLS AGENDA FOR
 EUROPE. Brussels: Official Journal of the European Union COM/2016/0381 final.
European Commission, 2017. Commission adopts initiative to boost apprenticeships in Europe.
 [Online] Available at:
 http://ec.europa.eu/social/main.jsp?langId=en&catId=89&newsId=2873&furtherNews=yes
 [Accessed 29/05/2018 May 2018].
European Commission, 2017. Education and Training Monitor 2017, Luxembourg: Publications
 Office of the European Union.

 19
European Commission, 2017. Future of Europe: Towards a European Education Area by 2025 (Press
 release). [Online] Available at: http://europa.eu/rapid/press-release_IP-17-4521_en.htm
 [Accessed 31 May 2018].
Fernández-Macías, E. & Hurley, J., 2017. Routine-biased technical change and job polarization in
 Europe. Socio-Economic Review, 15(3), pp. 563-585.
Frey, C. & Osborne, M., 2013. The Future of Employment: How Susceptible are Jobs to
 Computerization?, Oxford: Oxford Martin Programme on Technology and Employment,
 University of Oxford.
Gathmann, C. & Schönberg, U., 2010. How General Is Human Capital? A Task‐Based Approach.
 Journal of Labor Economics, 28(1), pp. 1-49.
Harris, K., Kimson, A. & Schwedel, A., 2018. Labor 2030: The Collision of Demographics,
 Automation and Inequality. [Online]
 Available at: https://www.bain.com/insights/labor-2030-the-collision-of-demographics-
 automation-and-inequality
 [Accessed 07 August 2018].
International Federation of Robotics, 2017. The impact of robots on productivity, employment and
 jobs, Frankfurt: International Federation of Robotics.
McKinsey Global Institute, 2017. A Future That Works: Automation, Employment, And Productivity,
 s.l.:
 http://www.mckinsey.com/~/media/McKinsey/Global%20Themes/Digital%20Disruption/Har
 nessing%20automation%20for%20a%20future%20that%20works/MGI-A-future-that-works-
 Full-report.ashx.
McKinsey Global Institute, 2017. Digitization, AI and the future of work: Imperatives for Europe,
 Briefing Note prepared for the European Union Tallinn Digital Summit, September 2017:
 McKinsey & Company.
McKinsey Global Institute, 2017. Jobs lost, jobs gained: Workforce transitions in a time of
 automation, s.l.: McKinsey & Company.
Nedelkoska, L. & Quintini, G., 2018. Automation, skills use and training, Paris: OECD Social,
 Employment and Migration Working Papers, No. 202, OECD Publishing.
OECD, 2017. Getting Skills Right: Skills for Jobs Indicators, Paris: OECD Publishing.
OECD, 2017. OECD Skills Outlook 2017: Skills and Global Value Chains, Paris: OECD Publishing.
PwC, 2016. Industry 4.0: Building the digital enterprise, s.l.: PwC.
PwC, 2017. Will robots steal our jobs? The potential impact of automation on the UK and other
 major economies, s.l.: Available here: https://www.pwc.co.uk/economic-
 services/ukeo/pwcukeo-section-4-automation-march-2017-v2.pdf.
Wolter, M. I. et al., 2016. Economy 4.0 and its labour market and economic impacts, s.l.: IAB
 Forschungsberichte (Research Reports).
World Economic Forum, 2016. The Future of Jobs: Employment, Skills and Workforce Strategy for
 the Fourth Industrial Revolution, s.l.: World Economic Forum.

 20
You can also read