The Office Sector in New York City
←
→
Page content transcription
If your browser does not render page correctly, please read the page content below
The Office Sector in New York City
New York City is a major center for global
Highlights business. More than 250,000 businesses are
• New York City’s office sector employed a total located in the City, and 43 of the companies
of 1.6 million people in 2019, the highest level included in the S&P 500 Index have headquarters
on record. Office sector employment makes up located here, the highest number of any city.
about a third of all City jobs, compared to a Companies with a global presence have a
quarter in the rest of the State and in the nation. significant impact on the City’s economic activity.
• In FY 2021, office market property values The industries that make up the City’s office
reached $172 billion and billable values (the sector employ large numbers of people and,
market value on which property tax is levied) particularly before the COVID-19 pandemic
reached $71 billion. Both figures had more than began, use large portions of office space. As a
doubled over the past 10 years. result, the City has the world’s largest office
property market by area.
• Office employment in the City fell 5.7 percent in
2020, while total employment dropped The City is home to two of the largest central
11.1 percent, with many shifting to remote work. business districts in the world, and between 2011
• The office sector is responsible for an outsized and 2021, strong demand more than doubled the
portion of the City’s economic activity. In 2019, total market value of office properties to reach a
the sector contributed $705 billion total of $172 billion. Due to higher assessment
(66.2 percent) of the City’s gross product. rates, these properties supply more than a
• Office market demand has begun to reflect the quarter of the City’s property tax revenue. Since
impact of the pandemic. Asking rents are down the pandemic began, however, use of this office
4.2 percent in the second quarter of 2021, while space has changed dramatically. Stay-at-home
vacancy rates are at 18.3 percent, a level not orders forced many office workers to shift to
seen in over 30 years in New York City. remote work, as businesses reliant on in-person
interactions with customers were forced to reduce
• The full market value of office buildings fell
$28.6 billion citywide on the FY 2022 final capacity or remain closed for extended periods.
assessment roll, the first decline in total office As a result, the total market value of office
property market values since at least FY 2000. buildings fell 16.6 percent citywide in fiscal year
(FY) 2022, the first decline in more than 20 years.
• Office real estate decline made up 54.9 percent
of the reduction in overall billable values The new and prolonged remote work
(5.2 percent), and more than half of the $1.7 arrangements have raised questions about the
billion decline in property taxes in FY 2022. future of office space. Employers are assessing
• Manhattan alone had 463.8 million square feet how they use shared office space while
of office inventory as of the second quarter of considering shifts in worker preferences and the
calendar year 2021, accounting for nearly feasibility of long-term remote work. Some
11 percent of all office space in the nation. businesses have already instituted permanent
hybrid remote-work arrangements, and others are
• In FY 2021, the office sector provided an
estimated $6.9 billion in direct revenue in contemplating similar plans. As these
property taxes, real estate transaction taxes, developments unfold, the future of office real
mortgage taxes and commercial rent taxes. estate is largely uncertain.
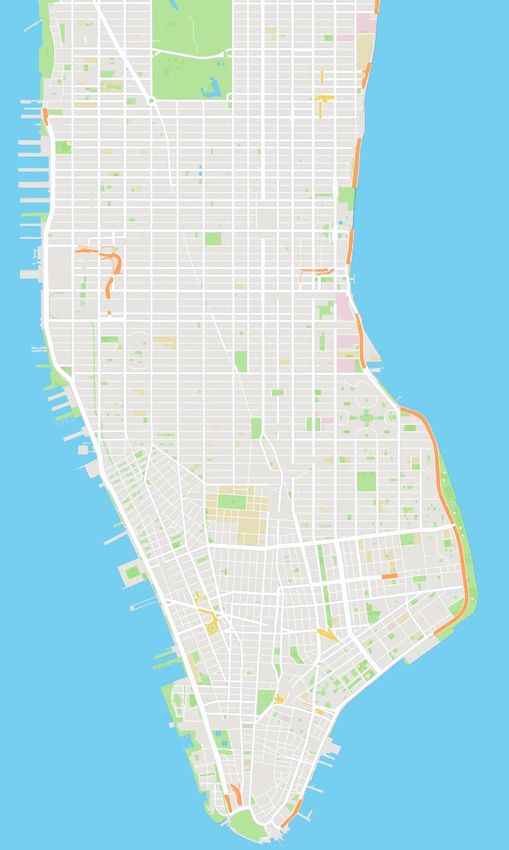
Report 11-2022 | October 2021 1Office Sector Employment FIGURE 1
While many industries provide at least some jobs Office Submarkets in Manhattan
that take place in an office setting, the primary
occupiers of office space are in the industries of
professional and business services (46.7 percent
of the office sector), finance and real estate
(30.5 percent), information and technology Midtown
(13.9 percent) and government (8.9 percent).
This report collectively refers to these as the
office sector. 1 Since the early 2000s, office sector
jobs have consistently accounted for more than
one-third of the City’s total employment,
compared to one quarter in the rest of New York
State and in the nation. The majority of office jobs
are in Manhattan. Of the three major business Midtown
districts in Manhattan (Midtown, Midtown South, South
and Downtown; see Figure 1), the majority of
office sector jobs are located in Midtown, which
has more than two-thirds of the total.
Ten percent of New York City office jobs were
lost in the recession between 2000 and 2003 (an
annualized loss of 2.6 percent), and employment
had not yet fully recovered before the 2008
financial crisis (see Figure 2). That crisis led to
the Great Recession, during which the office
sector, particularly the financial services
Downtown
component, suffered steeper employment losses
(5 percent in 2009 alone). Because the recession
was sparked by the financial crisis, the financial
sector bore the brunt of job losses (see Figure 3). declined from 35.0 percent in 2000 to
Financial services’ share of office sector jobs 30.1 percent in 2019.
FIGURE 2 In the aftermath of the Great Recession, the
Office Employment in New York City economy experienced the longest and strongest
1.7 expansion since the 1950s (for further discussion,
1.6
see the Office of the State Comptroller’s (OSC’s)
1.5
2017 report on the City’s office market). 2 Office
Millions of Jobs
1.4
employment in the City grew steadily from 2009
1.3
to 2019 at an annualized rate of 2.0 percent,
1.2
reaching an all-time peak of 1.6 million jobs.
1.1
1.0
2000
2001
2002
2003
2004
2005
2006
2007
2008
2009
2010
2011
2012
2013
2014
2015
2016
2017
2018
2019
2020
2021*
Year *Year-to-date
Sources: NYS Department of Labor; OSC analysis
2 Report 11-2022FIGURE 3 3.0 percent of jobs, while business services has
Shares of Jobs Lost in Economic Downturns been hit harder, with 7.3 percent of jobs lost (see
since 2000 Figure 4). Business services was more affected
2000-2003 2008-2009 2019-2021* by the pandemic because it has more jobs that
14% require employees to be on-site, such as janitorial
and maintenance services, mail and shipping
12%
centers, and travel agencies.
10%
Although office jobs accounted for 36.8 percent of
Share of Jobs Lost
8% all New York City jobs in 2020, they were
responsible for an outsized portion of the City’s
6% economic activity. In 2019, the office sector
4%
contributed $705 billion to the City’s gross
product based on data from the Bureau of
2% Economic Analysis. 4 This represented
66.2 percent of the City’s total annual output of
0%
Total Employment Total Office Financial Activities nearly $1.1 trillion.
Sources: NYS Department of Labor; OSC analysis *Year-to-date
The office sector includes more than 350 different
In 2020, as a result of the pandemic-induced
occupations. The most common type was in
recession, the number of office jobs fell
management, which accounted for almost a fifth
5.7 percent to 1.5 million (see Figure 4). Although
of office workers in New York City in 2019 (see
nearly 100,000 jobs were lost, the office sector
Figure 5). Other top occupations were in office
fared better than the citywide average and far
and administrative support (10.2 percent),
better than the sectors most affected by social
computers and mathematics (9.1 percent), sales
distancing restrictions, such as leisure and
(8.8 percent) and finance (8.7 percent). The most
hospitality (which lost 41.9 percent of its jobs).
common occupations outside of the office sector
Job losses have not been spread evenly across were home health aides, teachers, nurses, retail
the office sector. Financial activities has fared salespeople and cashiers.
better than the overall office average, with total
jobs down 4.1 percent compared to February Office sector workers are well-paid, with an
2020. 3 The information industry also had lower average annual salary of $183,900 in 2020. 5
job losses than the total office sector, at Even when excluding the financial securities
FIGURE 4
Office Sector Employment by Component, 2019-2021
Change Feb 2020 - Aug 2021
Employment Sector 2019 2020 2021*
Jobs Percent
Information and Technology 220,600 206,800 209,900 -6,900 -3.0%
Finance and Real Estate 485,100 469,800 458,800 -20,100 -4.1%
Professional and Business Services 772,300 709,400 702,500 -56,300 -7.3%
Government 134,200 134,200 134,500 2,800 2.1%
Total Office Employment 1,612,200 1,520,200 1,505,700 -80,500 -5.0%
Total Employment 4,650,100 4,133,500 4,104,300 -472,700 -10.1%
*Figures for 2021 based on year-to-date figures from the NYS Department of Labor’s Current Employment Statistics. Monthly figures are not seasonally adjusted.
Sources: NYS Department of Labor Current Employment Statistics; OSC analysis
October 2021 3FIGURE 5 FIGURE 6
Occupations in the Office Sector Selected Office Worker Characteristics
New York City, 2019 New York City, 2019
Office Workers
Salary Over
Occupation Share of Office Workers
$100,000 Other Workers
Management 19.5%
Earned at Least a
Office and Administrative Support 10.2% Bachelor's Degree
Computers and Mathematics 9.1%
Millennials (Ages
Sales 8.8% 25-40)
Finance 8.7%
Identify as White
Arts and Entertainment 8.6%
Business 8.3% 0% 20% 40% 60% 80%
Legal 5.9% Share of Workers
Sources: U.S. Census Bureau, American Community Survey; OSC analysis
Cleaning and Maintenance 5.3%
Remaining Occupations 15.6% time for the City’s office workers was 45 minutes,
Total 100.0% slightly higher than the citywide median of 40
Note: Remaining occupations include sciences and education.
Sources: U.S. Census Bureau, American Community Survey; OSC analysis
minutes and much higher than the national
median of 25 minutes. More than 333,034
industry, known for its generous compensation
workers were supercommuters (traveling more
packages, the average office sector salary is
than 60 minutes to work), and 93,188 were
$145,290. This is higher than the citywide
megacommuters (traveling more than 90 minutes
average ($110,190) and much higher than the
to work).
average for nonoffice jobs ($62,730).
The typical office worker in New York City tends
Office sector salaries have increased to: earn a significantly higher salary than a
25.3 percent since 2007, the peak before the nonoffice worker; have a bachelor’s degree; be a
Great Recession. However, after adjusting for millennial (those currently between the ages of 25
inflation, average salaries did not surpass 2007 and 40); and identify as White (see Figure 6). In
levels until 2020, and then by just 0.5 percent. In 2019, the median salary earned by office workers
contrast, average nonoffice salaries have grown was $80,000, double the median for all other
9.1 percent since 2007 when adjusting for workers ($40,000). More than a third (36 percent)
inflation. of office workers earned a salary of more than
$100,000, almost triple the share (13 percent) of
Worker Characteristics
other workers.
According to the U.S. Census Bureau, about
In addition to high pay, office jobs are more likely
1.6 million City residents worked in the office
than nonoffice jobs to offer health care benefits.
sector in New York City in 2019. 6 Office workers
The share of office employees with employer-
tend to exhibit different economic and
sponsored health insurance is 85 percent, much
demographic characteristics from nonoffice
higher than the share among nonoffice workers
workers.
(63 percent).
Office workers are less likely to reside in the City
Office workers are also more likely to be male
than workers in other sectors (70 percent
(58 percent), whereas 50 percent of all other
compared to 81 percent). As a result, office
workers are male. The lower share among all
workers tend to have longer commutes. Prior to
other workers is mainly due to the lower-than-
the onset of the pandemic, the median commute
4 Report 11-2022average share of men in the educational services FIGURE 7
and the health care and social assistance Share of Total Office Space Occupied by
sectors. Major Industries – Historical Trends
Office workers are also more likely to be younger, Industry 1990 2010 2020
with a median age of 39, compared to 41 for all Finance 48.8% 39.6% 35.6%
other workers. TAMI (Information) 16.7% 18.5% 25.1%
Hispanic workers accounted for the second- Professional & Business 14.1% 18.5% 15.5%
highest share of office workers, at 18 percent All Other 20.4% 23.4% 23.8%
(compared with 29 percent in other sectors), Sources: Cushman & Wakefield; OSC analysis
while Asian workers made up 15 percent (the share, this analysis focuses on office space for
same as in other sectors), and Black or African private companies. 7 The occupancy of rented
American workers made up 13 percent office space by these industries has changed
(compared with 21 percent in other sectors).
markedly over the decades (see Figure 7). For
The City’s office workers are less likely to be example, tenant occupancy by financial firms has
immigrants, as only one-third of office sector declined as a result of job losses, while
employees were immigrants compared to employment in TAMI firms grew 34 percent over
45 percent of nonoffice employees. Of immigrant the past decade.
workers in the office sector, the largest shares
Over the past 30 years, square footage usage
were from China (9.9 percent), India (8.9 percent)
has also diverged, with the financial industry
and the Dominican Republic (7.3 percent). Over a
utilizing less space per worker and TAMI and
fifth (21 percent) of immigrants in the sector came
professional services taking up more.
from Europe, almost double the share
(11 percent) in other employment sectors. The Data from Cushman & Wakefield, an international
share of immigrant office workers from Latin commercial real estate services firm, illustrates
America was 36 percent, much lower than the the changes to the City’s economy in recent
share in other sectors (53 percent). decades. In the 1990s, the financial industry
dominated office space, using nearly three times
Pre-Pandemic Office Space Use
the total space of the TAMI industry and more
The office sector (as defined in this report) is not than three times that of business services. From
a homogenous group of workers. The three main 2010 to 2020, the relative shares of these
industries within this sector are financial activities; industries changed (see Figure 8). While banks
technology, advertising, media and information and other financial firms still occupy the most
(TAMI); and professional and business services. office space, their usage per employee has
Though government also comprises a significant declined by 13.4 percent. At the same time, the
FIGURE 8
Office Space Square Footage Utilized Per Employee in Major Industries
Change Change
Sector 1990 2010 2020
1990-2020 2010-2020
Financial Activities 421.4 430.1 372.5 -11.6% -13.4%
TAMI (Information) 278.8 403.1 420.5 50.9% 4.3%
Business Services 116.7 174.5 129.1 10.6% -26.0%
Total 268.4 313.9 276.7 3.1% -11.8%
Sources: Cushman & Wakefield; OSC analysis
October 2021 5TAMI industry now utilizes 4.3 percent more As two of the three major office industries are
space per employee than it did in 2010. During occupying less space per worker than a decade
the same period, professional services ago, and the industry that is increasing space per
experienced strong job growth (a 16.7 percent worker is seeing less than average growth, there
increase), but by 2020 used 26.0 percent less is a significant risk to office market demand.
space per worker. These factors suggest that property owners will
need to find effective solutions to address the
Job growth in the TAMI industry is expected to rising vacancies and increased inventory levels
continue in the coming years. In 2016, the New resulting from reduced demand, discussed in
York City Economic Development Corporation detail below.
announced its LifeSci NYC initiative, a
$500 million plan to create 16,000 life sciences Historically, employment in the office sector is a
jobs in the City. As a home to leading tech firms, key driver of demand for office space. As the
medical research centers, academic institutions, work forces of businesses in the sector grow,
and pharmaceutical and biotech companies, the they require more space to operate (see
City has all the necessary components to support Figure 9). However, among the myriad impacts of
this emerging industry. In 2021, spurred by the the COVID-19 pandemic is the shift of many
success of the program to date, the total planned workers from in-office to remote work. By 2020,
investment was doubled to $1 billion, with plans long-term trends in office space usage indicated
to develop additional life science space and that some firms may have been finding ways to
support a total of 40,000 jobs. cut administrative costs and utilize space more
efficiently and productively. This suggests that
The City’s Office of Management and Budget some companies are fundamentally reconsidering
forecasts annual employment growth in the their office space requirements.
financial industry at 1.3 percent over the five-year
period ending in 2025. Business services How Remote Work Sustained
employment is forecast to grow at 4.3 percent Office Employment During
annually, outpacing the expected total private COVID-19
sector growth rate of 3.8 percent. The information Telework, or remote work, is not a new concept.
industry (a proxy for TAMI) is projected to grow However, its usage has historically varied by
3.4 percent annually, but it has only grown its class of worker (i.e., if the worker is self-
occupancy of space per employee by less than employed, works in the private sector, or works in
half a percent over the past decade. government) and wage level. According to the
FIGURE 9 Pew Research Center’s analysis of the U.S.
Office Employment and Real Estate Inventory Bureau of Labor Statistics’ National
1.7 470 Compensation Survey, between 2010 and 2020,
1.6 460 private industry workers nationwide with wages in
Millions of Square Feet
1.5 450 the highest 10th percentile were the most likely to
Millions of Jobs
1.4 440
have access to telework compared to all other
private industry workers, with 16 percent having
1.3 430
access even in 2010. 8 This group grew by seven
1.2 420
percentage points over the next 10 years to
1.1 410
23 percent in 2020. 9
1995
1997
1999
2001
2003
2005
2007
2009
2011
2013
2015
2017
2019
2021*
*Year-to-date
Office Employment (left axis) Office Inventory (right axis)
Sources: NYS Department of Labor; Jones Lang Lasalle; OSC analysis
6 Report 11-2022Prior to the pandemic, usage of remote work also FIGURE 10
varied nationally by establishment size and Office Entry Swipe Rates in New York City
industry type. According to the survey, 13 percent 100
Percentage of Pre-COVID Baseline
90
of establishments with 500 workers or more had 80
access to flexible workplace benefits in 2017, 70
compared to only 5 percent for those with fewer 60
50
than 100 workers. The difference suggests that 40
larger employers were more open to remote-work 30
arrangements prior to the pandemic (and also 20
10
may be more patient in requiring employees to 0
return to work).
Feb-20
Mar-20
Apr-20
May-20
Jun-20
Jul-20
Aug-20
Sep-20
Oct-20
Nov-20
Dec-20
Jan-21
Feb-21
Mar-21
Apr-21
May-21
Jun-21
Jul-21
Aug-21
Sep-21
As is currently the case, even in 2010 office Sources: Kastle Systems; OSC analysis
workers were more likely than other workers to
have access to teleworking options, with offices in New York City. As of the latest return-
management, business and financial occupations to-work survey from the Partnership for New York
having the greatest flexibility (starting at City, 41 percent of office employees were
18 percent in 2010 and peaking at 25 percent in expected to return to work by the end of
2020). This compares to an annual average of September 2021, down from the Partnership’s
8 percent of all private industry workers in the May estimate of 62 percent. 12
Northeast.
Telework has not been without its challenges,
When the pandemic began, offices around the however. Significant shares of Pew respondents
nation began closing rapidly. According to Kastle indicated that having an adequate workspace,
Systems, a security company that manages being able to get their work done without
access systems in select office buildings, keycard interruptions, and feeling motivated to do their
swipes in the City began to decline in the first work have all been very or somewhat difficult.
week of March 2020. 10 Though not all office This was especially true for those with school-age
buildings use Kastle’s systems, their data is a children and those earning relatively low incomes.
useful proxy for overall office occupancy. By mid-
April, Kastle data showed that office entry rates Partly due to these challenges, the embrace of
had fallen to less than 5 percent of the baseline remote work by the office sector has changed
level (see Figure 10). dramatically over the course of the pandemic.
Early in 2021, some office employers with a major
At a national level, the financial activities and presence in the City announced policies allowing
business services industries experienced large employees to work remotely at least on a part-
increases in the share of employed people time basis for the forseeable future (see
working from home between 2019 and 2020, by Figure 11).
40 and 25 percentage points, respectively. 11
Relatively small increases occurred in other Then, in May and June 2021 as COVID-19
sectors, such as the hospitality, transportation, infection rates fell to the lowest levels since the
retail and manufacturing sectors, as these beginning of the pandemic, many firms planned a
required face-to-face interaction and therefore September return to offices to coincide with the
remote work was often not possible. start of the school year. 13 This included the City
itself, which announced that all of its employees
As of late September 2021, Kastle data showed would be required to return to offices beginning
that only 28.9 percent of workers had returned to
October 2021 7FIGURE 11
Return-to-Work Plans for Major Private-Sector Office Employers and Tech Firms
in New York City
Company Return Date Return Format Vaccine Mandate
Bank of America September Unknown Encouraged, but not required
Required for employees currently in-office;
Bloomberg September Full-time or near full-time
no decision yet on all staff
Citigroup September 13 Flexible hybrid model Required
Credit Suisse September 7 Flexible hybrid model Encouraged, but not required
Deutsche Bank September 7 Flexible hybrid model Required
Goldman Sachs September 7 Full-time or near full-time Required
Encouraged, but not required – Twice
JPMorgan Chase July Full-time or near full-time
weekly testing for nonvaccinated staff
Morgan Stanley September 7 Flexible hybrid model Required
Time Warner September Unknown Required
Viacom October 18* 70% of employees in a hybrid model Encouraged, but not required
Amazon January 2022* Flexible hybrid model Encouraged, but not required
Apple January 2022* Flexible hybrid model Encouraged, but not required
Facebook January 2022* Flexible hybrid model Required
Google January 2022* Full-time or near full-time Required
Microsoft No set date Flexible hybrid model Required
*Delayed from an earlier planned date.
Sources: Commercial Observer; CNN Business; OSC analysis
September 13. However, the Delta variant of employers ranking it as a primary concern. In
COVID-19 has upended many of these plans. 14 particular, the survey found that employees have
voiced safety concerns as a result of increased
In addition to fears over the highly contagious hate crimes against Asian American people.
variant, mass transit issues continue to impact
the return of workers to the office. In the survey Office Real Estate
by the Partnership for New York City, 84 percent Many private commercial real estate firms
of employers reported that employee perceptions produce data on the office market. Those firms’
of mass transit are still an obstacle to returning to figures do not always align because of
the office because of concerns about personal differences in methodology and proprietary data,
safety, especially in and around public transit but there is agreement on overall market trends.
hubs like Grand Central and Penn Station. This is Because each offers a slightly different set of
supported by data from subway stations in data products, there is some variation between
Manhattan’s central business districts. Turnstile the data in some of the figures in this report
traffic at Grand Central Terminal, Penn depending on the source. We used data from the
Station/34th Street and Fulton Center stations firms Cushman & Wakefield, Jones Lang Lasalle,
was less than 40 percent of pre-pandemic levels CBRE, Colliers and Newmark.
in September according to OSC’s subway
ridership dashboard. 15 But while the majority of New York City houses the largest office real
employers recognize employee perceptions of estate market in the world by area. While there
mass transit, only 16 percent ranked public transit are commercial districts in each of the five
safety as a primary concern. boroughs, the three largest business districts are
in Manhattan (Midtown, Midtown South and
Safety concerns extend beyond public transit to Downtown). Together, they contained 464 million
crime and public safety, with 9 percent of square feet of office inventory as of the second
8 Report 11-2022FIGURE 12 at least 25 million square feet to come onto the
Largest Office Markets in the United States market by 2024.
First Quarter 2021
Market
Size (millions of Commercial real estate brokers designate office
square feet) space in New York City by classes based on
Manhattan 463.8
factors that include location and access to transit,
Washington, DC 336.4
building and security amenities, building
Chicago 256.2
infrastructure, and mechanical systems. Class A
Dallas 194.1
buildings are highly regarded assets that compete
Los Angeles 189.7
for premier tenants. The most high-end Class A
Houston 173.7
buildings are referred to as trophy buildings.
Boston 168.6
Examples include the new developments at
New Jersey 155.3 50 Hudson Yards, 390 Madison Avenue, One
Atlanta 153.5 Vanderbilt near Grand Central Terminal, and the
Philadelphia 138.8 One World Trade Center tower. These command
Sources: Jones Lang LaSalle; OSC analysis premium prices for their cachet, modern designs,
quarter of 2021 (see Figure 12). 16 This accounts views and amenities. Class B buildings compete
for nearly 11 percent of all office space in the for a wider range of tenants, and tend to be older
nation. Office space in Manhattan alone is larger and have fewer high-end amenities.
than the amount in all other U.S. cities, and
Brooklyn and Queens have more than 64 million
Market Indicators Showed Stability Prior
square feet of combined office space, rivaling
to Pandemic
Silicon Valley in terms of size. 17 New York City’s office sector generally
The market value of all office properties in the experienced growth after the Great Recession
amid steady gains in office-using employment
City was $172 billion in FY 2021, accounting for
that peaked in the fourth quarter of 2019, as
52.9 percent of all Class 4 (commercial and
industrial) property in the City. Cushman & discussed above. The health of the office sector
real estate market is determined by the demand
Wakefield estimates that more than 13 million
for and supply of office space. Measurements of
square feet of office space is currently under
construction, and real estate firm Colliers expects health in the sector include average asking rents,
vacancy rates, total inventory, net absorption
(defined as the total square footage that became
FIGURE 13
Manhattan Office Market Indicators
Average Asking Rent Total Inventory Net Absorption Under Construction
Year Vacancy Rate
(all classes) (square feet) (square feet) (square feet)
2015 $ 71.58 8.5% 394,693,400 4,474,300 12,087,300
2016 $ 72.82 9.3% 396,941,600 2,558,000 12,493,000
2017 $ 72.25 8.9% 398,983,700 7,413,100 13,301,700
2018 $ 72.28 9.2% 401,028,700 10,402,900 15,359,100
2019 $ 73.41 11.1% 408,857,500 2,555,800 13,558,400
2020 $ 73.16 15.2% 404,682,400 -15,277,800 14,748,600
2021 (Q2) $ 70.26 18.3% 405,592,200 -11,275,400 13,331,800
Note: Figures are for the fourth quarter of each year, except net absorption, which is for the full year. For 2021, the most recent available data
is the second quarter.
Sources: Cushman & Wakefield; OSC analysis
October 2021 9occupied minus the total that became vacant), 1.2 million square foot renewal at One New York
and square footage under construction (see Plaza.
Figure 13).
Market Indicators Reflect COVID Impact
Based on available data, vacancy rates hovered
at an annual average of 9.0 percent over 2015 to The office sector began experiencing measurable
2018. The vacancy rate did tick upward by two changes in demand in the second quarter of
percentage points in 2019, due to record delivery 2020, when new leasing in Manhattan fell to
of new space (more than 7 million square feet in 2.5 million square feet, 75 percent below the level
the fourth quarter alone). Over the period, high one year earlier. Together, TAMI and financial
vacancy rates coincided with low net absorption, services accounted for more than half the
driven by the low demand for office properties. demand for new leases of spaces that were
10,000 square feet and greater. 19 Renewal
Average asking rents for all building classes held activity fared better at 7.2 million square feet, a
steady in 2018. Despite the increase in decrease of 8.5 percent from 2019. According to
vacancies, asking rents grew by 1.6 percent in CBRE, a third of leases at large Manhattan
2019 due to the high prices of new properties. buildings will be expiring over the next three
years, leaving about two-thirds to be renewed
In addition to the indicators listed above, new starting in 2024.
leasing and renewal activity also provide insight
on the health of the market. New leasing in 2019 Average asking rents showed little change in the
totaled 34.7 million square feet, the third early stages of the pandemic, then spiked in the
consecutive year with more than 30 million third quarter of 2020 as the One Vanderbilt trophy
square feet of new leasing. 18 Tech companies property came online and set records for asking
such as Facebook and Amazon helped spur the prices. However, asking rents began to fall
increase in activity, with Facebook leasing significantly in the fourth quarter of 2020. By the
1.5 million square feet throughout 50 Hudson second quarter of 2021, asking rents were down
Yards and Amazon leasing approximately 4.2 percent from the prior year.
339,000 square feet at 460 West 34th Street in
2019. Though all of the Manhattan office market
experienced declines, the effects were not spread
Renewals in the fourth quarter of 2019 totaled evenly among the component submarkets (see
2.8 million square feet, led by Morgan Stanley’s Figure 14). The Midtown South office market
fared worse than Midtown or Downtown, as
FIGURE 14
Manhattan Office Performance in Major Business Districts
2020 Q1 through 2021 Q2
Average Asking Overall Vacancy Asking Rent Vacancy Rate
Net Absorption
Rent (all classes) Rates Change Change
Market
Percentage Points Total
2020 Q1 2021 Q2 2020 Q1 2021 Q2 (20 Q1-21 Q2)
(20 Q1-21 Q2) (20 Q1-21 Q2)
Midtown $76.45 $73.79 12.3% 19.0% -3.5% 6.7 -15,708,900
Midtown South $76.79 $68.96 8.5% 17.5% -10.2% 9.0 -6,115,700
Downtown $62.42 $60.13 10.6% 17.0% -3.7% 6.4 -4,839,400
Manhattan Total $73.57 $70.26 11.3% 18.3% -4.5% 7.0 -26,553,100
Note: Net absorption total includes areas outside of major business districts.
Sources: Cushman & Wakefield; OSC analysis
10 Report 11-2022asking rents fell at more than twice the rate in FIGURE 16
those submarkets. Manhattan Office Properties Vacancy Rate
1986-2021*
Class A asking rents increased in Midtown and 20
18
Midtown South and remained steady in 16
Vacancy Rate
14
Manhattan overall in the second quarter of 2020, 12
suggesting that high-priced space was minimally 10
8
affected by the pandemic initially. This trend 6
4
continued in the third quarter before asking rents 2
0
began declining in the fourth quarter of 2020, led
1986
1988
1990
1992
1994
1996
1998
2000
2002
2004
2006
2008
2010
2012
2014
2016
2018
2020
by additional sublease spaces coming on the
Year *Year-to-date
market and putting downward pressure on prices
Sources: NYC Office of Management and Budget; Cushman & Wakefield; OSC
even for Class A buildings. This trend continued analysis
through the second quarter of 2021. 30 years (see Figure 16), reflecting the
Falling demand can be seen clearly in the net expectations of fewer in-office employees.
absorption of office space. Net absorption had While both direct and sublease vacancies have
been softening even before the onset of the grown during the pandemic, the sublease supply
pandemic, but that trend has strengthened and has increased at a faster rate as a result of office
extended to seven consecutive quarters of tenants making strategic decisions to offload
negative absorption in the office market (see unused office space in a hybrid-work world.
Figure 15). Whether tenants will pursue these subleases only
Negative net absorption will drive vacancy rates as a short-term strategy until the pandemic
upward as more office space remains abates or decide to fundamentally and
unoccupied. In the first months of the pandemic permanently restructure their workspaces has
the vacancy rate increased only slightly, from profound implications for demand in the New
11.1 percent in the fourth quarter of 2019 to York City office market.
11.9 percent in the second quarter of 2020. This Reduced demand for office space caused the
trend then accelerated rapidly over the next market values of all office properties to drop by
several months, reaching 18.3 percent vacancy $28.6 billion (16.6 percent) in the City’s final
by the second quarter of 2021. The current assessment of real properties for FY 2022. This
vacancy rate is at a level not seen in more than contributed to an overall decline in billable values
FIGURE 15 of 5.2 percent, the first decline in more than 20
Total Quarterly Net Absoption of Office Space years. Though office properties represented
New York City 26.2 percent of billable values, they were
6 responsible for 54.9 percent of the overall decline
Millions of Square Feet
4
in FY 2022. Some of the City's most expensive
2
0
office properties dropped even further (see Figure
-2 17). For example, the market price of the World
-4 Trade Center complex dropped by 23.1 percent.
-6
-8 Investment companies that exclusively hold office
-10
properties in the City also underperformed,
2010 Q1
2010 Q3
2011 Q1
2011 Q3
2012 Q1
2012 Q3
2013 Q1
2013 Q3
2014 Q1
2014 Q3
2015 Q1
2015 Q3
2016 Q1
2016 Q3
2017 Q1
2017 Q3
2018 Q1
2018 Q3
2019 Q1
2019 Q3
2020 Q1
2020 Q3
2021 Q1
Sources: Jones Lang Lasalle; OSC analysis
October 2021 11FIGURE 17 FIGURE 18
Change in Market Value of the Most Expensive Performance of Major REITs in New York City
Office Properties in New York City 120
Percent of Pre-COVID baseline
FY 2022 Final Roll Compared to FY 2021
100
Property Change
80
World Trade Center -23.1%
General Motors Building -15.8% 60
Bank of America Tower -16.1%
40
MetLife Building -9.4%
Empire State SL Green Vornado
McGraw-Hill Building -0.1% 20
Jan-20
Feb-20
Mar-20
Apr-20
May-20
Jun-20
Jul-20
Aug-20
Sep-20
Oct-20
Nov-20
Dec-20
Jan-21
Feb-21
Mar-21
Apr-21
May-21
Jun-21
Jul-21
Aug-21
Sep-21
Solow Building -10.4%
Burlington House -5.5%
Sources: Yahoo Finance; OSC analysis
111 Eighth Avenue -7.4%
AXA Financial Center -4.4% budgets for Sanitation, Fire, Transportation, and
One Manhattan West -1.9%
Parks and Recreation departments, combined.
Top 10 Properties Total -12.5% This is a conservative estimate that does not
Sources: NYC Department of Finance; OSC analysis include secondary and indirect contributions,
experiencing weakness in their share prices as a including sales and personal income tax impacts.
result of the pandemic. Three real estate
investment trusts (REITs) with extensive office The City’s largest and most stable source of tax
property holdings in the City (SL Green Realty, revenue is the real property tax, which is levied
Vornado Realty Trust and the Empire State on the assessed value of commercial and
Realty Trust) all saw market values decline by at residential real estate. In FY 2021, the City
least 40 percent in 2020 (see Figure 18). The collected $31 billion in property taxes, which
REITs have shown significant improvement in accounted for nearly half (48.0 percent) of all tax
2021, though the spread of the Delta variant has revenues. Because property taxes are paid based
caused additional declines in recent months. All on assessments from the prior year, FY 2021
three remain below their pre-pandemic levels. property tax collections grew despite reduced
demand in the real estate market, as they were
Impact on Tax Revenue based on assessments made early in 2020.
The office sector contributes significantly to the
Property taxes are calculated based on the
City’s tax revenues in many complex ways. Direct
assessment and market value of real estate in the
and quantifiable taxes from the office sector
include property taxes and real estate transaction
FIGURE 19
taxes. Indirect and difficult-to-quantify effects
Office Sector Direct Tax Contributions to New
include sales taxes from office-worker spending York City Revenue
and personal income taxes from residents who (in millions)
choose to live in New York City to enable shorter FY 2020 FY 2021
Tax
commutes. This analysis focuses on the office Collections Collections
market’s direct tax implications on the City. Property Tax $5,880.9 $6,323.2
Property Transfer Tax 209.8 100.5
OSC estimates that in 2021 the City’s office Mortgage Recording Tax 251.5 115.3
sector will provide at least $6.9 billion in direct Commercial Rent Tax 406.0 395.3
revenue in property taxes, real estate transaction Total $6,748.2 $6,934.3
taxes, mortgage taxes and commercial rent taxes Sources: NYC Department of Finance; NYC Office of Management and
(see Figure 19). This revenue exceeds the annual Budget; OSC analysis
12 Report 11-2022FIGURE 20 FIGURE 21
New York City Office Properties Office Property Sales Volumes and Share
Billable Values and Share of Total Billable Values 25 25
80 29
70 28
Percentage Share of Total
20 20
Percent of Share of Total
60 27
Billions of Dollars
Billions of Dollars
50 26 15 15
40 25
10 10
30 24
20 23
5 5
10 22
0 21 0 0
2000
2001
2002
2003
2004
2005
2006
2007
2008
2009
2010
2011
2012
2013
2014
2015
2016
2017
2018
2019
2020
2021
2022
2004
2005
2006
2007
2008
2009
2010
2011
2012
2013
2014
2015
2016
2017
2018
2019
2020
2021
Fiscal Year Fiscal Year
Billable Value (left axis) Share of Total (right axis) Office Property Sales (left axis) Share of Total (right axis)
Sources: NYC Department of Finance; OSC analysis Sources: NYC Department of Finance; OSC analysis
City. Class 4 properties (i.e., commercial real origination of a mortgage for a property). The City
estate such as office and retail buildings) are collected $1.0 billion in transfer taxes and $816
assessed at a much higher rate than Class 1 (i.e., million in mortgage taxes in FY 2021, the second
residential) properties, and therefore comprise an year of declines due to pandemic impacts (down
outsized share of the collections. a total of 31.6 percent from FY 2019). OSC
estimates that $216 million of these taxes
In FY 2021, office buildings accounted for (11.9 percent of the total) was generated by office
12.6 percent of the market value of properties on properties, less than half of the $461 million
the City assessment roll, but more than a fourth (21.9 percent) generated in FY 2020.
(26.2 percent) of the billable taxable values at
$71.0 billion (see Figure 20). Put into perspective, The City does not disclose the relative shares of
property taxes from the office sector raise more in different property types that account for these
taxes than any other property type taxes, but all property transactions are recorded
subcomponent, including single-family homes, in the Automated City Register Information
multifamily rental buildings, condominium/ System (ACRIS). The total dollar volume of office
cooperative units and retail properties, despite an property sales for FY 2021 is at the lowest level
aggregate market value that trails each. Office since FY 2010 (see Figure 21), when office sales
sector property taxes nearly surpassed total were suppressed because of the lingering effects
citywide sales tax revenues in FY 2021, though of the financial crisis. In FY 2021, office
they are not expected to do so in FY 2022 properties accounted for 6.5 percent of all sales
because lower property valuations will reduce recorded in ACRIS, compared to an average of
overall collections. Property tax collections are 13.9 percent for fiscal years 2011 through 2020.
expected to decline by 5.4 percent, or $1.7 billion, The City anticipates that transaction taxes will
in fiscal year 2022, more than half of which is due resume growth in FY 2022, though residential
to drops in office billable values. Tax grievance sales are expected to drive that growth more than
assessment reductions also ticked up in 2021. commercial transactions.
Office properties also contribute to tax revenues Finally, office properties contribute to revenues
via the real property transfer tax (collected on the via the commercial rent tax, which is collected on
sale of property from one owner to another) and commercial properties in Manhattan below 96th
the mortgage recording tax (collected on the Street. Given the geographic targeting of this tax,
October 2021 13office properties comprise a high share of influence considerations of the best use of
collections. Commercial rent tax collections physical space in the coming months and years.
peaked in FY 2019 at $907 million, then declined
in the next two fiscal years to reach $841 million While it is difficult to compare the New York City
in FY 2021. This rate of decline (7.3 percent over office market to other cities given its sheer size,
two years) was smaller than for most other taxes, vacancies and the rate of return to offices
and the City expects collections to recover by suggest it is currently lagging behind most other
FY 2023. OSC estimates that office properties large U.S. cities. Nevertheless, significant leasing
accounted for $395 million in commercial rent tax and purchase deals have continued, particularly
collections in FY 2021, nearly half of the total. among technology firms. The leasing and
purchase of space that is easily reconfigurable,
Outlook and Monitoring and the subleasing of space to reduce the length
While the COVID-19 pandemic forced workers to of commitments, suggest that firms are still
shift from performing their professional duties in grappling with the pandemic’s impact on their
offices to performing them elsewhere, the operations, adding more uncertainty and
increased flexibility around the location of work necessitating patience in terms of crafting policy.
has allowed the office-using sector to be a The City’s tentative asessment roll for FY 2023,
stabilizing force in the labor market. to be released in January 2022, will provide
Nevertheless, this flexibility has presented further insight on the potential duration and
challenges for the office real estate, especially magnitude of the impact on City finances.
since the fourth quarter of 2020, when asking
The large volume of vacant office space and a
rents began to fall and vacancy rates began to
chronic shortage of affordable housing has led to
rise as a result of reduced demand for office
dialogue converting space into residential
space in a new hybrid-work environment.
housing. While several proposals were introduced
Given deep uncertainty over the fate of the office in the State Legislature, only the Housing Our
sector, policy makers should be careful not to Neighbors with Dignity Act has been passed so
assume too much about the potential state of the far. The act aims to convert commercial space to
office market at this point in time when informing make available rent-stabilized, affordable housing
long-term policy regarding the industry. The City to low-income households and those
should also continue to take steps to enhance experiencing homelessness. However, the act
safety, enliven public spaces and reduce friction does not override local zoning or building code
in commutation to help workers feel comfortable requirements that currently prevent office-to-
in returning to the Central Business District. residential conversions.
Employment in the sector has remained healthy More conversation will follow, especially as a new
and is expected to continue to return, which will normal for office workers is established. The City
likely support future demand for space. Multiyear must monitor overall employment and the real
leases extending into 2023 and healthier balance estate market to ensure it is adjusting to changing
sheets of property owners, as compared to Great office needs, and to identify ways to mitigate
Recession levels, have also provided some short- negative impacts on tax revenue and the
term stability in the office real estate market. economy. These discussions should consider the
However, the continuation of the pandemic, firmer potential implications for the City’s economic
changes to commuting patterns, increasing diversification and tax structure to ensure the City
subleases and vacancies, and the return of economy and revenues remain stable and can
demand for residential space are likely to return to pre-pandemic levels and grow.
14 Report 11-2022Endnotes
1
The office sector includes the following codes from the U.S. Census Bureau’s North American Industry Classification System (NAICS): 51-
Information, 52-Finance, 53-Real Estate, 54-Professional, Scientific, and Technical Services, 55-Management of Companies and
Enterprises, 56-Administrative and Support Services, and 92-Public Administration, excluding 922-Justice, Public Order, and Safety
Activities. These industries (excluding government) are commonly referred to as “supersectors” in the following groupings: Information
(NAICS 51), Financial Activities (NAICS 52 & 53), and Business Services (NAICS 54, 55 & 56).
2
OSC, New York City’s Office Market, Report 10-2017, February 2017.
3
New York State Department of Labor, Current Employment Statistics. Figures are not seasonally adjusted.
4
U.S. Bureau of Economic Analysis, Gross Domestic Product by County, 2019.
5
New York State Department of Labor, Quarterly Employment of Census and Wages. Because of data limitations, average salaries refer to
jobs in the private sector only.
6
U.S. Census Bureau, American Community Survey, 1-year file for 2019.
7
Cushman & Wakefield provided some historical data, but a complete dataset was not available for calendar year 2000. The public sector is
included, where applicable, in this analysis as “All Other” because of data limitations.
8
Drew Desilver, “Before the Coronavirus, Telework Was an Optional Benefit, Mostly for the Affluent Few,” Pew Research Center, March 20,
2020, at www.pewresearch.org/fact-tank/2020/03/20/before-the-coronavirus-telework-was-an-optional-benefit-mostly-for-the-affluent-few/.
9
U.S. Bureau of Labor Statistics, Employee Benefits Survey, accessed September 28, 2021.
10
Cision PR Newswire, “Kastle Back to Work Barometer,” June 22, 2020,
https://mma.prnewswire.com/media/1194781/Kastle_BacktoWorkBarometer_Graph.jpg?p=publish.
11
U.S. Bureau of Labor Statistics, 2020 American Time Use Survey. Data for the Information sector was suppressed because it did not meet
publication standards.
12
Partnership for New York City, “Return to Office Results Released – August 2021,” August 25, 2021, https://pfnyc.org/news/return-to-office-
results-released-august-2021/.
13
Tom Acitelli, “Return-to-Office Plans: When Companies Are Planning to Go Back,” Commercial Observer, September 9, 2021,
https://commercialobserver.com/2021/09/return-to-office-plans-companies-labor-day-october/.
14
Moira Ritter, “Here Are the Companies Rushing Workers Back to the Office — And the Ones That Aren't,” CNN Business, June 21, 2021,
www.cnn.com/2021/06/19/business/return-to-office-company-policies/.
15
OSC, “Impact of the COVID-19 Pandemic on Subway Ridership in New York City,” https://www.osc.state.ny.us/reports/osdc/impact-covid-
19-pandemic-subway-ridership-new-york-city.
16
Jones Lang Lasalle, “U.S. Office Market Statistics, Trends & Outlook,” July 21, 2021, www.us.jll.com/en/trends-and-insights/research/office-
market-statistics-trends.
17
For Brooklyn, see CBRE, “Brooklyn Office Marketview Q2 2021,” www.cbre.us/research-and-reports/Brooklyn-Office-MarketView-Q2-2021.
For Queens, see Newmark, “Long Island City Office Market Q2 2021,” www.nmrk.com/insights/market-report/long-island-city-market-
reports. For Silicon Valley, see Jones Lang Lasalle, “U.S. Office Market Statistics, Trends & Outlooks” (note 17). CBRE and Newmark are
private commercial real estate firms.
18
Cushman & Wakefield, “Manhattan Office MarketBeat Q4 2019,” www.cushmanwakefield.com/en/united-states/insights/us-
marketbeats/new-york-city-area-marketbeats.
19
Cushman & Wakefield, “Manhattan Office MarketBeat Q3 2020” and “Manhattan Office MarketBeat Q4 2020,”
www.cushmanwakefield.com/en/united-states/insights/us-marketbeats/new-york-city-area-marketbeats.
Prepared by the Office of the State Deputy Comptroller for the City of New York
Brian McElwain, Associate Municipal Financial Analyst
Anita Yadavalli, Director, Bureau of Tax and Economic Analysis & Senior Economist
Amar Mehta, Principal Municipal Financial Analyst
Office of the New York State Comptroller Like us on Facebook at
110 State Street, Albany, NY 12236 Facebook.com/nyscomptroller
(518) 474-4044 www.osc.state.ny.us Follow us on Twitter @nyscomptroller
Follow us on Instagram @nys.comptrollerYou can also read