Gait Pattern, Impact to the Skeleton and Postural Balance in Overweight and Obese Children: A Review - MDPI
←
→
Page content transcription
If your browser does not render page correctly, please read the page content below
sports
Review
Gait Pattern, Impact to the Skeleton and Postural
Balance in Overweight and Obese Children:
A Review
Nili Steinberg 1, *, Dan Nemet 2 , Michal Pantanowitz 1,2 and Alon Eliakim 2
 1   Wingate College of Physical Education and Sports Sciences, Wingate Institute, Netanya 4290200, Israel;
     michalmirochnik@gmail.com
 2   Child Health and Sport Center, Pediatric Department, Meir Medical Center, Sackler School of Medicine, Tel
     Aviv University, Tel-Aviv 6100000, Israel; Dan.Nemet@clalit.org.il (D.N.); Eliakim.Alon@clalit.org.il (A.E.)
 *   Correspondence: knopp@wincol.ac.il; Tel.: +972-98639-245

 Received: 9 June 2018; Accepted: 26 July 2018; Published: 31 July 2018

 Abstract: The article reviews the biomechanical factors that may cause overweight/obese children to
 reduce their level of physical activity, while increasing their risk of overuse injuries and exercise-related
 pain. Recommendations would be to screen those children for any gait or postural impairments before
 they join any exercise program, and to provide them with specific gait treatments and/or physical exercise
 programs, in order to decrease their risk for future musculoskeletal injuries and pain.

 Keywords: childhood obesity; gait; postural balance; intervention program

1. Introduction
       Childhood obesity has become a major public health problem [1]. Overweight and obese children
present deficient gait patterns [2], insufficient postural control [3], increased forces/impacts applied to
the lower extremities [4], lower extremity mal-alignment [5], and reduced bone mineral density, which
may lead to increased incidence of overuse injuries and bone fractures [6].
       Childhood obesity is mainly associated with reduced physical functioning and disability, which
implies a negative impact on daily activities [7]. Intervention programs during childhood may provide an
opportunity to improve functioning and decrease disability, to optimize health, and to prevent chronic
diseases related to inactivity. The intervention programs should start at a young age, before the onset
of obesity-related degenerative musculoskeletal changes that are prevalent in obese adults [8]. Physical
activity intervention programs may improve obese children’s gross motor quotient and locomotor
skills acquisition; factors which are critical in physical activity participation during later childhood and
adolescence, and for reducing their higher risk for overuse injuries and exercise-related pain [8,9].
       Yet, multiple musculoskeletal discomfort and pain associated with physical activity may
seriously decrease the motivation to exercise and limit the performance of obese children during
locomotion [9,10]. When obesity is combined with increased musculoskeletal pain or disorders,
the obesity cycle is perpetuated by encouraging sedentary behavior for prolonged periods. Therefore,
it is particularly important to identify the associations among childhood obesity, gait pattern, physical
activity/inactivity, and intervention programs [11].

2. Methods
    A search of medical literature databases was conducted for manuscripts published from their
inception until March 2018 (Medline/PubMed and SportDiscus). The search was designed to have
maximum sensitivity in order to avoid missing any relevant papers. There were four parts to the search:

Sports 2018, 6, 75; doi:10.3390/sports6030075                                      www.mdpi.com/journal/sports
Sports 2018, 6, 75                                                                                     2 of 21

(i) Childhood obesity; (ii) biomechanics (e.g., gait analyses); (iii) musculoskeletal injuries; and (iv)
intervention programs. Within each component, MeSH terms and free text descriptors were combined
with the Boolean operator ‘OR’, and then the four components were combined with the Boolean
operator ‘AND’ (key words—postural balance, locomotion, temporospatial, injuries, mal-alignment,
etc.). Search yields were recorded, and the results exported to Endnote. The database search was
supplemented by forward and backward citation tracking of the included articles. In the backward
citation analysis, the reference lists of all included articles were examined for relevant studies. In the
forward citation analysis, all papers that cite the included papers were listed—this list was then
reviewed for relevant papers. Finally, the related-articles function within the PubMed was used to
identify similar papers for each of the included papers; and this list was reviewed for relevant papers.
      Papers were included if they met the following criteria: (i) They concerned obese children or
adults; (ii) the subjects had no severe musculoskeletal injuries or had not had recent musculoskeletal
surgery; and (iii) the subjects had no medical cause for their obesity (e.g., hypothyroidism) or received
any medication that may cause obesity (e.g., corticosteroids). Eligible papers were written in English
and published in a peer-reviewed journal, with no limitation regarding publication year. Our exclusion
criteria meant letters, conference proceedings, case reports, brief reports, and abstracts were excluded.

3. Gait Pattern
      Normal gait: Walking is an important activity of daily living, and humans naturally walk at different
velocities [12]. Gait is a mode of bipedal locomotion, in which a period of double support (when both
feet are in contact with the ground) is followed by a period in which the body is supported by one lower
limb, while the other swings forward [13]. Gait pattern is mostly reported by temporospatial parameters,
including walking speed, stride time and length, and step time and length, as well as the duration of
the stance phase and the swing phase [14]. A step is one single step; while a stride is a whole gait cycle.
The step time is the time from one foot hitting the ground to the other foot hitting the ground. Step width
can be described as the mediolateral space between the two feet. The stance phase begins with the heel
strike—this is the moment when the heel begins to touch the ground, but the toes do not yet touch. In the
mid-stance phase, the foot settles along the lateral border, and, during the change from mid-stance to toe-off
stance, the five metacarpophalanges contact the ground. The toe-off phase is also named the propulsive
phase. When the stance phase ends, the swing phase begins [15].
      It is becoming increasingly apparent that childhood obesity is associated with reduced physical
functioning and disability, both of which have a negative impact on the walking and running ability of
these children [7]. Recently, Oliveira et al. [16] attempted to determine the cutoff points of moderate to
vigorous physical activity needed to prevent overweight and obesity. In boys, body mass index (BMI)
was found to be negatively associated with the number of steps the children walked per day and with
the amount of physical activity. Boys who walked ≤10,502 steps per day had a significantly higher
risk of being classified as overweight/obese child [16].
      Walking and running skills, like other motor skills, need to be acquired and practiced during early
childhood. Both of these natural skills have been described as easy to adopt, with low requirements
that can decrease sedentary habits and easily increase the level of physical activity [17,18].
      Table 1 shows a number of examples of significant differences in gait pattern between
overweight/obese children compared with normal-weight children. When examining gait pattern,
overweight children’s walking was described as different and less stable compared with that of their lean
counterparts [19–22]. In general, most studies reported that the gait of overweight children seems to involve
longer and wider steps, shorter single-limb support time and longer double-limb support times, shorter
swing times, and slower walking velocities compared to normal-weight children [19–21,23–26]. Hills and
Parker [27], for example, described the gait pattern of overweight children as characterized by increased
step width and a greater percentage of the gait cycle spent in stance. Dufek and colleagues [19] identified a
significantly slower walking velocity, lower percent of double support, lower percent of swing phase time,
and greater stance width in overweight children compared with their normal-weight counterparts [19].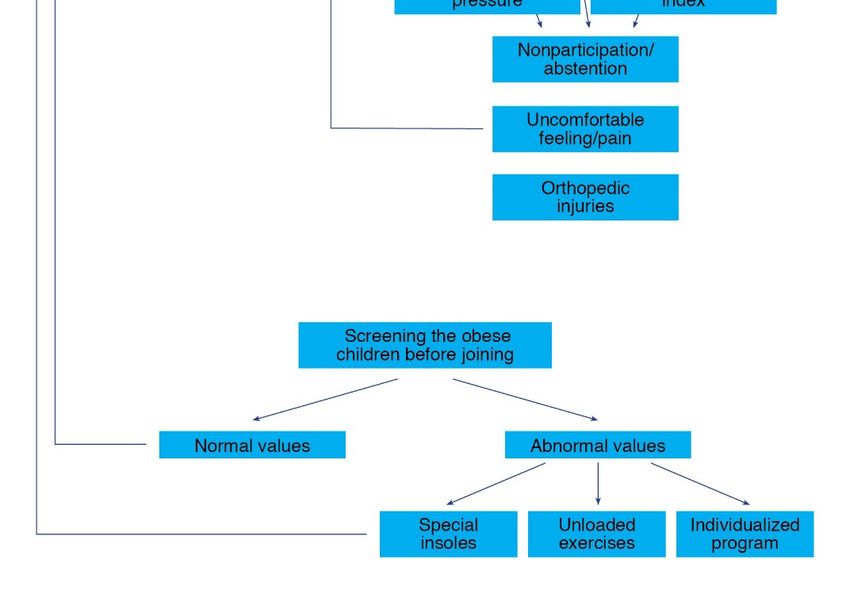
Sports 2018, 6, 75 3 of 21
Table 1. Examples for significant differences between overweight/obese children compared with normal weight children in gait pattern, impact/loads to the lower
extremities and the lower back, postural balance and malalignments, and injuries.
Authors Gr. Age BMI Measured Parameter Results
Gait Pattern
24.0 ± 3.1
Double support percent of cycle
OW 14.9 ± 1.2 95.5% 20.2 ± 3.3
Custom walkway software was used to visually inspect
38.1 ± 2.0
Dufek et al. [19] walkingTrial performed for completeness Swing phase percent of cycle
40.0 ± 1.2
NW 14.7 ± 1.5 57.9% 11.2 ± 3.5
Heel to heel stance width
8.8 ± 2.6
1.3 ± 0.1
OW 9.9 ± 1.3 24.3 ± 3.5 Cycle length
1.1 ± 0.18
Temporal parameters measured for 120% of the self-selected
Rubinstein et al. [28] 0.8 ± 0.1
preferred walking speeds Cycle time
0.7 ± 0.1
NW 9.9 ± 1.2 17.1 ± 2.0
0.5 ± 0.1
Stance phase time
0.4 ± 0.0
8.5 ± 1.5
Normalized COP Ant/post Excursion
7.0 ± 1.4
Anterior/posterior center of pressure measurements during
OW 8.2 ± 0.3 22 ± 4.6 16.7 ± 4.3
Hung et al. [29] picking up an empty box to waist height at a self-selected pace Speed of COP Move Anterior
12.2 ± 3.5
0.3 ± 0.1
COP Kept Anteriorly Time
0.01 ± 0.0
0.32 ± 0.06
Arch index
0.28 ± 0.04
OW 9.6 ± 1.6 23.7 ± 3.0
7.01 ± 3.35
Midfoot Relative regional impulse
5.56 ± 2.08
Yan et al. [30] Gait data (LT) such as arch index and foot balance parameters 13.8 ± 8.6
Maximum Heel strike phase
20.1 ± 11.7
NW 10.3 ± 0.7 17.1 ± 1.3 7.7 ± 7.7
Maximum Mid- stance phase
19.6 ± 10.4
10.8 ± 8.9
Propulsion phase
16.8 ± 12.7Sports 2018, 6, 75 4 of 21
Table 1. Cont.
Authors Gr. Age BMI Measured Parameter Results
Impact/loads to the Lower Extremities and the Lower Back
4.2 ± 0.9
OW 9.9 ± 1.3 24.3 ± 3.5 Contact area
Foot pressure parameters in lateral forefoot area in 120% of the 3.4 ± 1.2
Rubinstein et al. [28]
self-selected preferred walking speeds
172.5 ± 46.9
NW 9.9 ± 1.2 17.1 ± 2.0 Peak pressure
108.8 ± 42.7
22.4 ± 19.4
OB 7.2 ± 3.2 23.1 ± 3.3 Force time integral in midfoot
7.9 ± 6.7
Mueller et al. [31] Peak pressure measurements
512 ± 177
NW 7.0 ± 2.8 16.4 ± 1.5 Peak pressure (total foot) aged 12
409 ± 124
10.2 ± 5.6
OW 4.5 ± 0.8 18.6 ± 1.3 Force-time integrals in midfoot
Plantar pressures were assessed to characterize dynamic foot 5.5 ± 4.1
Mickle et al. [32] 2006
function 2.0 ± 0.7
NW 4.5 ± 0.7 5.8 ± 0.7 Pressure-timeIntegral in midfoot
1.6 ± 0.5
394.3 ± 112.1
Static peak force
278.1 ± 52.6
72.6 ± 17.3
Static peak area
51.5 ± 7.6
558.9 ± 119.3
Dynamic peak force
365.6 ± 61.8
101.1 ± 12.0
Dynamic peak area
Dynamic plantar pressure assessment with the subjects loaded 78.1 ± 9.9
Dowling et al. [33] OW 8.1 ± 1.2 >95%
with an additional 20% of their body mass
399.2 ± 91.9
Dynamic rear foot force
260.3 ± 38.4
39.3 ± 6.4
Dynamic rear foot area
25.1 ± 5.0
515.3 ± 89.5
Dynamic forefoot force
354.4 ± 60.8
50.0 ± 5.7
Dynamic forefoot area
41.3 ± 4.1Sports 2018, 6, 75 5 of 21
Table 1. Cont.
Authors Gr. Age BMI Measured Parameter Results
49.5 ± 7.7
OW 9.6 ± 1.6 23.7 ± 3.0 Midstance phase duration
Dynamic plantar pressure distribution: sub-phases during 43.1 ± 10.6
Yan et al. [30]
foot-ground contact duration (LT)
41.8 ± 7.8
NW 10.3 ± 0.7 17.1 ± 1.3 Propulsion phase
46.2 ± 9.2
Postural Balance
0.45 ± 0.60
Weight transfer time
0.21 ± 0.16
OW 9.3 ± 1.0 23.8 ± 3.1 36.2 ± 7.9
Rising index
44.8 ± 12.3
5.1 ± 0.9
Centre of gravity sway velocity
4.1 ± 1.1
22.1 ± 3.0
Deforche et al. [3] Balance Master, a computerized pressure plate system Steps width
19.5 ± 3.4
8.9 ± 1.8
Unilateral stance dominant leg
NW 9.3 ± 0.8 16.3 ± 1.2 10.0 ± 0.0
3.7 ± 1.8
Heel-to-toe walk
5.6 ± 1.2
10.3 ± 1.3
Five times up and down
8.6 ± 2.0
158 ± 26
Double support
142 ± 19
OW Adolesc. 40 ± 5
0.85 ± 0.13
Length of first step of gait initiation
0.87 ± 0.07
Colne et al. [34] Postural stability and gait initiation
1.36 ± 0.19
Peak of the post-ant velocity of CG
1.65 ± 0.09
NW Adolesc. 20 ± 2
1.69 ± 0.33
Mean velocity of the CP
1.83 ± 0.21
6–12 Mean = 28.2FI
92% OB Low Falling Index (FI) ≤ 36 points, moderate FI = 36–40 points,
Steinberg et al. [35] OW 8.8 ± 1.7 G Mean FI for NW = 36 points 27.6% mod. FI
8% OV severe FI ≥ 41points
9.6 ± 1.9 B 12% severe FISports 2018, 6, 75 6 of 21
Table 1. Cont.
Authors Gr. Age BMI Measured Parameter Results
24.5 ± 3.2
Bruininks/Oseretsky composite score
26.6 ± 2.5
OW 14.8 ± 2.4 21.4 ± 4.2 74.6 ± 7.0
Equitest SOT score *
73.7 ± 8.4
The Bruininks/Oseretsky sub-test of balance; the Equitest sensory 0.65 ± 0.21
Goulding et al. [36] Equitest SOT score *
organization test; and Balance Master limits of stability test 0.67 ± 0.25
5.66 ± 2.22
NW 14.9 ± 2.4 19.6 ± 2.6 Movement velocity *
5.35 ± 1.98
73.2 ± 8.5
Directional control *
75.0 ± 9.1
Malalignments and Injuries
−6.5 ± 4.6◦
OW 12.6 ± 2.7 36.4 ± 8.9 MDA (RT)
Malalignment: metaphyseal-diaphyseal angle (MDA) and −5.2 ± 3.9◦
Taylor et al. [37]
anatomic tibiofemoral angle (A-TFA)
>11%
NW 11.8 ± 2.9 19.6 ± 3.5 Abnormal MDA and A-TFA
05). GR = group; Adolesc = adolescents OW = overweight and obese children; OV = overweight; OB = obese children;
NW = normal weight; G = girls; B = boys.Sports 2018, 6, 75 7 of 21
In a study on running, by Rubinstein et al. [28], elongation of cycle length, increased cycle time,
increased stance phase time, increased relative stance phase, and a shorter relative swing phase were
found among overweight children compared to normal-weight children; in 80% and 100% of their
self-selected preferred running speeds, respectively. In running, similar to walking, the walking speed
was found to affect gait elements such as kinematic parameters, foot pressure, and spatio-temporal
parameters [23]; increased running velocity (from 80% to 100% self-selected running) increased the
cycle length and the relative swing phase among the overweight children [28].
It should be mentioned that most previous comparisons of running patterns between overweight
and normal-weight children described the physiological deficits of the overweight children, but not
the biomechanical characteristics of their running [40,41]. These physiological studies explained that
the running performance of overweight children showed higher oxygen consumption and greater
time to recover from exercise compared to that of normal-weight children [40]. The biomechanical
changes in gait pattern (walking and running) of the overweight children could be a compensation
strategy to reduce the energy cost required to lift, lower, accelerate, and decelerate their excess body
mass [24,42,43]. These movement deficits might reduce the energy expenditure during any physical
activity of overweight children, and may contribute to an imbalanced energy equilibrium [43,44].
During walking, overweight children might need a higher energy cost compared with their lean
counterparts, due to the higher muscle requirements for moving the body segments and maintaining
their stability, and for raising and accelerating body weight against gravity. The slower walking of the
overweight children, combined with a lower rhythm and a longer double-support phase, might be an
adopted walking strategy to avoid the increased metabolic cost and the increased mechanical work,
required for moving their excess body mass [24,42,43]. Furthermore, the double support percent of
cycle was found to be the most highly predictive of BMI%; hence, longer double support might serve
as a compensatory adaptation for a shorter period of single support during walking, which acts to
reduce the joint loads from a single-leg support [19].
Another explanation for the different temporal pattern of overweight children compared to
their lean counterparts is the reduced postural stability and the muscle weakness of the overweight
children [35]. The slower gait velocity, along with reduced postural stability, were explained by the
difficulty of overweight children in controlling the fall of the center of gravity, and that it is an adaptive
strategy to preserve equilibrium [34]. Muscle weakness, especially around the knee—a joint which
is prone to damage and injury, might cause different kinematics of the lower extremities during
the walking of overweight children [45]. The additional power requirement without appropriate
strength gains could lead to musculoskeletal fatigue, and contribute to the overall poor performance
of overweight children during fitness tests [5]. Therefore, it might be suggested that by improving
strength and stability in the ankle/foot area, overweight children could improve their gait parameters
as well. Furthermore, any improvement in muscle strength might decrease the occurrence of lower
extremity pain and discomfort, increase the physical activity level, and lead to improved fitness of
overweight children [46].
Recently, Hung and colleagues [29] explained that overweight and obese children organize
their whole body movement during a simple pick-up task differently than normal-weight children.
Their movement strategy may put them in a less stable condition, and thus make them prone to losing
balance. Other studies suggest that the dual task condition is more challenging for the overweight
and obese group than for the normal-weight group [47]. During a box-carrying task (dual task
condition), the overweight and obese children decreased their movement velocity even more than in
their simple walking condition. These findings suggest that decreasing velocity could help compensate
for the increased attentional demands required for completing activities with dual task constraints.
The overweight children should be aware of their movement control difficulties during everyday
movements, for their safety [29,47].Sports 2018, 6, 75 8 of 21
4. Impact/Loads to the Lower Extremities and the Lower Back
Repeated durations of dynamic activity with increased impact to the lower extremities and
the lower back can be beneficial to bone health, although this could also cause potential overuse
injuries [33,48]. Measurements of the impact to the lower limbs are mainly evaluated during gait
analysis, in parameters such as ground reaction forces (measured during the foot contact phase,
to obtain the speed and vertical displacements of the center of body mass), peak acceleration (peak
positive acceleration of the tibia), dynamic plantar pressure (providing information on dynamic loading
to the lower limb), and others [32,41,49].
In the general population, subjects with a history of tibial stress fracture were reported to have a
high loading rate of ground reaction forces, and a higher peak positive acceleration of the tibia than
those without this medical history [48]. Reducing the loading rate of ground reaction forces by 10–15%
was suggested for prevention and treatment of the stress fracture. Furthermore, monitoring the peak
positive acceleration during gait (by feedback, for example) can provide substantial information on gait
quality, and may reduce the risk of lower extremity injury [49]. Considering children, Tirosh et al. [49]
analyzed peak positive acceleration of the tibia at different gait speeds in children aged 7–12 years old,
and reported a significant increase in peak positive acceleration with increased gait speed [49].
Measuring the impact (ground reaction forces, peak positive acceleration, or dynamic peak
pressure) to the lower extremities and lower back among obese children can be useful for detecting
their risk for injuries [50,51]. Yet only a limited number of studies have measured the impact of these
in overweight children and adolescents during walking and running [30,33,52], with quite similar
results and conclusions in those studies. It was reported that the obese children exerted greater ground
reaction forces in the medial-lateral and anterior-posterior directions, and less ground reaction forces
in the vertical direction, compared to children of normal body weight [53]. The plantar pressure
measurements (such as contact area, peak pressure, and force time integral) were found to be higher,
especially in the mid-foot area, during the gait of obese children compared to that of normal-weight
children [31,32]. The continual bearing of excess mass was found to flatten the mid-foot region during
walking, with higher dynamic plantar pressures in the mid-foot and forefoot regions, compared to
the pressures in normal-weight children [27,52,54,55]. Significantly larger contact areas and larger
forces on the plantar surface, as well as increased peak pressures, increased peak forces, and higher
peak area under the fore-foot, mid-foot, and lateral heel, were found in overweight children during
walking compared to normal-weight children [28,30,32,33]. In running, similar to walking, parameters
such as peak pressure, maximum force, pressure time integral, and force time integral increased with
increasing running velocity, and were higher in overweight compared with normal-weight children [28].
When a backpack was carried by the overweight/obese children, altered plantar pressures similar to
that observed in normal-weight peers were found. Yet, the pressures were much higher among the
overweight/obese children compared with the lean children. This raises concerns regarding potential
long-term adverse consequences on foot structure and functionality, and supports establishing more
specific limits for the carried load [56].
Obese children are incapable of compensating for the extra body mass that leads to an equal
plantar load distribution across all foot regions, compared to non-obese children. The fact that the
peak pressure mostly affected the mid-foot and forefoot, and to a lesser extent the rear foot in these
children, might be an adaptation strategy to compensate for their additional body weight [31]. The hip
joint of obese children might also be at higher risk for injuries, due to greater compressive and shear
contact forces and loading rates compared to normal-weight children during walking [57].
Most studies suggest that the increased pressure/loads in obese children may increase loading on
the developing foot, and may result in foot discomfort and possibly deformity, which may increase the
risk of pain and injury [30,33,38,52,54,55,58]. As prepubescent children’s feet continue to develop and
mature, some of the higher loads/pressures during more vigorous weight-bearing locomotor activities,
such as running, might be associated with an even greater mass bearing on the developing feet, which
may increase the risk for foot pain and foot dysfunction [59]. In addition, a few studies reported thatSports 2018, 6, 75 9 of 21
the high loads/pressures along the lower extremities of overweight children were severe enough
to reduce their participation in physical activity programs, especially when they were required to
run [30,33,59]. This general pattern of increased impact/loads among obese children has caused some
clinicians to weigh the risk-benefit ratio of increased physical activity on the musculoskeletal system
in obese children [57]. Nevertheless, most previous studies recommended intervention programs
for both weight reduction and for reduced loads/impacts to the musculoskeletal system [30,33,57].
As the increased impacts/loads on the overweight child’s feet may occur when they are very young,
early assessment and intervention is required in these children to mitigate the development of
musculoskeletal complications associated with excessive body mass [60]. It is possible, however,
that screening for increased musculoskeletal and particularly foot impact/loads prior to participation
in weight-management exercise programs would identify those obese children at risk, so that necessary
precautions can be taken to improve their participation in such programs and reduce the risk of
overuse injuries.
Table 1 shows some numerical examples of significant differences between overweight/obese
children and normal-weight children in the impact/loads to the lower extremities and the lower back.
5. Postural Balance
Maintaining a stable posture is essential for many daily activities, as well as for injury prevention.
Postural balance is the act of achieving, maintaining, or restoring a state of balance during any posture
or activity [61]. Most daily activities involve components of static balance, as well as complex dynamic
movements [62]. Static postural balance is the ability to maintain a base of support with minimal
movement, whereas dynamic postural balance reflects the ability to perform a task while maintaining
or regaining a stable position [62]. Postural balance is controlled by using perceptual information
obtained from the environment by the peripheral sensory systems [63]. Maintenance of postural
balance requires an integration of the visual, vestibular, and somatosensory systems, in order to
coordinate the sensory perception of the body’s position and execute motor responses [61,64].
Among children, several factors may influence postural balance, including age, gender, and fitness
level [59,65]; however, the influence of weight on postural balance in children is not completely
understood [36]. It has been well documented that excessive body weight is inseparably connected to
postural instability and to body weight distribution [66]. The mass of the pendulum in obese children
is high, causing the muscles to generate torques of higher amplitude in order to maintain balance.
As obese children mostly suffer from decreased muscle tissue relative to the increased body weight,
their muscles often cannot respond quickly and strongly enough to the higher center of pressure (CoP)
displacement. The increased magnitude of the CoP combined with relatively weak muscles might
increase the risk of falling in obese children [36,56,67].
Several studies have suggested that obesity imposes significant constraints on balance
control [6,36]. For examples of significant differences between overweight/obese children and normal
weight children, see Table 1. It has been noted in the literature that compared to normal-weight children,
obese children have lower postural stability [3,34,35], greater sway area with greater instability [36,54],
and different postural strategies with reduced balance capabilities [56]. Due to the higher CoP speed
and greater postural instability of obese children, the time it takes them to correct their movements
during different tasks is much longer [68]. Furthermore, there is general agreement that compared
with normal weight children, obese children have a higher prevalence of perceived clumsiness [69],
coordination difficulties [70], and decreased motor skills [70]. The obese children manifested decreased
fine motor skill performance, mainly due to underlying perceptual-motor coordination difficulties,
as compared to their lean age-matched controls [6].
As the increased mass affects the mechanical and sensorial systems involved in postural control,
the central nervous system has to adapt its control actions to maintain balance [67]. Taking into
consideration the three systems controlling postural balance, removing visual feedback (e.g., standing
with closed eyes) dramatically reduced the postural balance of obese children compared to non-obeseSports 2018, 6, 75 10 of 21
children [35,54], although the natural tendency of all children (regardless of their weight) is to increase
postural sway with closed eyes [71]. Yet, in order to counterbalance their decreased postural sway,
obese children might be more dependent on vision than leaner children [54].
Another system that might be less effective in obese children is the somatosensory system [67].
The excessive pressure on the obese children’s feet might alter the activity of the plantar cutaneous
sensory receptors; this may reduce the sensory feedback required to coordinate the body’s position
and to maintain postural balance [67,72,73].
Falling Risk
Poor postural balance in obese children may be associated with more frequent falls and with a
higher risk of fractures [37,74]. As explained earlier, the increased mass forces the muscles to work
harder in order to maintain balance. However, if the muscles cannot respond quickly and strongly
enough, there is a high risk of falling [67].
In Steinberg et al. [35] it was found that 40% of the obese children had a moderate to severe falling
index (assessed by the Posturography device, which calculates the risk of falling with a proprietary
algorithm) compared to normal-weight children’s norms. Although some studies indicated that
overweight and normal-weight children have the same chances of falling [3], most studies reported
that obese children have a higher risk of falling and fractures than leaner children [36,63,75,76].
As discussed above, obese children demonstrated different gait patterns, with increased foot pressure
as compensation for their postural instability and as an attempt to slow themselves down in order to
avoid falling [34,54]. In addition, as obese children have a decreased ability to control falls compared
with their lean counterparts, it is expected that obese children will fall more frequently, with more
force, and in more awkward positions, which may increase the risk for fractures during their everyday
activities [6,69].
6. Malalignments and Injuries
Compared with normal-weight children, overweight children and adolescents were reported
to suffer more often from musculoskeletal discomfort, orthopedic deformities (such as scoliosis
and lumbar hyper-lordosis), skeletal diseases (such as osteoarthritis), injuries (e.g., bone fractures),
structural changes of the plantar surface, reduction in flexibility, and malalignment of the lower
extremities [5,9,37,38,74] (see Table 1). Early diagnosis of lower-extremity malalignment seems to be
crucial in obese children, in order to prevent future injuries/diseases such as osteoarthritis [77].
6.1. Fractures and Other Types of Injuries
Musculoskeletal pain was found to be more prevalent in overweight children and adolescents
compared with normal-weight children [37]. Over 60% of the obese children complained of at least
one joint (mostly the back, foot, or knee joint) pain more than once per month [78], with persistent
pain and swelling after injuries such as ankle sprain [79].
Considering injuries, Witt et al. [39] showed that children with higher BMI percentiles had a
significantly higher prevalence of extremity injuries. Obese and overweight children were reported to
have 25% more extremity fractures than non-obese children [80]. Most overweight children present
increased bone mineral density and increased bone cross-sectional area [81–83]. The greater bone
mineral density found in overweight children was expected to protect against fractures [81]. In contrast,
obese and overweight children had no difference in bone strength compared to lean children [84],
and even presented reduced bone strength, as determined by quantitative ultra-sound measurements
of bone speed of sound [85]. It might be argued that even an increased bone mineral density of
overweight children might not be sufficient enough to protect their bones from the significantly greater
forces and impact (caused by a fall with higher body weight) that are generated during falls [81,86].
The lower foot sensitivity of obese children, due to the higher plantar pressure, was also found to
be a risk factor for a variety of foot injuries [87]. In addition, the fact that the overweight childrenSports 2018, 6, 75 11 of 21
had impaired mobility may contribute further to their increased risk for falls and fractures [36,88].
It should be mentioned that overweight children mostly tend to fall from lower heights (as they avoid
rapid-movement activities and climbing activities), yet they exhibit a greater risk for fractures [88,89].
6.2. Malalignment
Early childhood obesity might be a particular risk factor for malalignment, and consequently for
orthopedic complications. The increased joint loading and joint forces before and during puberty place
the growing skeleton of the obese child under continuous pressure along that critical growth-spurt
period [90]. In the development of the lower extremity axis, greater vertical loads/pressure may lead to
abnormal bone growth and formation, causing malalignments and joint deformities [37]. Obesity was
found to negatively impact the foot structure, the lumbar spine, and the lower extremity joints (such
as in genu valgum and genu recurvatum) [77]. Around the knee joint, for example, Gushue et al. [91]
and Strutzenberger et al. [92] found that obese children have greater knee moments, causing greater
loading of the musculoskeletal structures compared to normal-weight children, which may cause
some bone deformities and malalignments, such as knee valgus [93]. Overweight/obese children were
also reported to have a significantly higher prevalence of flat foot [94] compared with lean children.
The lower plantar arch height caused by structural changes in their foot anatomy, as a result of excess
weight-bearing, continues throughout childhood and into adulthood [38,91,92]. Any malalignment in
overweight and obese children may lead to skeletal discomfort and pain [37].
Malalignment of the knee might be a risk factor for osteoarthritis [90,95,96]. Similar to obese
adults, where approximately 50% have knee cartilage lesions [97], obese children and adolescents
suffering from knee pain also showed morphological changes in their knee cartilage that may develop
into osteoarthritis later in life [98].
7. Intervention Programs
The different biomechanical factors reported in overweight children can be particularly important
when those children join exercise training programs, or increase their physical activity in an effort
to maintain or reduce body weight (see Table 2) [11,22,27,42,72,99–108]. As reported earlier in the
current review, overweight children have a different gait pattern, increased impact/loads to the lower
extremities, increased prevalence of joint malalignment, and postural balance deficits, compared with
normal-weight children. Any intervention exercise programs should be carefully designed in an
attempt to improve their gait pattern and their postural balance, and in trying to minimize their risk of
falls to prevent future musculoskeletal injuries and pain [9,17,18,46,103].
While interventions to improve movement skills in early childhood (pre-school children) appear
to be effective [109,110], less is known about their impact on movement characteristics (such as gait
pattern) in overweight school-aged children. Most intervention programs for school-aged children
focus on weight reduction and reinforcing healthy nutrition and eating habits, aiming at reducing
media use but not on improving biomechanical function [111–114]. Up to now, only a few studies have
examined the effect of strength training and neuromuscular exercise interventions on walking and
movement patterns, and on biomechanical gait characteristics of overweight children [22,100,106,108].Sports 2018, 6, 75 12 of 21
Table 2. Intervention programs for childhood obesity.
Duration of
Authors BMI Age Type of Intervention Main Findings
Intervention
Gait Pattern
Weight loss with reduced body circumferences causes
Weight loss intervention (fun-based exercise,
30.2 ± 3.3 10.7 ± 1.1 4 weeks mass-driven changes in joint kinematics and kinetics; yet, the
Huang [1] nutrition and behavior education)
spatiotemporal gait parameters did not change
Muscle strengthening (dynamic, Significant increases in absolute and relative muscle strength of
26.5 ± 1.5 10–12 years 8 weeks
resistance exercises) the lower extremities compared with controls
Huang et al. [101] Exercise weight-loss program 4 weeks Reduce stance phase after weight loss
Weight reduction program, including
Increased stride length with less leg muscle work to raise the
Peyrot et al. [42] M: 32.0 ± 3.9 F: 36.5 ± 5.4 12–16 years nutritional education, caloric restriction, and 12 weeks
center of mass after weight loss
physical activities
Improved foot pressure (at the heel, medial midfoot, lateral
Multidisciplinary program with midfoot, and lateral forefoot)
Steinberg et al. [22] 96.99 ± 2.14 percentile 9.4 ± 0.8 6 months
locomotion-emphasis exercises Improved temporal parameters (cycle length, stance phase
time, relative stance phase, and swing phase time)
Postural Balance
“Ball School Heidelberg”—A basic
Kuni et al. [103] F: 25.2 ± 3.6 M: 26.2 ± 2.8 6–12 years introduction to ball games for 6 months Ball games and nutrition counseling improved postural control
school children
weight management program (including
Steinberg et al. [108] 96.9 ± 2.3 percentile 6–14 years 6 months Improved postural stability and decreased falling probability
dietary intervention and exercise program)
Physical Fitness and Muscle Strength
High-intensity progressive Improvement in central and whole body adiposity in
Benson et al. [99] 8 weeks
resistance training association with improved muscle strength
Multidisciplinary residential obesity Treatment was found to be efficacious in generating a
treatment program including gross motor significant progress in gross motor co-ordination performance,
D’Hondt et al. [72] 29.1 ± 3.6 10.5 ± 1.4 and co-ordination exercises (assessed using 4 months with a greater increase in KTK score
the Körperkoordinationstest für The amount of relative weight loss explained 26.9% of the
Kinder—KTK) variance in improvement in overall KTK performance
Muscle strength training and neuromuscular
Horsak et al. [100] > 97th percentile 10–18 years 12 weeks -
exercises
Performance in all motor abilities tests improved (The AST-test
FITOC (Freiburg Intervention Trial for Obese
battery included two speed tests, one aerobic capacity test, two
Korsten-Reck Children) consists of a combination of
> 97th percentile 8–12 years 8 months strength tests and three coordinative tests)
et al. [102] organized sports, behavioral therapy and
The difference between the strength of the obese children and
nutritional advice
the strength of the reference group decreasedSports 2018, 6, 75 13 of 21
Table 2. Cont.
Duration of
Authors BMI Age Type of Intervention Main Findings
Intervention
Two groups: Day-Camp
Balance skills were improved post-camp in DCIA group
Intervention (DCIA), with a subsequent
compared to the SIA
Larsen et al. [104] 24.8 (22.8–27.1) 12.0 ± 0.4 family-based support program; and 52 weeks
Children from the SIA improved motor skills relative to the
low-intense Standard Intervention
DCIA children
Arm (SIA)
Multi-component Gross motor performance (such as squat jump and
treatment program focused on attaining a countermovement jump) and actual and perceived physical
Morano et al. [105] ≥95th percentile 9.2 ± 1.2 physically active lifestyle by increasing their 8 months abilities (perception of strength, speed and coordinative
actual and perceived competence in abilities) significantly improved 8 months after treatment in
performing motor tasks obese boys and girls
Physical fitness with motor abilities (such as
All physical fitness abilities improved over the
Sola et al. [107] 27.4 (24.8–29.3) 11.5 (9.0–12.5) balance, speed, agility, coordination 6–12 months
intervention period
and strength)
Walking Energetics
After weight loss, the increased walking economy was induced
by the lower metabolic rate of the isometric muscular
Peyrot et al. [42] 34.6 ± 5.1 12–16 years Obesity management program 12 weeks
contractions required to support the lower body weight and
maintain balance during walking
More stable and symmetrical gait pattern (better symmetry
Hills & Parker [27] - - Exercise and diet intervention 16 weeks indicators, step length and relative step); improved
body composition.
A do- based PA intervention that were
13% of all children who
motivated and supported to increase the Using pet dogs as the agent of lifestyle change in PA
participated were
Morrison et al. [106] 9–11 years frequency, intensity and duration of dog 10 weeks interventions in children and their parents is both feasible
overweight and 7%
walking using a number of behavior and acceptable
were obese
change techniquesSports 2018, 6, x FOR PEER REVIEW 13 of 21
In a previous study [22], it was indicated that overweight children who participated in a
Sports locomotion-emphasis
2018, 6, 75 program improved their gait pattern and decreased their foot loading during
14 of 21
both walking and running, when compared with overweight children who had no intervention
programs. The authors suggested that early assessment and intervention for improved gait and for
decreasing
In foot study
a previous pressure among
[22], it wasoverweight
indicatedchildren be required in
that overweight order towho
children reduce the risk of in a
participated
developing musculoskeletal
locomotion-emphasis program complications
improved their associated with and
gait pattern excessive body their
decreased mass foot
[22]. loading
In anotherduring
study, both weight-loss and muscle-strength training led to positive
both walking and running, when compared with overweight children who had no intervention changes in gait kinematics and
kinetics among overweight children; however, the temporal gait parameters of the overweight
programs. The authors suggested that early assessment and intervention for improved gait and
children did not change following weight loss [11]. It was also found that obese children participating
for decreasing foot pressure among overweight children be required in order to reduce the risk of
in physical activity intervention programs improved their postural balance, yet their postural balance
developing musculoskeletal complications associated with excessive body mass [22]. In another study,
following the intervention program was still lower than their normal-weight counterparts [108].
both Recently
weight-loss
Hanandandmuscle-strength
colleagues [115],training
in theirled to positive
systematic changes
review, in gait
showed kinematics
that and kinetics
overweight/obese
among overweight
children children;
have lower however,
levels of fundamentalthe temporal
movementgait parameters
skills of the overweight
than normal-weight children did
children. However,
not change following
interventions are weight
effectiveloss [11]. It wastheir
in improving also skills.
foundThe thatauthors
obese children participating
recommended in physical
these physical
exercise
activity intervention
intervention programs
programs in order to
improved break
their the vicious
postural cycle of
balance, yetchildhood obesitybalance
their postural (Figure following
1).
Finally, the impact/forces to the lower limbs of obese subjects were found
the intervention program was still lower than their normal-weight counterparts [108]. Recently Han to be inversely related
to lean mass,
and colleagues as well
[115], as to systematic
in their a low lean mass/fat
review, mass
showed ratiothat
thatoverweight/obese
could contribute to children
early leg muscle
have lower
fatigue. When considering intervention programs, it would be beneficial not only to reduce body
levels of fundamental movement skills than normal-weight children. However, interventions are
weight but also to increase lean the mass/fat mass ratio in obese children. Obese children need to be
effective in improving their skills. The authors recommended these physical exercise intervention
encouraged to take part in intervention programs that include physical exercise in order to lose
programs
weightinand
order
alsototobreak
preventthelower
vicious cycle of
extremity childhood
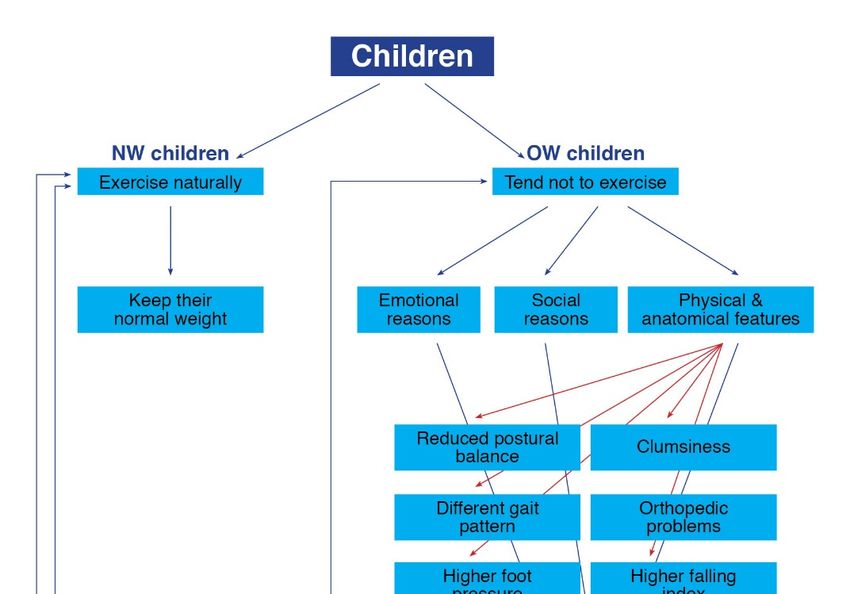
injuries [20]. obesity (Figure 1).
Figure 1. Vicious cycle of childhood obesity.
Figure 1. Vicious cycle of childhood obesity.
8. Conclusions and Clinical Implications
Finally, the impact/forces
A relatively to the of
high proportion lower limbs
children of obese
with subjects
overweight andwere found
obesity to be
exhibit inversely related
impairment of
to lean mass, as well as to a low lean mass/fat mass ratio that could contribute to
balance and gait patterns, increased foot pressure, and reduced bone strength, and as a result early leg muscle
they
fatigue.
haveWhen considering
an increased intervention
susceptibility programs,
to overuse injuriesitand
would be beneficial
the tendency not onlyfrom
to withdraw to reduce
weightbody
weight but also to increase
management programslean thattheinvolve
mass/fat mass ratio
physical in obese
activity. children.
Therefore, weObese children
believe need to be
that before
overweight/obese
encouraged children
to take part and adolescents
in intervention programsjoin any
thatphysical
includeactivity weight-management
physical program,
exercise in order to lose weight
the following
and also to prevent parameters should beinjuries
lower extremity considered
[20].(see Figure 2):
(1) Gait analyses: These analyses should identify gait impairments. If such deficiencies exist, these
8. Conclusions and
children Clinical
should Implications
participate in a specific program, such as a locomotion-emphasis program for
improving
A relatively biomechanical
high proportioncharacteristics
of children [28],
withprior to participation
overweight in the weight-management
and obesity exhibit impairment of
intervention. This program should focus mainly on improving the ankle-foot gait movements
balance and gait patterns, increased foot pressure, and reduced bone strength, and as a result they have
(e.g., exercises for improving ankle mobility and stability, improving postural balance,
an increased susceptibility to overuse injuries and the tendency to withdraw from weight management
programs that involve physical activity. Therefore, we believe that before overweight/obese children
and adolescents join any physical activity weight-management program, the following parameters
should be considered (see Figure 2):
(1) Gait analyses: These analyses should identify gait impairments. If such deficiencies exist, these
children should participate in a specific program, such as a locomotion-emphasis program for
improving biomechanical characteristics [28], prior to participation in the weight-managementSports 2018, 6, 75 15 of 21
intervention. This program should focus mainly on improving the ankle-foot gait movements
(e.g., exercises for improving ankle mobility and stability, improving postural balance, improving
proprioception ability, and strengthening muscles such as the calf muscles and the extrinsic and
intrinsic foot muscles).
Sports 2018, 6, x FOR PEER REVIEW 14 of 21
(2) Impact/loads to the lower extremities and the lower back: As increased impact/loads might
increase improving
the chance proprioception ability, and strengthening
for foot malalignment muscles such as
and musculoskeletal the calf interventions
injuries, muscles and the such as
visual extrinsic
biofeedback and intrinsic foot muscles).
gait retraining should be advised for these children. Furthermore, in order
(2) Impact/loads to the lower extremities and the lower back: As increased impact/loads might
to decrease plantar pressures beneath the feet, a potential implication for innovative children’s
increase the chance for foot malalignment and musculoskeletal injuries, interventions such as
footwear design
visual is suggested
biofeedback [46,87].
gait retraining should be advised for these children. Furthermore, in order to
(3) Postural balance
decrease assessment:
plantar pressures Safety
beneathmeasures to identify
the feet, a potential the overweight/obese
implication children who
for innovative children’s
footwear
suffer from designbalance
postural is suggested [46,87]. might decrease their chances of falling and of subsequent
deficiencies
(3) Postural
injuries duringbalance assessment:
participation Safety measures
in physical to It
activities. identify the overweight/obese
is important that the initial children
phaseswho of exercise
suffer from postural balance deficiencies might decrease their chances of falling and of
interventions focus on balance improvement (using exercise on stable and unstable surfaces,
subsequent injuries during participation in physical activities. It is important that the initial
with openphases and of closed
exerciseeyes, static and
interventions dynamic,
focus on balanceetc.) [108].
improvement (using exercise on stable and
(4) Bone strength: Bone strength
unstable surfaces, with open should be determined
and closed in order
eyes, static and to detect
dynamic, overweight/obese children
etc.) [108].
(4) reduced
with Bone strength:
boneBone strength[85].
properties should be determined
Children with in order to strength
reduced detect overweight/obese
and increased children
fracture risk
with reduced bone properties [85]. Children with reduced strength
should start intervention programs with non-weight-bearing exercises, such as bicycle and increased fracture risk
riding or
should start intervention programs with non-weight-bearing exercises, such as bicycle riding or
swimming [37], and gradually increase the amount of weight-bearing exercises.
swimming [37], and gradually increase the amount of weight-bearing exercises.
(5) Mal-alignments
(5) Mal-alignments and andprevious
previous injuries:
injuries:As mal-alignments
As mal-alignments and and previous
previous injuries
injuries maythe
may affect affect the
overweight/obese
overweight/obese children’s performance
children’s performance and
andincrease
increase the risk for
the risk fornew
newinjuries,
injuries, it suggested
it is is suggested that
thatorthopedic
a clinical a clinical orthopedic
examinationexamination
shouldshould be undertaken
be undertaken beforestarting
before starting an
anexercise
exercise program
program [87].
Individualized and gradually adapted exercise program should be implemented for for
[87]. Individualized and gradually adapted exercise program should be implemented each
each child.
child.
Figure 2. Screening the OW children.
Figure 2. Screening the OW children.Sports 2018, 6, 75 16 of 21
Funding: This research received no external funding.
Conflicts of Interest: The authors declare no conflicts of interest.
References
1. Karnik, S.; Kanekar, A. Childhood obesity: A global public health crisis. Int. J. Prev. Med. 2012, 3, 1–7.
[PubMed]
2. Lerner, Z.F.; Board, W.J.; Browning, R.C. Effects of obesity on lower extremity muscle function during
walking at two speeds. Gait Posture 2014, 39, 978–984. [CrossRef] [PubMed]
3. Deforche, B.I.; Hills, A.P.; Worringham, C.J.; Davies, P.S.; Murphy, A.J.; Bouckaert, J.J.; De Bourdeaudhuij, I.M.
Balance and postural skills in normal-weight and overweight prepubertal boys. Int. J. Pediatr. Obes. 2009, 4,
175–182. [CrossRef] [PubMed]
4. Tsiros, M.D.; Coates, A.M.; Howe, P.R.; Grimshaw, P.N.; Walkley, J.; Shield, A.; Mallows, R.; Hills, A.P.;
Kagawa, M.; Shultz, S.; et al. Knee extensor strength differences in obese and healthy-weight 10-to
13-year-olds. Eur. J. Appl. Physiol. 2013, 113, 1415–1422. [CrossRef] [PubMed]
5. Shultz, S.P.; D’Hondt, E.; Lenoir, M.; Fink, P.W.; Hills, A.P. The role of excess mass in the adaptation of
children’s gait. Hum. Mov. Sci. 2014, 36, 12–19. [CrossRef] [PubMed]
6. D’Hondt, E.; Deforche, B.; De Bourdeaudhuij, I.; Lenoir, M. Childhood obesity affects fine motor skill
performance under different postural constraints. Neurosci. Lett. 2008, 440, 72–75. [CrossRef] [PubMed]
7. Tsiros, M.D.; Coates, A.M.; Howe, P.R.; Grimshaw, P.N.; Buckley, J.D. Obesity: The new childhood disability?
Obes. Rev. 2011, 12, 26–36. [CrossRef] [PubMed]
8. Adamo, K.B.; Wilson, S.; Harvey, A.L.; Grattan, K.P.; Naylor, P.J.; Temple, V.A.; Goldfield, G.S. Does
intervening in childcare settings impact fundamental movement skill development? Med. Sci. Sports Exerc.
2016, 48, 926–932. [CrossRef] [PubMed]
9. Shultz, S.P.; Sitler, M.R.; Tierney, R.T.; Hillstrom, H.J.; Song, J. Effects of pediatric obesity on joint kinematics
and kinetics during 2 walking cadences. Arch. Phys. Med. Rehabil. 2009, 90, 2146–2154. [CrossRef] [PubMed]
10. Hootman, J.M.; Macera, C.A.; Ainsworth, B.E.; Martin, M.; Addy, C.L.; Blair, S.N. Association among
physical activity level, cardiorespiratory fitness, and risk of musculoskeletal injury. Am. J. Epidemiol. 2001,
154, 251–258. [CrossRef] [PubMed]
11. Huang, L. The Implications of Childhood Obesity on the Musculoskeletal and Locomotor Systems: Biomechanical
Analyses and Exercise Intervention; The University of Auckland: Philadelphia, PA, USA, 2014.
12. Smith, A.J.J.; Lemaire, E.D. Temporal-spatial gait parameter models of very slow walking. Gait Posture 2018,
61, 125–129. [CrossRef] [PubMed]
13. Al-Obaidi, S.; Wall, J.C.; Al-Yaqoub, A.; Al-Ghanim, M. Basic gait parameters: A comparison of reference
data for normal subjects 20 to 29 years of age from Kuwait and Scandinavia. J. Rehabil. Res. Dev. 2003, 40,
361–366. [CrossRef] [PubMed]
14. Wall, J.C.; Charteris, J.; Turnbull, G.I. Two steps equals one stride equals what? The applicability of normal
gait nomenclature to abnormal walking patterns. Clin. Biomech. 1987, 2, 119–125. [CrossRef]
15. Loudon, J.; Swift, M.; Bell, S. The Clinical Orthopedic Assessment Guide; Human Kinetics: Kansas City, KS,
USA, 2008.
16. Oliveira, L.C.; Ferrari, G.L.M.; Araujo, T.L.; Matsudo, V. Overweight, obesity, steps, and moderate to vigorous
physical activity in children. Rev. Saude Publica 2017, 51, 38. [CrossRef] [PubMed]
17. Carlin, A.; Murphy, M.H.; Gallagher, A.M. Do interventions to increase walking work? A systematic review
of interventions in children and adolescents. Sports Med. 2016, 46, 515–530. [CrossRef] [PubMed]
18. Logan, S.W.; Robinson, L.E.; Wilson, A.E.; Lucas, W.A. Getting the fundamentals of movement: A meta-analysis of
the effectiveness of motor skill interventions in children. Child Care Health Dev. 2012, 38, 305–315. [CrossRef]
[PubMed]
19. Dufek, J.S.; Currie, R.L.; Gouws, P.L.; Candela, L.; Gutierrez, A.P.; Mercer, J.A.; Putney, L.G. Effects of
overweight and obesity on walking characteristics in adolescents. Hum. Mov. Sci. 2012, 31, 897–906.
[CrossRef] [PubMed]
20. Hills, A.P.; Hennig, E.M.; Byrne, N.M.; Steele, J.R. The biomechanics of adiposity–structural and functional
limitations of obesity and implications for movement. Obes. Rev. 2002, 3, 35–43. [CrossRef] [PubMed]Sports 2018, 6, 75 17 of 21
21. McMillan, A.G.; Auman, N.L.; Collier, D.N.; Blaise Williams, D.S. Frontal plane lower extremity biomechanics
during walking in boys who are overweight versus healthy weight. Pediatr. Phys. Ther. 2009, 21, 187–193.
[CrossRef] [PubMed]
22. Steinberg, N.; Rubinstein, M.; Nemet, D.; Ayalon, M.; Zeev, A.; Pantanowitz, M.; Brosh, T.; Eliakim, A. Effects
of a program for improving biomechanical characteristics during walking and running in children who are
obese. Pediatr. Phys. Ther. 2017, 29, 330–340. [CrossRef] [PubMed]
23. Cimolin, V.; Galli, M. Summary measures for clinical gait analysis: A literature review. Gait Posture 2014, 39,
1005–1010. [CrossRef] [PubMed]
24. Huang, L.; Chen, P.; Zhuang, J.; Walt, S. Metabolic cost, mechanical work, and efficiency during normal
walking in obese and normal-weight children. Res. Q. Exerc. Sport 2013, 84, S72–S79. [CrossRef] [PubMed]
25. Plummer, P.; Apple, S.; Dowd, C.; Keith, E. Texting and walking: Effect of environmental setting and task
prioritization on dual-task interference in healthy young adults. Gait Posture 2015, 41, 46–51. [CrossRef]
[PubMed]
26. Sun, F.; Wang, L.J.; Wang, L. Effects of weight management program on postural stability and neuromuscular
function among obese children: Study protocol for a randomized controlled trial. Trials 2015, 16, 143.
[CrossRef] [PubMed]
27. Hills, A.P.; Parker, A.W. Gait characteristics of obese children. Arch. Phys. Med. Rehabil. 1991, 72, 403–407.
[CrossRef] [PubMed]
28. Rubinstein, M.; Eliakim, A.; Steinberg, N.; Nemet, D.; Ayalon, M.; Zeev, A.; Pantanowitz, M.; Brosh, T.
Biomechanical characteristics of overweight and obese children during five different walking and running
velocities. Footwear Sci. 2018, in press. [CrossRef]
29. Hung, Y.C.; Mangiafreno, M.; Gill, S.V. Whole body organization during a symmetric bimanual pick up task
in overweight and obese children. Gait Posture 2017, 52, 95–99. [CrossRef] [PubMed]
30. Yan, S.H.; Zhang, K.; Tan, G.Q.; Yang, J.; Liu, Z.C. Effects of obesity on dynamic plantar pressure distribution
in Chinese prepubescent children during walking. Gait Posture 2013, 37, 37–42. [CrossRef] [PubMed]
31. Mueller, S.; Carlsohn, A.; Mueller, J.; Baur, H.; Mayer, F. Influence of obesity on foot loading characteristics in
gait for children aged 1 to 12 years. PLoS ONE 2016, 11, e0149924. [CrossRef] [PubMed]
32. Mickle, K.J.; Steele, J.R.; Munro, B.J. Does excess mass affect plantar pressure in young children? Int. J.
Pediatr. Obes. 2006, 1, 183–188. [CrossRef] [PubMed]
33. Dowling, A.M.; Steele, J.R.; Baur, L.A. Does obesity influence foot structure and plantar pressure patterns in
prepubescent children? Int. J. Obes. 2001, 25, 845–852. [CrossRef] [PubMed]
34. Colne, P.; Frelut, M.L.; Peres, G.; Thoumie, P. Postural control in obese adolescents assessed by limits of
stability and gait initiation. Gait Posture 2008, 28, 164–169. [CrossRef] [PubMed]
35. Steinberg, N.; Nemet, D.; Kohen-Raz, R.; Zeev, A.; Pantanowitz, M.; Eliakim, A. Posturography characteristics
of obese children with and without associated disorders. Percept. Mot. Skills 2013, 116, 564–580. [CrossRef]
[PubMed]
36. Goulding, A.; Jones, I.E.; Taylor, R.W.; Piggot, J.M.; Taylor, D. Dynamic and static tests of balance and
postural sway in boys: Effects of previous wrist bone fractures and high adiposity. Gait Posture 2003, 17,
136–141. [CrossRef]
37. Taylor, E.D.; Theim, K.R.; Mirch, M.C.; Ghorbani, S.; Tanofsky-Kraff, M.; Adler-Wailes, D.C.; Brady, S.;
Reynolds, J.C.; Calis, K.A.; Yanovski, J.A. Orthopedic complications of overweight in children and
adolescents. Pediatrics 2006, 117, 2167–2174. [CrossRef] [PubMed]
38. Mickle, K.J.; Steele, J.R.; Munro, B.J. The feet of overweight and obese young children: Are they flat or fat?
Obesity 2006, 14, 1949–1953. [CrossRef] [PubMed]
39. Witt, C.E.; Arbabi, S.; Nathens, A.B.; Vavilala, M.S.; Rivara, F.P. Obesity in pediatric trauma. J. Pediatr. Surg.
2017, 52, 628–632. [CrossRef] [PubMed]
40. Mastrangelo, M.A.; Chaloupka, E.C.; Rattigan, P. Cardiovascular fitness in obese versus nonobese
8-11-year-old boys and girls. Res. Q. Exerc. Sport 2008, 79, 356–362. [CrossRef] [PubMed]
41. Saibene, F.; Minetti, A.E. Biomechanical and physiological aspects of legged locomotion in humans. Eur. J.
Appl. Physiol. 2003, 88, 297–316. [CrossRef] [PubMed]
42. Peyrot, N.; Morin, J.B.; Thivel, D.; Isacco, L.; Taillardat, M.; Belli, A.; Duche, P. Mechanical work and metabolic
cost of walking after weight loss in obese adolescents. Med. Sci. Sports Exerc. 2010, 42, 1914–1922. [CrossRef]
[PubMed]You can also read