Galactic cosmic ray modulation at Mars and beyond measured with EDACs on Mars Express and Rosetta
←
→
Page content transcription
If your browser does not render page correctly, please read the page content below
A&A 650, A165 (2021)
https://doi.org/10.1051/0004-6361/202140767                                                                                                               Astronomy
c E. W. Knutsen et al. 2021                                                                                                                                &
                                                                                                                                                          Astrophysics

Galactic cosmic ray modulation at Mars and beyond measured with
              EDACs on Mars Express and Rosetta
     E. W. Knutsen1,2 , O. Witasse2 , B. Sanchez-Cano3 , M. Lester3 , R. F. Wimmer-Schweingruber4 , M. Denis5 ,
                                           J. Godfrey5 , and A. Johnstone5

      1
          LATMOS/IPSL, UVSQ Université Paris-Saclay, Sorbonne Université, CNRS, Guyancourt, France
          e-mail: elise-wright.knutsen@latmos.ipsl.fr
      2
          European Space Agency, ESTEC, Noordwijk, The Netherlands
      3
          School of Physics and Astronomy, University of Leicester, Leicester, UK
      4
          Institute of Experimental and Applied Physics, Christian-Albrechts-University, Kiel, Germany
      5
          European Space Agency, ESOC, Darmstadt, Germany
     Received 9 March 2021 / Accepted 8 May 2021

                                                                                     ABSTRACT

     Galactic cosmic rays (GCRs) are an intrinsic part of the heliospheric radiation environment and an inevitable challenge to long-
     term space exploration. Here we show solar-cycle-induced GCR modulation at Mars in the period 2005–2020, along with GCR radial
     gradients, by comparing Mars Express and Rosetta engineering parameters to sunspot number time series. The engineering parameters
     used are the error detection and correction (EDAC) counters, cumulative counters that are triggered by charged energetic particles
     that cause memory errors in onboard computers. EDAC data provide a new way of gaining insight into the field of particle transport
     in the heliosphere; these data also allow us to complement dedicated radiation instrumentation as EDAC software is present on all
     spacecraft. This dataset was used to capture variations in GCRs in both space and time, yielding the same qualitative information as
     ground-based neutron monitors. Our analysis of the Mars Express EDAC parameter reveals a strong solar cycle GCR modulation, with
     a time lag of ∼5.5 months. By combining Mars Express with Rosetta data, we calculate a 4.7 ± 0.8% increase in EDAC count rates
     per astronomical unit, which we attribute to a radial gradient in GCR fluxes in accordance with established literature. The potential
     of engineering data for scientific purposes remains mostly unexplored. The results obtained from this work demonstrate, for the first
     time for heliophysics purposes, the usefulness of the EDAC engineering parameter, the usefulness of data mining, and the utility of
     keeping missions operational for many years, all of which provide complimentary data to nominal science instruments.
     Key words. cosmic rays – Sun: heliosphere – interplanetary medium – methods: data analysis – space vehicles: instruments –
     radiation: dynamics

1. Introduction                                                                                  22-year magnetic polarity cycle, the interplanetary magnetic
                                                                                                 field (IMF), the sunspot number (SSN), and solar wind parame-
The heliosphere is constantly permeated by charged particles                                     ters vary (Richardson et al. 2001), especially if considering time
originating from outside our Solar System. The cosmic rays                                       periods that are long relative to a solar rotation period. As a
are of Galactic origin and are isotropically incident on the                                     result, GCRs in the heliosphere are modulated in their inward
heliopause. Galactic cosmic rays (GCRs), and the related radia-                                  diffusion by the convection of the expanding solar wind and
tion exposure, are seen as some of the main challenges for future                                the particle drift on the IMF, giving rise to a changing GCR
long-duration exploration, especially beyond low Earth orbit.                                    flux (Gazis 1996; Modzelewska et al. 2019). Only higher-energy
The steady flux of energetic particles exposes spacecraft hard-                                  particles are able to penetrate into the heliosphere, causing a
ware and humans to radiation, the magnitude of which is heavily                                  depressed GCR intensity within the heliosphere compared to
influenced by several factors: the solar cycle, the presence of                                  beyond it (Wibberenz 2002). Particles with energies below a few
an atmosphere, magnetic fields, and relevant spacecraft shield-                                  100 MeV nuc−1 are more strongly affected by solar modulation
ing (Feynman & Gabriel 2000; Schwadron et al. 2014). Investi-                                    compared to particles with higher energies (Potgieter 2013). The
gations of GCR variations over the course of a solar cycle and                                   relationship has been observed at and around the Earth since the
at multiple locations in the heliosphere provide valuable data for                               1950s (Alania et al. 2014). A network of ground-based neutron
mission planning and for the improvement of our understanding                                    monitors (NMs) is used to study the temporal modulation of cos-
of GCR variations, particle transport, and structures throughout                                 mic rays by measuring the flux of cascading particles produced
the heliosphere.                                                                                 by cosmic rays colliding with atmospheric atoms (Engel et al.
    Three factors influence the modulation of GCR intensity                                      1992; Usoskin et al. 2017). In addition to exhibiting a tempo-
within the ecliptic plane: time, heliocentric distance, and helio-                               ral anti-correlation with solar activity, the GCR intensity also
magnetic longitude. This last factor is outside the scope of                                     varies with heliocentric distance, increasing with 3–4% per AU
this study as longitudinal effects are considered to be small                                    (De Simone et al. 2011; Honig et al. 2019; Modzelewska et al.
compared to temporal and radial variations (De Simone et al.                                     2019; Vos & Potgieter 2016). This gradient is highly convolved
2011). As the Sun undergoes its 11-year sunspot cycle and                                        with the solar and magnetic conditions at any given time and is

                                                                                                                                                                             A165, page 1 of 8

                Open Access article, published by EDP Sciences, under the terms of the Creative Commons Attribution License (https://creativecommons.org/licenses/by/4.0),
                                 which permits unrestricted use, distribution, and reproduction in any medium, provided the original work is properly cited.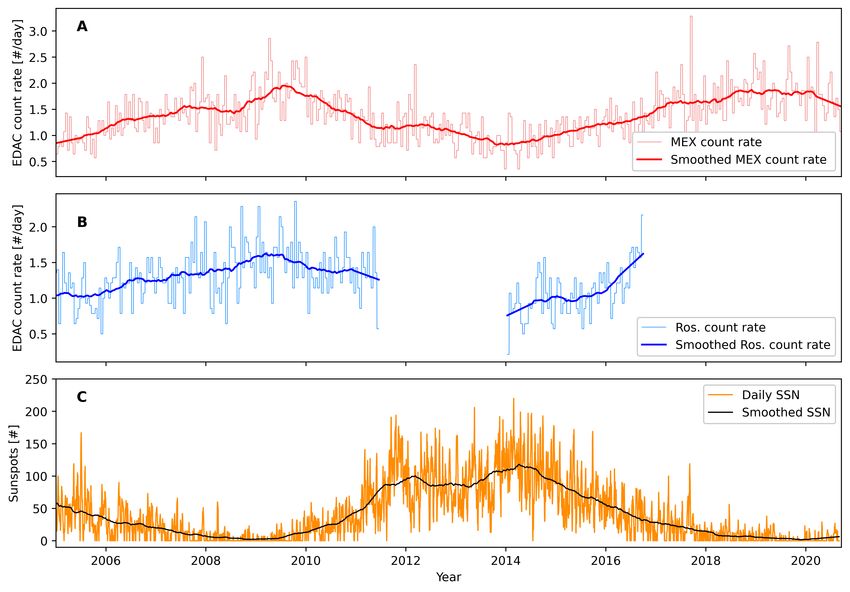
A&A 650, A165 (2021)

generally stronger for negative polarity periods (A < 0), when          least the end of 2022. The EDAC counter related to the data man-
the magnetic field has a radial inward component in the northern        agement system processor on MEX was utilised for this work
hemisphere and the particle drifts are inwards along the current        (parameter ID NDMW0D0G), which reports increments mul-
sheet (Burger et al. 2008), and weaker for times with positive          tiple times per day. Rosetta was launched on March 2, 2004,
polarity (Roussos et al. 2020).                                         and started its ten-year journey to reach Comet 67P/Churyumov-
     Error detection and correction (EDAC) is a technique used          Gerasimenko (Glassmeier et al. 2007). The spacecraft was oper-
on most spacecraft (Shirvani et al. 2000) to detect and correct         ational and in contact with the ground from launch until June
errors in memory contents. On spacecraft, this corruption is prin-      2011, at which point Rosetta entered a hibernation period that
cipally due to bit flips caused by single event upsets (SEUs). An       lasted until January 2014. Subsequently, Rosetta reached its
SEU can happen when an energetic particle hits a physical mem-          target comet in August 2014 and remained operational until
ory cell. If the particle deposits charge in it, a memory error can     September 30, 2016. Out of the 18 available EDACs on Rosetta,
occur, which in turn can corrupt the data stored on the chips if        the attitude and orbit control system counter (parameter ID
not corrected. Such errors are caught and corrected by the EDAC         NACW0D0A) was chosen for this study because of its contin-
algorithm. Once a correction is done, the relevant EDAC counter         uous temporal coverage (except during hibernation) and its mea-
goes up by 1 (Shirvani et al. 2000).                                    surement frequency, which was higher and more even than the
     The relatively steady cumulative EDAC increase is attributed       others.
to the continuous presence of cosmic rays as only highly ener-              For the part of this study that involves the solar cycle modula-
getic particles are expected to trigger an SEU and a subsequent         tion of GCRs at Mars, the MEX EDAC housekeeping parameter
count increment with the EDAC counter. Normal to elevated               was compared with SSNs for the time period January 1, 2005
solar wind conditions are not expected to have any direct effects       – September 17, 2020. The utilised sunspot data were down-
on the EDAC counter as such particle energies are much too              loaded from the World Data Center SILSO, Royal Observa-
low. However, solar energetic particle (SEP) events are known           tory of Belgium, Brussels (Center 2020). For the study of GCR
to cause irregularities such as jumps in the otherwise relatively       variations with heliocentric distance, the EDACs on MEX and
monotone counter (see panel A in Fig. 1) and have resulted              Rosetta from January 1, 2005, until the end of the Rosetta mis-
in various spacecraft failures or the forced initiation of safety       sion were utilised. These EDAC parameters are archived in mis-
modes (Limes et al. 2015). Some previous studies have explored          sion databases at the European Space Operations Centre (ESOC)
using EDACs for the purpose of monitoring space weather, such           for all ESA spacecraft but are not necessarily publicly avail-
as SEP events, with promising results (e.g., Jiggens et al. 2019).      able as they are not scientific datasets. For some missions (such
Otherwise, the EDAC parameter has been of little interest for           as Rosetta and Cluster), these datasets are also available in the
scientific purposes thus far.                                           online public archives of the European Space Astronomy Centre
     Understanding the radiation environment within our Solar           (ESAC).
System is not only key to many fundamental questions about                  To validate how well the EDAC parameter is suited for GCR
particle transport processes within the heliosphere, it is also         monitoring, the counter was also compared to ground-based NM
imperative when preparing for human and robotic space explo-            data. Neutron monitor data from several ground stations were
ration, especially for human space flight beyond low Earth              collected from the Bartol Research Institute’s website1 . The NM
orbit. The extremely high energies of GCRs and the strict               provides proxy measurements of GCRs by measuring secondary
mass constraints in space flight represent a serious challenge          particles created by their interaction with the atmosphere and
(Durante & Cucinotta 2011). Tradeoffs between added weight              inside the NMs (Simpson 2000).
and shielding can be further optimised if predictive models of
GCR variations are improved. At present, dedicated instrumenta-
                                                                        Data processing
tion on specific spacecraft is used to this end in conjunction with
sophisticated modelling efforts. Nevertheless, measurements are         The EDAC parameter is a cumulative counter. However, on a few
sparse, gaps in time coverage are frequent, and the spatial dis-        occasions over the course of the MEX and Rosetta missions, the
tribution of measurement points is very limited. By utilising           counter was reset to zero. For the purposes of this study, these
EDAC counters in addition to scientific instruments, both spa-          resets were corrected for by adding the count value immediately
tial and temporal coverage can be greatly improved. EDACs are           before the reset to all subsequent data points. The measuring fre-
implemented on all spacecraft, past and present, and the datasets       quency of the EDACs is quite irregular, varying from data points
are increasingly becoming more easily available. By combining           every 30 s to times with fewer than one measurement per day
EDAC counters with tailored scientific payloads, the radiation          on average. In order to compare MEX and Rosetta EDACs, the
monitoring within our Solar System can be greatly improved.             cumulative counter was resampled with a daily frequency, and
This study endeavours to showcase the utility of the EDAC               missing days were filled by linear interpolation. For each EDAC
counter for long-term observations of GCR variations in our             counter, a daily EDAC count rate was calculated by finding the
heliosphere, as well as to highlight some remaining challenges.         difference in the counter every two weeks and dividing this num-
Section 2 describes the datasets used and the data treatment pro-       ber by 14 days. Different time bins were tested, and a 14-day
cess, Sect. 3 presents the results, and Sect. 4 reflects on the find-   average, approximately half a solar rotation period, was found to
ings before a conclusion is given in Sect. 5.                           be the best compromise for removing daily variations and high-
                                                                        lighting the solar cycle modulation. By calculating the 14-day
                                                                        daily average, much of the random background fluctuations even
2. Datasets
                                                                        out; nevertheless, the rate is still susceptible to short-term varia-
On June 2, 2003, Mars Express (MEX) was launched and                    tion and extreme space weather events.
reached Mars orbit in December of the same year (Chicarro et al.            Daily variations are caused by random fluctuations in the
2004). After an initial commissioning phase, nominal science            GCR background, which are largely removed by the previously
operations began in mid-January 2004. As of December 2020,
                                                                        1
MEX was still operational and is expected to remain so until at             http://neutronm.bartol.udel.edu

A165, page 2 of 8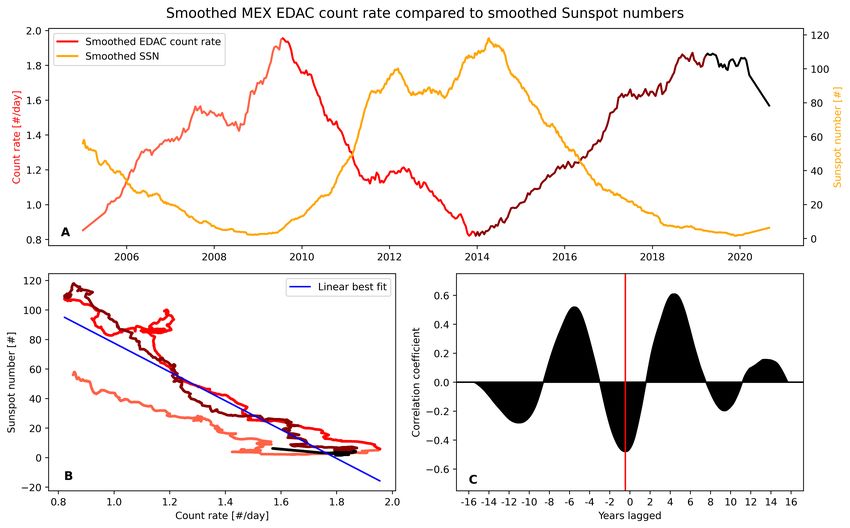
E. W. Knutsen et al.: Modulation of GCRs at Mars and beyond with EDACs

Fig. 1. Illustration of the removal process of SEP-induced disturbances (SPEs drastically influence the EDAC counters, artificially raising the
calculated EDAC count rate for several months prior to and after the actual event). Panel A: Rosetta EDAC counter from January 2005 to end
of mission; the blank space indicates the hibernation period and the black arrow points to an example SEP event. Panel B: close-up of the jump
indicated in panel A. Panel C: smoothed and original EDAC count rates before (purple, left y-axis) and after (blue, right y-axis) removal of two
distinct SEP events. We note that the original and modified count rates are plotted on different y-scales to highlight the extreme count rate values
obtained if SEP events are not removed from the time series.

described steps, but also by the passing of energetic solar erup-          Savitzky-Golay low-pass filter with a 365-day window
tions, such as coronal mass ejections or solar particle events             (Savitzky & Golay 1964) was applied to the EDAC count rate
(SPEs), that disturb the regular background of GCRs and cause              time series as well as to the SSN and NM data. In essence,
irregularities in the EDAC counter. Many SPEs are detectable               this process smooths the data by removing high-frequency vari-
within these datasets; however, for both spacecraft two specific           ations in the signal. If the SEP events had not been removed,
solar eruptions caused such extreme responses in the EDAC                  the EDAC rates during these times would be an order of mag-
counter that it was deemed necessary to do a correction. Figure 1          nitude larger than the rest and the smoothed rate would be ele-
illustrates this process using Rosetta as an example. In Fig. 1A           vated to an artificially high level in the ±6 months surrounding
the complete EDAC dataset from Rosetta is illustrated, includ-             the EDAC jumps, as illustrated in Fig. 1C. This would result in
ing one clearly visible jump caused by an SPE and one smaller              the solar cycle modulation of the cosmic rays appearing negli-
jump about 6 months earlier. The largest event is indicated by             gible. For studies on long timescales, this SEP-induced EDAC
an arrow. This event is zoomed in on in Fig. 1B, where for two             response removal is necessary to extract solar-induced modula-
days the EDAC counter increases dramatically, with nearly 100              tion from the more intense but short term space weather phe-
counts per day, compared to the 1.3 daily average. If no correc-           nomena. EDAC reactions to SEPs are, however, interesting in
tion is made, the estimated 14-day moving average EDAC count               themselves. If one wanted to study these transient events, a
rate around the point in time of the SPE leads to extreme values,          smoothing routine with a much shorter time span would be
as can be seen in the uncorrected EDAC count rates (purple) in             applied. Such a study could be of use for the detection and
Fig. 1C compared to the corrected count rates (blue). However,             diagnosing of space weather events, and Jiggens et al. (2019)
by replacing the EDAC rate in the 14-day interval around the               demonstrated the feasibility of this method. Future work will
SPEs with the mean of the rate before and after the event, a more          investigate these responses.
realistic estimate of the GCR background can be obtained. The
daily count rate average for the complete dataset before and after         3. Results
the extreme event correction remained very similar (reduced
from 1.3 ± 0.88 to 1.25 ± 0.37 counts per day for Rosetta and              The datasets discussed here are EDAC counters with daily fre-
from 1.39 ± 0.48 to 1.38 ± 0.32 for MEX) and is close to equal             quencies in the period from January 1, 2005, to September 17,
for both spacecraft.                                                       2020, for MEX and from January 1, 2005, to September 29,
    To obtain daily count rates that reflect the long-term vari-           2016, for Rosetta. Daily SSNs were compared to the MEX
ations in GCR background radiation, a smoothing routine                    EDAC counter for the full duration of the MEX EDAC time
was applied after the removal of the two SEP anomalies                     period. To demonstrate the capabilities of the EDAC counter as a
(which occurred in January and September of 2005). A linear                proxy for GCR variations, Sect. 3.1 compares the EDAC counter

                                                                                                                                 A165, page 3 of 8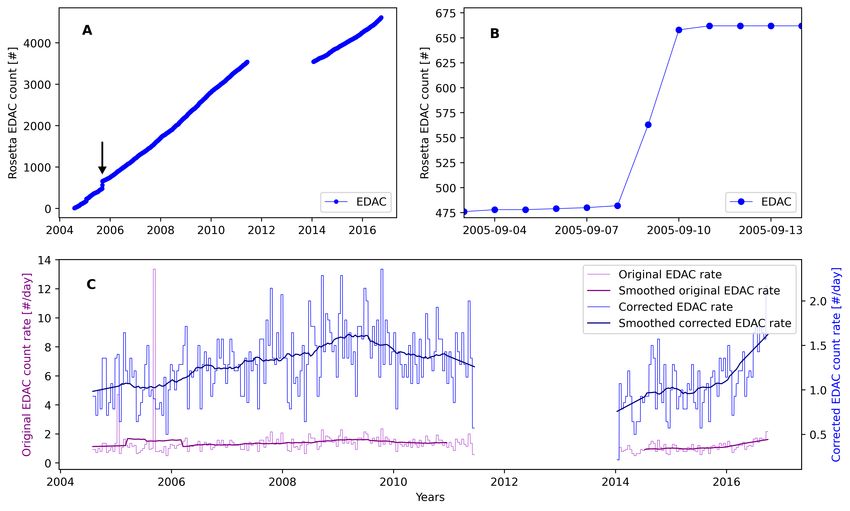
A&A 650, A165 (2021)

Fig. 2. Demonstration of the similar properties of the space-borne EDAC counter and the ground-based NM. Panel A: time series of the MEX
EDAC count rate (red) and the McMurdo NM count rate (green). Panel B: smoothed EDAC rate as a function of the smoothed NM count rate.
Panel C: cross-correlation between the two count rates; maximum correlation was found at exactly 0 lag, with a coefficient of 0.8.

with a ground-based NM, another well-established proxy indica-                 The solar cycle modulation is clearly visible in both the NM
tor of GCR activity (Usoskin et al. 1998). Section 3.2 focuses on          time series and the EDAC count rate, demonstrating the abil-
the solar cycle modulation on cosmic rays by comparing SSNs to             ity of the EDAC counter to measure the varying GCR intensity.
the MEX EDAC. The Rosetta EDAC is not used for this purpose                The comparison between the two smoothed time series shows
for two reasons. First, there is an interruption in the data series        a strong correlation. Neutron monitor data is a well-established
during the time Rosetta was in hibernation. Second, the orbit of           proxy for GCR measurements and makes for a good control set
Rosetta took the spacecraft to large heliocentric distances, which         to validate the fitness of EDACs for the purpose of GCR vari-
makes any direct comparison to Earth questionable. In Sect. 3.3,           ation studies. However, NMs are Earth-based instruments and
however, we derive a heliocentric GCR gradient by comparing                are therefore influenced by magnetospheric effects – effectively
the EDAC on Rosetta with the one on board MEX.                             being shielded from particles of lower energies to which the
                                                                           EDAC is still susceptible – which might cause the higher vari-
                                                                           ability in the EDAC compared to the NM. This could be in part
3.1. EDAC comparison with neutron monitor data
                                                                           why the correlation coefficient is not even higher.
All NM data used in this work were collected from the Bar-
tol research institute, which operates eight NMs; our primary              3.2. Solar cycle modulated GCRs at Mars
source was measurements from the McMurdo station. Data from
Thule and other NM stations were also compared with the EDAC               Measurements of the radiation environment around planetary
rates (not shown) and yielded nearly identical results. Figure 2A          bodies other than Earth are relatively sparse. The radiation field
directly compares the calculated MEX EDAC count rates to NM                at Martian orbit was first measured in 2002 with instruments
count rates, both raw and smoothed, and demonstrates that the              on Mars Odyssey (Zeitlin et al. 2010) and later with ExoMars
EDAC count rate at Mars exhibits the same long-term temporal               Trace Gas Orbiter (Semkova et al. 2018), while measurements
behaviour as the count rates registered at the McMurdo station             on the surface of Mars have been acquired since August 2012
on Earth. Figure 2B qualitatively confirms the linear relationship         (Hassler et al. 2012, 2014). Here we present cosmic ray varia-
between the two count rates by plotting the smoothed EDAC                  tions due to solar cycle modulation in Martian orbit, for the first
count rates as a function of the smoothed NM count rates. To               time recorded by engineering parameters. Figure 3 shows daily
quantify the strength of the correlation between the two coun-             EDAC count rates and SSNs along with the smoothed time series
ters, a cross-correlation calculation was made, as seen in Fig. 2C.        of each dataset. All smoothing was done with a Savitzky-Golay
Maximum similarity between the two signals, with a coefficient             low-pass filter, with a 365-day window and linear polynomial
of 0.8, is obtained at a lag of 0, indicating that if there is a delayed   fit of the data. Figures 3A and B illustrate the changing rate
response of GCR modulation at Earth compared to Mars, it is                of EDAC increments at Mars and Rosetta, respectively, as the
undetectable with this method.                                             GCR intensity varies with the solar cycle; the SSNs are shown

A165, page 4 of 8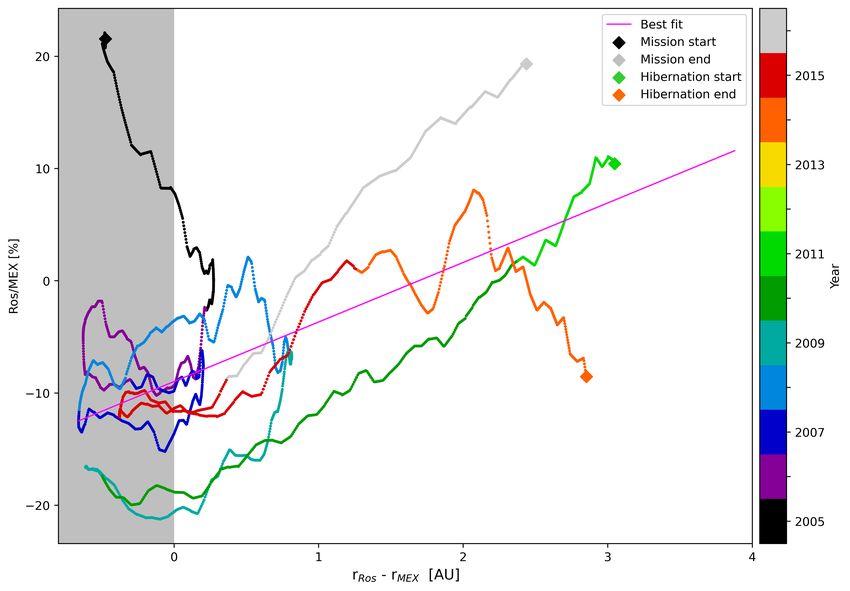
E. W. Knutsen et al.: Modulation of GCRs at Mars and beyond with EDACs
Fig. 3. Comparison between the two EDACs and the relevant solar cycle. Panel A: MEX EDAC daily count rates based on 14-day averages, with
smoothed count rates. Panel B: Rosetta EDAC daily count rates based on 14-day averages, with smoothed count rates. Panel C: daily SSNs along
with smoothed SSNs.
in Fig. 3C. From visual inspection, a pronounced anti-correlation (2019) found the lag to be 2–4 months. The difference between
can be discerned, which is further investigated in Fig. 4. the two might be due to the difference in energies they measured.
By inspection of Fig. 3, the GCR intensity minimum can be Interestingly, the origin of the delayed GCR response remains
seen to occur during the time of highest solar activity at the very unknown.
beginning of 2014, that is, during the polarity reversal phase of
the solar magnetic dipole field (Janardhan et al. 2018). Due to 3.3. GCR variations with radial distance
the particularly strong warping of the heliospheric current sheet
during solar maximum (Prölss 2004), cosmic ray access to the The flux of cosmic rays increases when moving away from the
inner heliosphere is diminished during this time, causing the Sun, but it is also modulated by the solar activity and the solar
anti-correlation between GCR intensity and SSNs. The Rosetta cycle. It will also differ depending on the measured energy inter-
and MEX EDACs exhibit very similar behaviours overall despite val. In this study we utilise EDACs on MEX and on Rosetta as it
the difference in location. To investigate the EDAC-solar cycle journeyed outwards in the Solar System. To obtain a GCR gra-
relationship further, the MEX EDAC and SSN are compared in dient independent of the solar cycle modulation, simultaneous
a correlation study in Fig. 4. The Rosetta EDAC is not used for EDAC measurements on multiple spacecraft at different loca-
this part of the analysis due to the long hibernation period inter- tions are required. As the heliocentric distance of each spacecraft
rupting the time series. is known at all times, one can disentangle the radial effects from
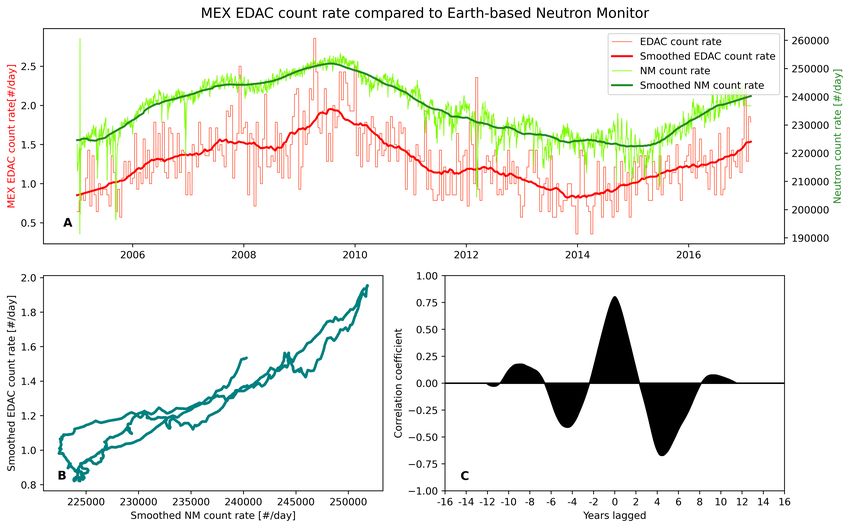
Figure 4 compares the MEX EDAC counter with solar activ- the solar cycle modulation effects observed with Rosetta by com-
ity over the course of 15 years. Panel A highlights the cyclic paring the EDAC counters on each spacecraft at the same time.
behaviour of the two time series, and the relationship is shown Heliocentric longitudinal and latitudinal variations in the GCR
as a scatter plot in panel B with a clear linear relation. The daily flux are considered to be negligible compared to the radial varia-
EDAC count rate at Mars orbit during solar minimum is twice as tion in this study (De Simone et al. 2011; Vos & Potgieter 2016;
high (1.9 counts day−1 ) as the daily count rate during the months Heber et al. 2009). To compare the MEX and Rosetta EDAC
of maximum solar activity (0.8 counts day−1 ). Panel C quanti- rates as a function of heliocentric distance, we calculated the dif-
fies the lag, which is barely discernible by visual inspection in ference in heliocentric distance between the spacecraft by sub-
panel A, by cross-correlation analysis. A lag time of 5.5 months tracting the Mars-Sun distance from the Rosetta-Sun distance
is obtained, which corresponds well with results from previ- for each day of Rosetta’s lifetime. The result is shown in Fig. 5,
ous studies of solar modulation around the Earth; Bertucci et al. where the ratio between the Rosetta and MEX EDAC rates is
(2019) obtained a lag time of 6–8 months, and Ross & Chaplin plotted as a function of the difference between the solar distances
A165, page 5 of 8A&A 650, A165 (2021)
Fig. 4. Long-term solar cycle modulation of GCRs. Panel A: smoothed SSNs in orange along with smoothed MEX EDAC count rates in hues of
red. The count rate is colour-coded according to the solar cycle phases to highlight the effect of solar modulation. The colours match the colours in
panel B. Panel B: SSNs as a function of MEX count rates in hues of red as defined in panel A. The blue line is the linear best fit of the data points,
indicating the relationship between the two parameters. Panel C: cross-correlation between smoothed SSN and MEX count rates, illustrating a
cyclic anti-correlated relationship, where the EDAC rate lags 5.5 months behind the solar cycle as measured by the SSN.
of Rosetta and Mars. The x-axis in Fig. 5 is such that x = 0 indi- planet (Neugebauer & Snyder 1962). Since then, specialised
cates the heliocentric distance to the mean Martian orbit and any radiation instrumentation has flown on multiple spacecraft, pro-
points at negative values translate to Rosetta being closer to the viding detailed data of the solar modulation of GCR activity
Sun than Mars. at and around the near-Earth environment. Zeitlin et al. (2010)
A linear function was fitted to the data points where x ≥ recorded, for the first time, solar modulation of GCR activity in
0, with an obtained slope of 5.3%, meaning the EDAC count Martian orbit from 2004 to 2007. Here we have confirmed, and
rate, and subsequently the GCR flux, increased at an average expanded upon, those results. Several SPEs were also detected
rate of 5.3% AU−1 for this dataset. If all measurements inside by Zeitlin et al. (2010), and complimenting those measurements
Mars orbit are also included, the rate becomes 3.9% AU−1 . (and others) with EDAC data will be the focus of future work.
In previous works (Honig et al. 2019; McDonald et al. 1997; Recently, the radiation dose rate was measured in Martian
Webber & Lockwood 1991), it has been customary to take the orbit with the FREND (Fine Resolution Epithermal Neutron
natural logarithm of the count rate ratio when calculating a radial Detector) instrument during the insertion phase of the ExoMars
gradient of GCR fluxes. By doing this for the two cases – all Trace Gas Orbiter. With this instrument, Semkova et al. (2018)
measurements and only measurements at and beyond Mars – observed changes in the GCR-related dose rate in accordance
slopes of 4.1% and 5.4% are obtained, respectively, which are with the declining phase of the solar cycle. The GCR radiation
similar to the values found in previous studies. The mean and dose has also been measured at the Martian surface by the MSL-
median of these four slopes both round up to 4.7, and thus our RAD instrument, where the solar cycle modulation was observed
final estimate of the GCR radial gradient becomes 4.7 ± 0.8%. (Berger et al. 2020). The dose rate was found to be fairly similar
As Rosetta’s journey included a hibernation period, there to that on the Moon, although the presence of the Martian atmo-
are two additional end points in the time series, as indicated by sphere shields the surface from lower-energy GCRs, resulting in
the diamonds in Fig. 5. Immediately after the launch of Rosetta a reduced modulation effect.
and after waking up at the end of hibernation, the relationship In this study we measure the solar cycle modulation of GCRs
between the two EDAC rates differ from the remaining 14 years at Martian orbit and thus avoid the low-energy particle filtration
of data. This could be related to shortcomings of the smooth- effect of the Martian atmosphere. On the other hand, the space-
ing algorithm at the edges or was possibly caused by cometary craft itself shields against the low-energy part of the GCR spec-
shielding for 2014, as discussed in Honig et al. (2019). trum. Quantifying this effect is complicated and requires detailed
knowledge of the spacecraft (geometry and components) and
was not considered for this study.
4. Discussion
As previously mentioned, longitudinal effects were assumed
In situ measurements of the radiation environment around Earth to be negligible (De Simone et al. 2011) for this work. In addition
have been conducted for almost six decades, with Mariner 2 to longitudinal effects, Rosetta’s trajectory does not at all times
becoming the first satellite to travel from Earth to another lie within the ecliptic plane (±8◦ latitude; Honig et al. 2019),
A165, page 6 of 8E. W. Knutsen et al.: Modulation of GCRs at Mars and beyond with EDACs
is related to the polarity of the 22-year magnetic cycle of the Sun.
This study spans almost 1.5 cycles, including solar cycle 24 in its
entirety. The polarity reversal normally occurs near solar maxi-
mum for each cycle, with one hemisphere flipping about 1 year
before the other (Pishkalo 2019). The lag obtained here of 5.5
months during an even numbered cycle is smaller than the lag
found by Bertucci et al. (2019) for the period 2008–2012, which
follows conventional predictions, but slightly larger than what
Ross & Chaplin (2019) found for the same cycle (2–4 months).
The EDAC counter increase with heliocentric distance
obtained by comparing the EDACs on MEX and Rosetta indi-
cates an average GCR gradient of 4.7 ± 0.8% AU−1 between
2005 and 2020. The uncertainty stems from the calculation
method used (simple count rate ratios or natural logarithm of
said ratios) and whether or not data points Sunwards of the
Fig. 5. Ratio of smoothed Rosetta and MEX EDAC count rates as a mean Mars orbit are included. This result confirms what ded-
function of the difference in solar distance. The magenta line indicates icated radiation instrumentation on other spacecraft has previ-
the linear best fit of the data, with an obtained slope corresponding to ously measured. When Rosetta was at heliocentric distances
a 5.3% AU−1 increase in GCR intensity. Each colour indicates a full equal to or smaller than mean Mars orbit, the spacecraft con-
terrestrial year, except for 2016 (grey), which ends on September 29. ducted several maneuvers and multiple fly-bys. Planetary shield-
The diamonds mark the start and end points of the Rosetta EDAC time ing effects and the passing through Earth’s Van Allen radiation
series. The lightest shades of green and yellow are not present in the belts on multiple occasions led us to differentiate between data
plot as they represent times when Rosetta was in hibernation. The grey
shaded area for x < 0 indicates when Rosetta was at or within mean
points within and outside Martian orbit when Rosetta’s trajec-
Martian orbit. EDAC data points within this region were not included tory was less convoluted. If all data points are included, the GCR
in the best-fit procedure illustrated in the figure. gradient drops to 3.8% AU−1 .
By comparing three years of data from the Kiel Electron
Telescope on the Ulysses spacecraft and the PAMELA (Pay-
and thus this adds to the already varying heliocentric latitude load for Antimatter Matter Exploration and Light-nuclei Astro-
caused by the inclination of the Sun’s rotational axis. MEX data physics) instrument, De Simone et al. (2011) found a radial gra-
was only used after orbit insertion around Mars, so radial and dient of 2.7% per AU for particles in the range 1.6–1.8 GV
latitudinal effects are reduced to those caused by Mars’ elliptical during the solar cycle minimum between cycles 23 and 24.
orbit and the inclination of the Sun’s rotational axis. Latitudinal For the same time period and using the same instruments,
gradients, however, are known to be small (Heber et al. 2009). Vos & Potgieter (2016) found a radial gradient of 4.25% AU−1 .
All heliocentric longitudes are covered. Thus, the effects these Gradients are generally stronger during the negative polarity
parameters might have on the EDAC counter are considered to phase when A < 0 and the magnetic field has a radial inward
be very small compared to solar cycle modulation and heliocen- component north of the current sheet, in this case during 2005–
tric distance effects. 2014, and weaker for times with positive polarity. The recent
Another aspect to consider is planetary shielding. Over the work of Roussos et al. (2020) found similar values with Cassini
course of the MESSENGER mission, a neutron spectrome- data, with a peak gradient of 4% AU−1 and an average gradient
ter was used for long-term study of GCR variations in the of 3.5% AU−1 for A < 0 in the period 2006–2014. Our mea-
inner heliosphere (Lawrence et al. 2016). When the satellite surements span multiple polarity periods, and the gradient found
was within a certain range of Mercury, the GCR intensity was here should therefore be considered a long-term average. More-
observed to drop since the GCRs incident on the solid angle over, the rigidity of those particles responsible for EDAC counts
of the planet were intercepted and did not reach the space- is currently not well understood. A quantitative comparison with
craft. Lawrence et al. (2016) therefore set a cautionary limit of other methods is thus still elusive. Nevertheless, we expect our
8000 km and abstained from using data when the spacecraft was results to be robust if we compare between EDAC counters on
within this range of the planet. MEX is in a highly elliptical other spacecraft as long as these counters provide comparable
quasi-polar orbit around Mars, with periapsis at 330 km, apoap- amounts of shielding for the spacecraft memories.
sis at 10 500 km, and a period of 7 hours. More than 5 of those Honig et al. (2019) found a GCR gradient anomaly during
7 hours are spent at altitudes higher than 5000 km, at which dis- the comet-approach phase of the Rosetta mission, when the GCR
tance Mars subtends 4% of the total sky. Planetary shielding was count rate dropped by 8% and thus exhibited a negative relation-
therefore assumed to have a marginal effect on the MEX EDAC ship with heliocentric distance. Our results also indicate that the
counter even when data from the full orbit were utilised and has GCR flux was different before and after hibernation. This effect
therefore not been taken into account for either of the EDAC was tentatively attributed to cometary shielding by Honig et al.
datasets considered here. (2019), although the phenomenon requires further investigation.
The solar cycle modulation of GCRs has been under intense In 2005, Rosetta was still for the most part within Martian orbit,
study for decades (e.g., Forbush 1958; Usoskin et al. 1998; and the closest approach fly-by of Earth was also during this
Bertucci et al. 2019), and though the existence of a time lag of period, which might have caused the elevated EDAC rate com-
GCR intensity relative to solar activity is well known, its origins pared to MEX at the same time (see Fig. 3).
remain elusive. In general, the lag is caused by the vast size of the In this analysis, EDAC counters from two spacecraft were
heliosphere and the diffusive and drifting nature of the cosmic utilised to infer the solar cycle modulation of GCRs in the helio-
rays (Dorman & Dorman 1967), though the details of the pro- sphere and the increase in GCR intensity with heliocentric dis-
cess are unexplained. The lag is larger for odd numbered solar tance. By including EDAC counters from additional spacecraft,
cycles than for even numbered ones (Usoskin et al. 1998), which the spatial and temporal coverage would increase drastically. The
A165, page 7 of 8A&A 650, A165 (2021)
main caveat to using EDAC counters individually to infer GCR data was provided by the ESOC Mars Express flight control team and is avail-
variations is the uncertain quantification of the energies or rigidi- able upon request (Olivier.Witasse@esa.int). Rosetta data is available in the ESA
ties of the particles that are responsible for errors in the memory planetary science archive. Neutron monitors of the Bartol Research Institute are
supported by the National Science Foundation. We thank the Royal Observatory
chips. The GCR spectrum covers a broad range of energies, and of Belgium and the World Data Center SILSO for providing freely accessible
not all will be sufficient to penetrate the spacecraft and result in Sunspot number data.
an EDAC increment. To understand this, knowledge of the 3D
structure of the spacecraft is required. Since the solar effects on References
GCR variation is rigidity dependent, it is imperative to compare
datasets with equal rigidities (De Simone et al. 2011). The parti- Alania, M. V., Modzelewska, R., & Wawrzynczak, A. 2014, J. Geophys. Res.:
cle energies that cause SEUs in one spacecraft might not be the Space Phys., 119, 4164
Berger, T., Matthiä, D., Burmeister, S., et al. 2020, J. Space Weather Space Clim.,
same in another as it will depend on the location of the onboard 10, 34
computer and the shielding effect of the rest of the spacecraft. Bertucci, B., Fiandrini, E., Khiali, B., & Tomassetti, N. 2019, in Proceedings of
The spacecraft chosen for this study, Rosetta and MEX, are Science, Madison, WI, USA, PoS(ICRC2019)1162
largely similar, designed with a large degree of commonality in Burger, R. A., Kruger, T. P. J., Hitge, M., & Engelbrecht, N. E. 2008, ApJ, 674,
several subsystems and with comparable solid-state mass mem- 511
Center, S. W. D. 2020, International Sunspot Number Monthly Bulletin and
ory units (Ferri et al. 2004), which gives us confidence in the online catalogue
results reported here. The potential scientific return from EDAC Chicarro, A., Martin, P., & Trautner, R. 2004, The Mars Express Mission: an
counters is irrefutable, and the benefits from supplementing the Overview, 3
counters with science instruments are numerous. De Simone, N., Di Felice, V., Gieseler, J., et al. 2011, Astrophys. Space Sci.
Trans., 7, 425
Dorman, I. V., & Dorman, L. I. 1967, J. Geophys. Res., 72, 1513
5. Conclusion Durante, M., & Cucinotta, F. A. 2011, Rev. Mod. Phys., 83, 1245
Engel, J., Gaisser, T. K., Lipari, P., & Stanev, T. 1992, Phys. Rev. D, 46, 5013
Ground-based NMs on Earth have been utilised for decades to Ferreira, S. E. S., & Potgieter, M. S. 2004, ApJ, 603, 744
monitor the near-Earth GCR environment. Here we demonstrate Ferri, P., Denis, M., Accomazzo, A., & Warhaut, M. 2004, Space OPS 2004
Conference (Montreal, Quebec, Canada: American Institute of Aeronautics
that the EDAC engineering parameter can provide similar infor- and Astronautics)
mation from a multitude of locations in the Solar System. EDAC Feynman, J., & Gabriel, S. B. 2000, J. Geophys. Res.: Space Phys., 105, 10543
counters can be used to monitor the time evolution and 3D struc- Forbush, S. 1958, J. Geophys. Res., 63, 651
ture of the GCRs in the heliosphere. Gazis, P. R. 1996, Rev. Geophys., 34, 379
We have shown that, as expected, the GCR variations at Mars Glassmeier, K.-H., Boehnhardt, H., Koschny, D., Kührt, E., & Richter, I. 2007,
Space Sci. Rev., 128, 1
follow a solar cycle modulation very similar to that observed at Hassler, D. M., Zeitlin, C., Wimmer-Schweingruber, R. F., et al. 2012, Space Sci.
Earth, with twice as high daily count rates during solar minimum Rev., 170, 503
compared to solar maximum, for those energies that the EDAC Hassler, D. M., Zeitlin, C., Wimmer-Schweingruber, R. F., et al. 2014, Science,
counter is sensitive to. The GCR-induced EDAC signal was found 343, 1244797
Heber, B., Kopp, A., Gieseler, J., et al. 2009, ApJ, 699, 1956
to lag SSNs by approximately 5.5 months, comparable to previous Honig, T., Witasse, O., Evans, H., et al. 2019, Ann. Geophys., 37, 903
results (Bertucci et al. 2019; Ross & Chaplin 2019). Janardhan, P., Fujiki, K., Ingale, M., Bisoi, S. K., & Rout, D. 2018, A&A, 618,
By comparing the Rosetta and MEX EDAC counters, we A148
found that EDAC count rates increased by 4.7 ± 0.8% per AU, Jiggens, P., Clavie, C., Evans, H., et al. 2019, Space Weather, 17, 99
which is in good agreement with previous studies of Rosetta Lawrence, D. J., Peplowski, P. N., Feldman, W. C., Schwadron, N. A., & Spence,
H. E. 2016, J. Geophys. Res.: Space Phys., 121, 7398
radiation monitor data (Honig et al. 2019). This behaviour is Limes, G., Christa, S., & Pires, C. 2015, EDAC Events During the LADEE
expected as the flux of GCRs increases with increasing helio- Mission (IEEE), 1
centric distance (e.g., Ferreira & Potgieter 2004). McDonald, F. B., Ferrando, P., Heber, B., et al. 1997, J. Geophys. Res.: Space
This work demonstrates the ability of EDAC counters and Phys., 102, 4643
Modzelewska, R., Iskra, K., Wozniak, W., Siluszyk, M., & Alania, M. V. 2019,
shows that they are well suited for GCR studies and can be used Sol. Phys., 294, 148
to identify long-term GCR variations in the heliosphere. Because Neugebauer, M., & Snyder, C. W. 1962, Science, 138, 1095
all spacecraft are equipped with EDAC counters irrespective of Pishkalo, M. I. 2019, Sol. Phys., 294, 137
their scientific objectives, EDAC data can provide information Potgieter, M. 2013, Liv. Rev. Sol. Phys., 10, 3
about the GCR flux at multiple locations in the heliosphere. In Prölss, G. W. 2004, Physics of the Earth’s Space Environment (Berlin,
Heidelberg: Springer, Berlin Heidelberg)
addition, shorter-term GCR variations in the form of Forbush Richardson, J. D., Wang, C., & Paularena, K. I. 2001, Adv. Space Res., 27, 471
decreases, as measured by EDACs, may inform on the propa- Ross, E., & Chaplin, W. J. 2019, Sol. Phys., 294, 8
gation of large solar transient events (e.g., Sánchez-Cano et al. Roussos, E., Dialynas, K., Krupp, N., et al. 2020, ApJ, 904, 165
2017; Witasse et al. 2017), particularly in those instances when Sánchez-Cano, B., Hall, B. E. S., Lester, M., et al. 2017, J. Geophys. Res.: Space
Phys., 122, 6611
there is no other instrumentation available to measure them. Savitzky, A., & Golay, M. 1964, J. Anal. Chem., 36, 1627
Future work will need to quantify the effect of different shield- Schwadron, N. A., Blake, J. B., Case, A. W., et al. 2014, Space Weather, 12, 622
ing geometries on the EDAC count rate, and methods for Semkova, J., Koleva, R., Benghin, V., et al. 2018, Icarus, 303, 53
cross-calibration between different spacecraft will be needed to Shirvani, P. P., Saxena, N. R., & McCluskey, E. J. 2000, IEEE Trans. Reliab., 49,
improve the quality of EDAC data for scientific studies. Nev- 273
Simpson, J. A. 2000, Space Sci. Rev., 93, 11
ertheless, the opportunity offered by such multi-point measure- Usoskin, I. G., Kananen, H., Mursula, K., Tanskanen, P., & Kovaltsov, G. A.
ments to improve the understanding of particle transport pro- 1998, J. Geophys. Res.: Space Phys., 103, 9567
cesses in the heliosphere should be followed up on. Usoskin, I. G., Gil, A., Kovaltsov, G. A., Mishev, A. L., & Mikhailov, V. V. 2017,
J. Geophys. Res.: Space Phys., 122, 3875
Vos, E. E., & Potgieter, M. S. 2016, Sol. Phys., 291, 2181
Acknowledgements. E.W.K. thanks the internship program at ESA-ESTEC for Webber, W., & Lockwood, J. 1991, J. Geophys. Res., 96, 15,899
the opportunity and financial support to carry out this project. E.W.K. has Wibberenz, G. 2002, J. Geophys. Res., 107, 1353
changed institutions while finishing this work, and is now at LATMOS/CNRS. Witasse, O., Sánchez-Cano, B., Mays, M. L., et al. 2017, J. Geophys. Res.: Space
B.S.-C. and M.L. acknowledge support thought UK-STFC grant ST/N000749/1. Phys., 122, 7865
B.S.-C. gratefully acknowledges ESA-ESTEC Faculty support. MEX EDAC Zeitlin, C., Boynton, W., Mitrofanov, I., et al. 2010, Space Weather, 8, S00E06
A165, page 8 of 8You can also read