GCSE GEOGRAPHY REVISION GUIDE EDEXCEL B
←
→
Page content transcription
If your browser does not render page correctly, please read the page content below
1

GCSE GEOGRAPHY
 REVISION GUIDE
   EDEXCEL B
2

                           Contents Page
Compulsory Units

Topic 1: Population Dynamics           Pages 3-14

Topic 2: Consuming Resources           Pages 15-21

Topic 3: Living Spaces                 Pages 22-31

Topic 4: Making a Living               Pages 32-39

Optional Units

Topic 5: Changing Cities               Pages 40-48

Topic 6: Changing Countryside          Pages 49-55

Topic 7: Development Dilemmas          Pages 56-62

Topic 8: World of Work                 Pages 63-70

Practice Exam Questions                Pages 72-73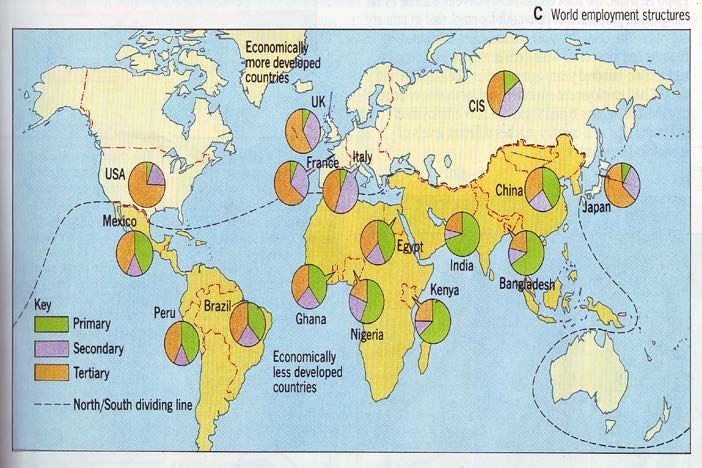
3

                Topic 1: Population Dynamics

What you need to know:

-   What has happened to the global population – historical, current and future

    trends?

-   Role of socio-cultural and economic factors affecting birth and death rates

-   Factors driving recent changes in fertility and mortality rates

-   How and why population change varies

-   How and why population structures change

-   Issues relating to youthful and ageing populations

-   Why some countries wish to control their population?

-   The impact and effectiveness or polices to control population

-   Differing policies that exist to mange migration

-   Why countries adopt different migration policies

-   Tensions that arise as a result of migrations
4

Key terms
Birth rate               the amount of babies born per 1000 of the population
                         per year
Death rate               the amount of deaths per 1000 of the population per
                         year
Population balance       birth and death rates are almost equal and the
                         population remains level
Natural                  the difference between birth and death rates
Increase/decrease
Fertility rate           the average number of children born to a women
Immigrants               people moving into a country
Emigrants                people moving out of a country
Migration                movement of people into and out of an area or country
Migration balance:       •  Positive more immigrants than emigrants – increase
                            population
                         • Negative decrease population – less immigrants
                            than emigrants – decrease population
Replacement Level        the amount of babies needed to be born for the
                         population to remain the same
Pro- natalist policy     A population policy that encourages births to increase
                         the population
Anti-natalist policy     A population policy that tries to reduce the birth rate
                         and therefore reduce population growth
Open door migration      A population policy that encourages international
policy                   migration
Points based migration   A population policy that only allows skilled people to
policy                   migrate to that country.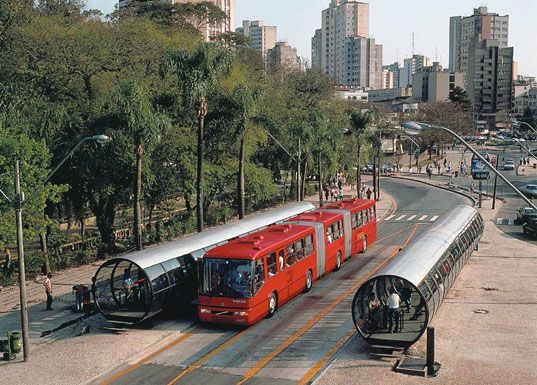
5

What has happened to the global population – historical,
current and future trends?
   •   The world population is growing at an alarming rate in 2008 at least another 65
       million people were added to the global total of 6.6 billion.
   •   Since 2000 the rate of growth has begun to slow down
   •   Exponential Growth has been occurring (the amount of time take n for the
       population to double e.g. in 1804 it had taken the population 300 years to double
       from ½ billion to 1 billion. In 1999 the doubling time had fallen to 39 years)

Role of socio-cultural and economic factors affecting birth
and death rates

Why has population been increasing?
Mainly due to a decline in death rates and infant mortality rates:
1)     Development of modern medicines. This has meant that more and more people
   are kept alive due to modern practices.
2)     Introduction of vaccination and immunisation programmes e.g. smallpox
   vaccination that helps people to live longer.
3)     Cleaner drinking water and better sewage disposal, a lot more people have
   access to clean drinking water than before.
4)     Better healthcare – more doctors, nurses and hospitals, means that people can
   be treated and not die.
5)     More hygienic housing.
6) Better diets, e.g. promoting eating ‘5 a day’
6

BUT in some developing countries Life expectancy has
declined
In Botswana 30% of adults have HIV/AIDS and life expectancy has decreased.
In Sudan CONFLICT has led to a lower life expectancy.

Why are birth rates high in some countries?
- In some developing countries a large % of people work in agriculture and children are
seen as an economic benefit to work on the land
- Women may not have a choice as their religion may be against birth control
- It may be the culture to marry very young so women are more likely to have more
children

   Named Example: Why will Russia’s population decline:
                 (Developed Country?)
- Falling life expectancy caused by industrial disease and alcoholism
- Outward migration of younger fertile men and women
- A low fertility rate of 1.2 children per women.

SO BIRTH RATES ARE DECLINING BECAUSE:
- Women have access to birth control methods.
- They may also choose to have few children as they are seen as an economic cost.
- Also more educated women chose to start a career before having children.

   Named Example: Yemen’s population will grow quickly
                 (Developing country)
- Women marry very young and have a large number of children (fertility rate 6.7)
- Increased life expectancy partly due to improved child vaccinations
- High birth rate as the Islamic religion is against birth control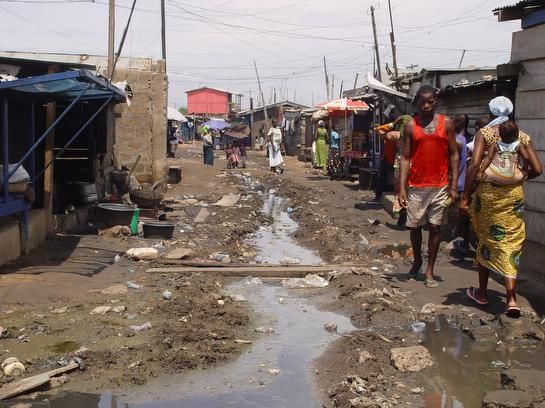
7

               How and why population change varies
Demographic Transition Model

Stage 1: High fluctuating
- High birth rate due to no birth control and high infant mortality
- High death rate due to disease and famine

Stage 2: Early expanding e.g. Yemen
- High birth rate
- Falling death rates due to improved health care and nutrition

Stage 3: late expanding e.g. China
- Falling birth rates due to birth control and wanting smaller families
- Falling death rates

Stage 4: low fluctuating e.g. Japan
- Low birth and death rates due to working women delaying age to start their families

Stage 5: Decline e.g. Germany
      - Death rate higher than birth rate due to a ‘grey’ population
8

Factors driving recent changes in fertility and mortality
rates
Population pyramids show important features of a population – age and gender. The
diagram below shows how to read one:

Population pyramids can be seen to link to the DTM

Population pyramids can be also used to work out the dependency ratio (is a relationship
between those who are and are not working in an area (usually a country).

9

Issues relating to youthful and ageing populations
Countries often suffer from problems due to the structure of their population.

Youthful population - This is when there are a very high percentage of people under
the age of 15.
Disadvantages of a Youthful population
   • Pressure on housing – not enough housing, people living in slums. This is very
       common around the big cities (New Delhi), where millions of people live in shanty
       towns with no running water, roads, sewage of any kind.
   • Pressure on schooling – illiterate population. India’s literacy rate is 60%,
       Cambodia’s literacy rate is 69%
   • Pressure on food supplies - famine, food distribution difficulties. Natural
       disasters accentuate this problem e.g. droughts.
   • Pressure on health services – high levels of education provision and health care
       are needed for children and babies and this is expensive.
   • The rapidly growing population need housing and will need employment
   • More difficult for women to work as they have to spend time caring for large
       numbers of children, so they are not earning an income.
   •
The Advantages of a Youthful Population:

•   Provides a steady supply of workers and can encourage economies to grow.
•   Children provide security and support for old age.
•   Children are a valuable source of income for a family as they can work on the land
    from quite a young age. As children get older they may be able to earn money in
    other ways. For example, selling snacks to tourists on the beach in a holiday resort.
•   As children get older they can help to care for younger children in the family.

Ageing population - This is when a country has a large number of people over the age of
65 in their country.
Problems:

The Advantages of an Ageing Population:

•   The tourist industry in countries like the UK has benefited with more retired
    people going on several holidays a year.
•   More elderly people in MEDC’s (more economically developed countries) have money
    to spend which helps the local economy.
•   They can support their grown-up children as they raise their young families.
•   They undertake many worthwhile tasks, many of them voluntary.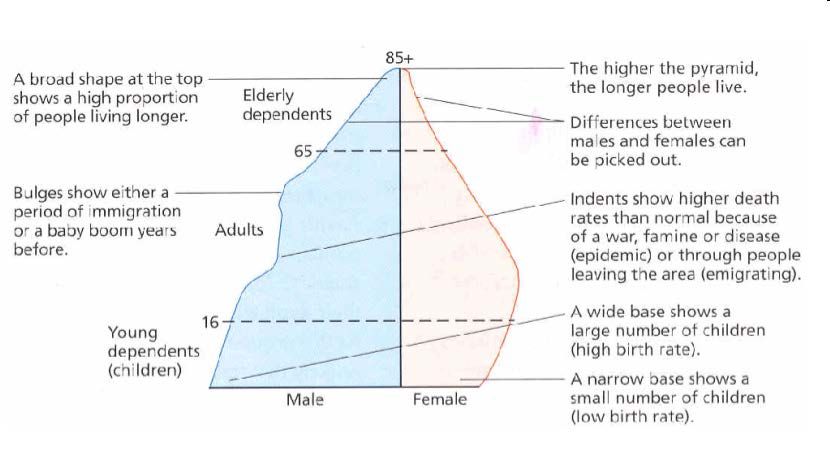
10

The Disadvantages of an Ageing Population:

•  Old people cost a lot to support and taxes may rise to pay for extra health and
   care.
• Health care – There will be a shortage of retirement homes and hospital care for
   the elderly, so more will have to be built.
• The need for specially designed houses and serviced blocked of flats. For example,
   hand rails, nonslip floors and emergency buttons.
• An increase in the cost of pensions. More elderly people, living longer, will require
   pensions for longer. With the falling birth rate, there will be fewer workers in the
   economy, so higher taxes will be needed to fund those pensions. In Japan, the
   Government has already raised the pension age from 60 to 65.
• Shortages of labour, recruiting overseas workers. For example, nurses and doctors.
• Provision of leisure activities for the elderly.
There are decreasing numbers of economically active people in the population

Solutions to the Problem of an Ageing Population
       Health care
          – Provide more health care e.g. retirement homes, hospital beds, more
              undertakers, etc.
          – Skilled health care workers, e.g. nurses, doctors, etc.
       Pensions
          – 3 solutions
                 • Increase tax – not popular
                 • Raise retirement age – not popular
                 • Abolish state pensions – not popular
11
Named Examples: Contrasting countries Japan vs. Mexico
Ageing Population – Japan
Facts Causes Effects
- 20.8% of population - People living longer (79 - Increase cost of
aged +65 for men & 85 for women). pensions as fewer
- 26.8 million pensioners Due to healthy diet and workers
- Birth rate below high GDP - Government raised
replacement level - Birth rate declining due retirement age from 60
to increase age of first to 65
child (2006 29.2 years) - Increase in numbers in
and number of marriages nursing homes
has decreased - Increase cost of
medical care
Youthful population: Mexico
Facts Causes Effects
- 31% of population under - Low death rate at 4.78 - Increase need for
15 deaths per 1000. due to school places
- Population grew 50 vaccinations and doctors - Young people unable to
million in 40 years - falling birth rate but find work so emigrate to
- Average age in 26 large % of young people USA
- Will take 50 years for - Growing manufacturing
Mexico to loose it’s industry
youthful population - Strongly catholic but
abortion has been
legalised to reduce
number of children
Why some countries wish to control their population?
Countries often need to manage their population to gain an optimum population (when
resources and population equally balance = sustainable). Governments often step into
manage their populations to stop them passing the tipping point that leads to
overpopulation.12
Named Example Anti-Natalist – China’s one child Policy
What? Why? Effects
Introduced in 1970s – -High growth rate of -Birth rate fell from 34
couples not allowed to population per 1000 in 1970 to 13
have more than one child. - Pressure on land and per 1000 in 2008
Couples with one child food supplies due to - Annual population
were given benefits e.g. large population growth rate fell from
cash bonuses, better 2.4% to 0.6%
childcare and improved -Total population grown
housing. from 996 million in 1980
Unauthorised to 1,320 million today
pregnancies pressured to -Chinese tradition to
have abortions prefer sons so sex
selective abortions
occurred (120 males to
100 females
- Shortage of women at
marrying age
Named Example: Pro-Natalist: Estonia
What? Why? Effects
Introduce ‘mother’s -Estonia became -By 2006 fertility rate
salary’ where women independent from Russia rose to 1.5 (still below
were paid to have in 1992 replacement level)
children - Falling population due
- 15 months fully paid to fertility rate declining
maternity leave from 2.2 in 1988 to 1.4 in
1998
- People planning fewer
children due to increase
poverty, single lifestyles
and young people
migrating overseas13
Differing policies that exist to mange migration
Named Example: UK
Open Door
- Post War immigrants came to UK from colonies in the Caribbean due to an Act of
Parliament giving all Commonwealth (ex-colonial) citizens free entry into the UK. (1950-
1960s ¼ million people came from the Caribbean).
+ve = Met shortage of unskilled and semi-skilled labour
= Helped with the reconstruction of the country post war
-ve = public money spent on meeting needs of the immigrants e.g. housing etc
= 1970s recession, the immigrants lead to increased unemployment
Point Based system
If you wish to come and work to settle down you need to gain a certain amount of
points. This was established 2008 and contains 5 tiers of migrants. Tier one has highly
skilled workers such as scientists, down to Tier five who are temporary workers e.g.
musicians playing in a concert. SO scientists and highly skilled people eg doctors are
more likely to be allowed into the UK where there is a skills shortage.
In 2004 eastern European countries of Czech Republic, Estonia, Hungary, Poland,
Latvia, Lithuania, Slovakia and Slovenia joined the EU (A8 – Accession countries). This
meant that citizens of these countries are free to move and work in other EU member
countries. In most cases these economic migrants stay only until they feel they have
made enough money to take home
Source advantages Host Advantages
- Immigrants send money/remittances - meets need of shortage of unskilled and
home to their families semi-skilled labour
- Less pressure on resources and jobs in - helped to reconstruct UK after the war
places like Poland etc - Increases culture in the UK
- Immigrants bring skills back to their - Immigrants contribute to the UK economy by
country the taxes they pay
- Immigrants often take mainly low paid jobs
- Less than 5% claim any sort of state benefit
Source disadvantages Host disadvantages
- Loss of working population from Poland - public money spent on immigrants e.g.
for example housing and healthcare
- Decline in birth rate as most migrants are - during the 1970s recession the immigrants
young men added to the number of unemployed
- - Increased hostility towards the immigrants14 Tensions that arise as a result of migrations The UK immigration of ethnic groups lead to conflict as there was hostility towards them. These ethnic groups banded together into particular areas to reduce the risk of being victimised. The UK government stepped in and stated that all citizens regardless of ethnicity should enjoy equal opportunities. Today much more harmonious as people have begun to realise the positives of having them; they add to country’s skill base and culture.
15

                    Topic 2: Consuming Resources
What you need to know:

-   How resources can be defined and classified

-   The impacts of obtaining and consuming one renewable, sustainable and non-

    renewable resources

-   Inequalities in supply and consumption of one global resource

-   Future pressures on both supply and consumption of this resource in view of

    recent global economic growth

-   Theories about the population-resource equation

-   How well these theories stand up to current global resource supply and

    demand

-   How resource demand might be reduced

-   The potential for alternative and renewable resources

-   Whether technology can ‘fix’ the problem
16
Key Terms
Alternative energy Energy sources that provide an alternative to fossil
fuels
Boserupian theory The view that when population grows it stimulates
technological changes that produce increases in
output, ensuring that living standards can be
maintained for the growing population
Carbon footprint A measurement of all the greenhouse gases we
individually produce, through burning fossil fuels for
electricity, transport etc.
Human resource The skills and abilities of the population
Malthusian theory The view that population growth is the main reason
why a society would collapse
Material resource A natural substance that humans choose to use
Natural resource Those materials found in the natural world that are
useful to man, and that we have the technology and
willingness to use
Non-renewable Those resource – like coal or oil- that cannot be
resource remade, because it would take millions of years for
them to form again
Renewable resource Resources, such as forests, that can be maintained by
management
Sustainable Development that meets the needs of the present
development without compromising the ability of future
generations to meet their own needs
Sustainable resource Resources – such as wood –that can be renewed if we
act to replace them as we use them17
How resources can be defined and classified
There are three main types:
1) Natural resources e.g. wood
2) Human resources e.g. skills of a population e.g. Doctors
3) Material or capital resources e.g. good and equipment already in society)
You can also define resources via their availability
- Non-renewable resources – cannot be remade because they take millions of years to
form again e.g. coal or oil
- Sustainable resources – Can be deliberately be renewed so that it can last into the
future e.g. planting trees
- Renewable resources – renew themselves so do not need to be managed e.g. solar and
wind power
The impacts of obtaining and consuming one renewable,
sustainable and non-renewable resources
Resource Benefits Costs
Non-renewable e.g. Tar - Extraction would bring - Extraction uses huge
Sand oil further money to oil amounts of water
companies - only 5 year supply
- could avoid the costs of - need removal of forest
switching to other fuels to get to the oil
such as hydrogen
Sustainable and - C02 absorbed when - need huge area of land
renewable e.g. Bio fuels they are grown to grow the crop
- engines need little - reduces habitat variety
change to cope with bio due to monoculture
fuels
Sustainable but limited - Unlimited - Intermittent as new
e.g. Solar energy - Environmentally ways of storing
friendly so limited electricity are needed
carbon emissions - Current production is
tiny
- Relatively expensive18
Inequalities in supply and consumption of one global
resource
World reserve of oil (%)
Uneven patterns of oil supply and • Saudi Arabia (22.3%)
• Iran (11.2%)
• Kuwait (9.7%)
• UAE (8.3%)
• Venezuela (6.5%)
• Russia (6.3%)
• Kazakhstan (3.4%)
• Libya (3.3%)
• Nigeria (3.0%)
• USA (1.8%)
• China (1.4%)
• Canada (1.4%)
• Qatar (1.3%)
demand
Current production is focused in the Middle East, especially
Saudi Arabia. However many of these countries have reached
‘peak oil’ (production of relatively cheaply obtained oil has
reached its maximum so there is now a fall in production).
Consumption is largely related to the wealth of a country
and its reliance on cars. 70% of the world’s oil is used
transporting goods and people within and between countries.
The USA has less than 5% of the
population but uses 25% of the oil
mainly due to:
- Lack of public transport systems
- Low density urban settlements so
need long journeys to work, school
etc
- History of low petrol prices19
Future pressures on both supply and consumption of this
resource in view of recent global economic growth
China and India are continuing to grow rapidly with a combined population of 1,400
million using 71 million cars. In most cases as the population grows the demand for cars
will increase as the hope to get ‘the American Dream’. To achieve this Tata Motors
based in India has begun production a car priced at £1500, this increasing the demand
for oil and adding to C02 emissions.
Theories about the population-resource equation
Malthus Theory (1 766- 1 834)
- Population increases faster than food
supply so there would come a time when
the world could not cope.
- Population increases geometrically (1, 2,
4, 8, and 16)
- Food supply increases arithmetically (1,
2, 3, 4, and 5)
- Population would outgrow the amount of
food available leading to famine, war and
disease
Malthus argued that there were ways to prevent population from extending beyond the
food supplies necessary to support it (optimum population). This includes a combination
of
1. ‘Negative’: Methods people choose to reduce human fertility e.g. China’s one child
policy, sterilisation
2.’ Positives’: Anything which increases mortality: e.g. low living standards, disease
Malthus argued that this would kept the carrying capacity in check the
Number of plants, animals or human which can be adequately supported (carried) by the
land
Boserup Theory 1 965
- Population growth has a positive impact on people as it forces
them to invent a way out of a problem when resources start to
run out e.g. GM crops
- Overpopulation leads to innovation and higher productivity in
use of land (irrigation, weeding, crop intensification, better
seeds) and labour (tools, better techniques) e.g. GM Crops and
the Green Revolution20
How well these theories stand up to current global resource
supply and demand
BOSERUP
MALTHUS
However some people follow Boserup’s
• Some people believe in Malthus’s ideas.
ideas. She argued that food production does
He believed that population grew
not limit or control population growth.
exponentially (doubling at each stage –
Instead, she said that population growth
1:2:4:8:16), but that food production
controls farming methods. She believed that
grew arithmetically (adding one unit at
people would try not to give into disease or
each stage – 1:2:3:4:5, etc).
famine.
• This meant that population would
Instead, they would invent solutions to the
eventually outstrip food supply. At this
problem. She used the term ‘agricultural
point, the population would decrease
intensification’ to explain how farmers can
through starvation. Malthus called this a
grow more food from the same price of land
‘natural’ check on population growth.
using better farming techniques and
Other natural checks were disease,
chemical fertilisers.
famine and food insecurity.
This can be seen in Malawi
• This can be seen in some countries. For
Food supply has increased using irrigation
example, in Ethiopia where there is a
and the genetic modification of seeds.
greater population than the resources
Irrigation is when you take water
available and many Ethiopians rely on
from areas that have it to those that
FOOD AID to survive.
don’t. In Malawi there are plans for
• A preventative check is when the
an irrigation project to create a
Government does something to stop
‘green belt’ of land using water from
Lake Malawi.
Malawi is also allowed to genetically
modify (GM) seeds into the
country. These crops may allow
Malawi to grow more food
especially in dry areas, creating jobs
and economic growth.
In most countries Malthus’s ideas have not
occurred as people have developed ways to
increase FOOD production.21
How resource demand might be reduced
Reducing the dependence on oil
- Plastic water bottles are made from oil and then oil is used to transport them across
great distances.
- Now carrying refillable bottles of water and recycling the bottle
- Switch to hydrogen run cars as they release no harmful emissions. E.g.
The Ford Edge car is first alternative fuel car to be able to travel
similar distances to traditional petrol cars.
Individual action
- changing habits e.g. using public transport and switching to energy efficient light bulbs et
- Recycling and conservation
- Buying food from local farm shops to reduce ‘food miles’
Corporate Action:
- Example of Interface Carpets based in the USA has identified various goals to improve
its environmental performance e.g. eliminating waste in all areas of the business and using
renewable energy resources such solar and wind power.
- Google Headquarters uses hydrogen cars which are renewable and also provides a bus
shuttle to pick up its employers to reduce their car usage
The aim is to achieve ‘SUSTAINABLE DEVELOPMENT’:
‘This is development that meets the needs of the present without compromising the
ability of future generations to meet their own needs’
The potential for alternative and renewable resources
In 1995 the UK generated 2% of its electricity from renewable sources compared with the
EU average of 14%. The government set its target of reaching 10% by 2010. This they
believe is achievable as the average costs for wind, hydro, landfill gas and waste-burning fell
dramatically during the 1990s. However, UK government achieved only 6% by 2010. There is
still however a huge market for the UK to switch towards more renewable resources of
energy.
Whether technology can ‘fix’ the problem
Technological fix is the idea that we can resolve problems we might have by inventing
solutions to them. The problem of finding alternative fuels to replace ‘cheap’ oil would need
high amounts of effort from governments, corporations and researchers to cope with the
issue of ‘peak oil’.
Examples
Genetically modified food
Hydrogen fuel car (alternative to oil)
Wave power machines (alternative to energy- electricity produced by burning fossil
fuels)22
Topic 3: Living Spaces
What you need to know:
- Defining a ‘good living space’ and how it may vary with age and stage in the
life cycle etc
- The processes that lead to variations in the quality of living spaces
- Perceptions of living spaces and how these vary spatially between urban and
rural
- How personal choices about living spaces are affected by age and life cycle
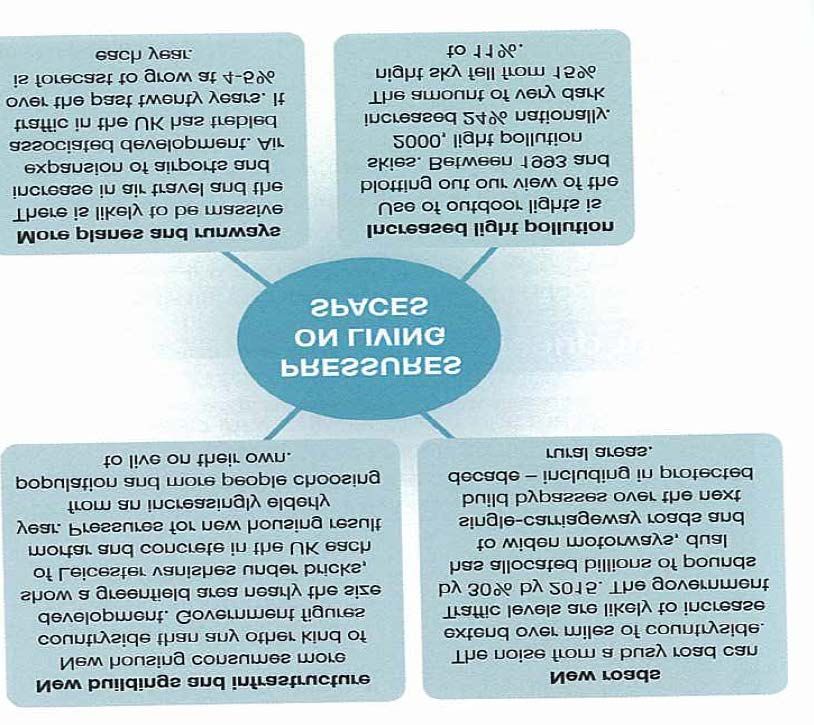
- Pressures on rural areas in developed countries to provide more living spaces
- The pressures on living spaces in urban areas, their impacts, and the
compromises made in creating good quality living space
- The need for more affordable quality living spaces in urban and rural areas
- The links between quality of living spaces and economic wealth
- Attempts to create high-quality living spaces in urban and rural areas for all
urban populations23
Key Terms
Accessible rural areas Countryside within easy reach of urban areas
Cultural background The origins of an individual’s or group’s belief system
Economic status The position held by an individual, group or country in
terms of their economic power
Expatriate community Overseas communities made up of non-national’s e.g.
the British living in Spain
Global city A major urban area that has a significant role in
controlling the international flows of capital and trade
Global hub A major centre of global communications, such as an
international airport
Greenfield sites A piece of land that has not been built on before, but
is now being considered for development
Inner city living space Residential areas within city centre areas
Organic agriculture Farming systems that use no artificial chemicals
Pull factor Something that attracts people to a location
Push factor Something that makes people wish to leave a location
Redevelopment Development which aims to stimulate growth in areas
that have experienced decline
Regeneration Growth in areas that have experienced decline in the
past
Remote rural areas Rural areas that are distant from and thus little
affected by urban areas and their populations
Rural Idyll The common perception that rural areas are quiet and
attractive – and therefore good places to live
Sustainable living space Living spaces that are designed in such as way to have
a small impact on the environment and thus more
durable than others
Urban sprawl Urban growth, usually weakly controlled, into
surrounding rural and semi-rural areas24
Defining a ‘good living space’ and how it may vary with
age and stage in the life cycle etc
People’s idea of what makes good living spaces tends to vary due to age and their
economic background. You tend to form a strong bond with a living space if it meets
your needs and it has access to the things you like doing.
Factors affecting how we view places:
Age Younger people seek out more variety in their social lives
and this makes cities more attractive. Older people or
those with families tend to find rural areas more
attractive.
Mobility Personal mobility will affect how isolation we feel. Rural
areas tend to have more problems with mobility with a
reliance on private cars
Cultural background This impacts on how we see places and how attractive we
find them
Knowledge and perception Highlights the ‘idea’ of a place without people actually
knowing the area e.g. crime rates etc
Economic status Areas that offer job security are deemed more attractive
The factors that lead to variations in the quality of living
spaces
Social factors: crime rates,
healthcare, education, risk of
disease etc
Economic factors: access to
services, job opportunities, Political factors: opportunity to
transport links etc vote, freedom of speech and
movement
Environmental factors:
available water, soil fertility,
likelihood of hazards etc25
Perceptions of living spaces and how these vary spatially between
urban and rural
The rural idyll in DEVELOPED countries is an image that people have of the rural life in
developed countries e.g. less traffic, pollution; more open space for leisure; less crime shops
etc. This rural idyll idea creates high demand for housing.
This has caused problems:
Demand from people has meant housing in attractive areas accessible to cities
has become EXPENSIVE
Some wealthy people have BOUGHT second homes this increases demand and
therefore PRICES. Local people may not AFFORD them.
Rural areas are often used as weekend retreats for urbanites who venture to the
countryside each weekend. The village’s population also grows during the summer
months due to holiday/ second homes. However during the week and winter the
population declines. This has led to the closure of services like shops and pubs. (Also
people may live in the villages but work in nearby towns and do their shopping there
or in out of town centres)
What causes Counterurbanisation?
Counterurbanisation is the movement of people out of urban areas like towns and cities to
rural areas e.g. villages and small towns.
The main push and pull factors are often a mirror image of each other.
The main push factors (out of the city) The main pull factors (towards the
are. . . . . . . countryside) are . . . . . . .
Expensive housing; higher crime rates; The perception that the rural ‘idyll’ exists with
congestion and traffic; higher levels of noise more open space; less congestion and traffic;
and air pollution fresh air and less pollution; more housing for
your money; less crime and a better community
spirit.
Improvement in transport (high speed trains The growth of IT –faxes, email, video
and motorways)means people no longer have to conferencing-and broadband connections means
live where they work people can work from home
However the rural ‘idyll’ may hide problems:
- Closure of services like village shops and pubs
- Secondary school children may have to travel a long way to school
- Public transport links may be poor and this isolates older people and
teenagers
- Young people maybe remote from leisure facilities as well as educational
facilities
- There may be a lack of employment opportunity in the local area and so
people may commute a long way to work. Wages in local employment maybe lower26
Developing countries: Urbanisation
In many cities in developing countries there has been an increase in the proportion of
people living in urban area due to RURAL to URBAN migration.
The main push and pull factors are often a mirror image of each other.
Pull factors Push factors
The main pull factors (towards the city) are The main push factors(out of the countryside)
are
Employment opportunities in service and Lack of paid employment. Often farms are too
manufacturing industry. For example in small to support a growing population
Johor Bahru in Malaysia TNC’s have set up
factories e.g. Dyson which creates
employment opportunities.
Better Education opportunities especially in Lack of educational opportunities
secondary and tertiary (university)
Better health care with more health centres Lack of health care facilities
and hospitals
(Also electricity; water supply etc)
This has (together with high natural
increase due to young age of migrants so
more births and fewer deaths due to
improved medical care) lead to the
development of Squatter settlements
What is a squatter settlement?
- An area of makeshift housing with poor
living conditions
- Often no running water and people have to
buy from water sellers
- Lack of sanitation (getting rid of sewage and dirty water) so diseases like diarrhoea
develop.
- Due to poverty; lack of street lighting and lack of security often leads to higher
crime levels.
- May lack other services like schools; health centres and public transport
- Houses are often built illegally so people do not feel secure.
However there is a major advantage: housing is cheap and affordable for the
urban poor27
How personal choices about living spaces are affected by age
and life cycle
20 somethings are moving back to the city in developed countries like the UK:
This process is called ‘re-urbanisation’ where young people (25-35) who are relatively
well off move back into the cities eg London Docklands around Canary Wharf
Regeneration projects have attracted young, often single people back into London. The
jobs that have replaced the old industrial jobs (eg in the docks; food processing) are in
business and financial services.
Attractions: Pull factors
o close to the city centre for work and high quality shopping
o good public transport in the city centres so no need for a car
o culture e.g. theatres and museums and leisure (clubs, restaurants) and a good
night life close by
o modern housing available often built on brownfield sites (or gentrified housing)
Regeneration: development (e.g. employment; housing
leisure) in areas that have experienced decline.
Retiring to the sun:
Many older people are choosing to retire to eastern and
southern Spain:
People in the UK have increased income and savings as well
as people reaching retirement age in better health
Attractions of Spain
o warmer climate than the UK
o Modern health facilities
o House prices are lower than the UK
o Lower heating costs and household bills than the UK
o Cheap to fly home to see friends and family
BUT there are problems
- Ill health and worries about language problems in foreign hospitals
- Falling value of pensions as the value of the pound declines against the Euro;
- As people get very old they may need more family support which is not available in
Spain28
Pressures on rural areas in developed countries to provide
more living spaces
Populations in developing countries are growing slowly BUT there is a growing demand
for housing due to :
*People moving from one area to another
*More individual/ smaller households due to single/ divorced/older people living
on their own.
So there are pressures to build more housing on Greenfield sites. (areas which have not
been built on before e.g. countryside)
Consequences of building on Greenfield site
there is a need to find suitable Greenfield sites and there is often pressure by
local people against this
The growth of towns and villages in RURAL areas has an impact both in the rural
settlement (e.g. increased traffic by commuters; more people so there is population
pressure on schools and health centres; loss of AMENITY land)
AND in the surrounding rural area(e.g. loss of biodiversity)
Loss of productive farmland
Increased use of cars for commuting by new residents
There is also a pressure to build new transport developments e.g. roads and
airports.29
Why are urban areas in demand?
Developed eg London; Tokyo Developing eg Mumbai (India); Johor
Bahru (Malaysia)
Regeneration projects e.g. London Cities like Mumbai and Bangalore in India
Docklands have attracted young, often have attracted new industry e.g.
single people back into London. New, outsourcing of service functions e.g. call
modern housing / flats have been built. centres. This has acted as a catalyst for
The jobs that have replaced the old attracting new migrants to the city in
industrial jobs (e.g. in the docks; food search of jobs. Mumbai is the financial
processing) are in business and financial capital of India and new jobs have been
services e.g. in Canary Wharf. This has created in the financial sector.
resulted in REURBANISATION of city In Johor Bahru the Malaysian government
centres. has created a free trade zone. This has
attracted foreign manufacturing TNC’s
e.g. Dyson which in turn has created jobs
and attracted new migrants.
Urban areas have a concentration of Indian cities have poor public transport
services and amenities e.g. Universities; systems so workers need to live in the
theatres; high order retail facilities; city.
hospitals (Although Mumbai has developed a metro
and Bangalore is planning one)
Household sizes have declined and there Attraction of health; education ‘bright
are more actual households in the UK and lights’
this pushes up demand for new housing.
What are the pressures on living spaces in Developed
countries
Housing:
Tokyo: in 2007 the population was 12.8 million (10% of Japan).
High demand pushes up land prices (£1000 per m2) and results in
very small living spaces.
London: housing shortages, especially cheaper, affordable
housing. Outward pressure to build new housing on greenbelt land
(urban sprawl).
Public transport
Overcrowding on public transport systems especially metro/
underground trains and buses.
Solution: In Tokyo they plan to build underground cities e.g. Alice Cities, which are
underground spaces connected by trains and roads under the surface30
What are the pressures on living spaces?
In Mumbai huge slums e.g. Dharavi are home to over 600,000 people (see above
the problems of squatter settlements)
Over 1/3 of the population of nearly 20m do not have access to fresh drinking
water and 2m do not have access to a toilet (poor sanitation)
The public transport system is poor and commuting takes a long time
Creating Sustainable living Spaces
Developed Developing
London congestion charging Masdar (United Arab Emirates)
Recycling and waste reduction A new settlement for 50,000 people has been built
17km outside the capital. It is claimed to be the
first ‘zero-carbon, zero waste’ city. For example
wind towers are placed on top of buildings to suck
cool air in and warm air out. Rooftops are covered
with solar panels and the city will be car free due to
extensive public transport.
Barcelona (Spain) Urban farms in Havana, Cuba
Created a scheme called ‘bicing’ where These are gardens that use every piece of available
people buy a year’s membership for £30 ground in the city and in 1995 is was estimated that
which allows them to pick up a bike from one there were 26,600 popular gardens in the city that
of the produce a wide range of products
400 stations that are located around the
city. There are over 6000 bikes and more
than 175000 members.
Rural Sustainable Examples
Developed Countries Developing Countries
Martin (Hampshire) Eco-villages in Brazil
Looked to control their food system so that it Ecoovila is a small eco-village located in the city
could become less dependent on supermarkets of Porto Alegre. The aim was to develop
etc. Residents have joined Future Farms which affordable housing for everyone and use eco-
is a community allotment of 3 hectares growing friendly building materials. All houses face the
vegetables and raising animals. It is sold by sun so they soak up its energy, houses are cooled
the villagers for profit as well as for their own by underground chambers in the homes, grass
food. roofs reduce inside temperatures and help to
insulate. They have used local material such as
clay bricks and sewage is treated in a biological
reed-bed system.31
Urban Sustainable examples
The Future: Sustainable living spaces: Britain’s new ecotowns
What are Compact Communities?
Attempts to reduce the environmental impact of our living spaces by making the best
use of space. Workplaces are located within the housing areas so there is less need to
travel. Housing is dense so it provides enough people to support the local services and
use public transport.
Why build new Eco-towns?
The UK government want at least 10 new eco towns to be built by 2020. NW Bicester is
one of the first wave that could be built.
WHY: There is a shortage of housing especially affordable housing in certain parts
of the UK.
What are they? Eco-towns are described as small new towns of at least 5-20,000
homes designed to achieve zero carbon development and more sustainable living (energy
efficiency; streets with charging points for electric cars;jobs within or close; local
food production; conservation/recycling of water and waste; urban design will allow
childen to walk/cycle to school) using the best new design and architecture.
Some new ecotowns will be built on brownfield sites eg former RAF aerodromes but
many will be built on Greenfield sites.
EG North West Bicester in Oxfordshire.
Plans have been put forward to build 5000 homes and create 5000 jobs for local
people in NW Bicester
If you look at the satellite photo this ecotown will be built on a Greenfield site.
For Against
More affordable, This site is a Greenfield site
sustainable housing Loss of biodiversity in the
where the demand is area Greenfield site
greatest Loss of amenity land eg
walking in open space
Ecotowns will be a model
Loss of productive farmland
(example)for future
Increased use of cars for BICESTER
sustainable living
commuting by new residents
developments
The Campaign to Protect
Sustainable living is the Rural England argues that
future the world has Councils should redevelop
changed and we cannot derelict Brownfield sites and
live in the past bring back into use 800,000
empty homes in England.32
Topic 4: Making a Living
What you need to know:
- Understand how the balance between employment sectors is changing
- Process of industrialisation and deindustrialisation and the impacts of these
- Factors leading to diversification of rural economy in a developed country
- Understand the environmental impact of employment change in urban areas
of a developing country
- Understand the environmental impact of de-industrialisation and economic
diversification in one area within a developed country
- Identify the potential for regeneration and environmental change on
Brownfield sites
- Identify the potential for greener growth in urban areas.33
Key Terms
Brownfield site A piece of land that has been used and abandoned,
and is now awaiting some new use
Clark fisher model A generalised description of how societies’
employment structures change as they develop
Deprived area An area in which there is a damaging lack of the
material benefits that are considered to be basic
necessities e.g. employment, housing etc.
Derelict land Land on which factories or houses have been
demolished
Employment structure The proportions of people who work in primary,
secondary, tertiary or quaternary jobs
Formal sector Work where people are formally employed, with
permanent jobs and regular pay
Green sector The part of economic activity that pays attention to
environmental issues
Industrial Stage The economic stage when manufacturing industry
develops
Informal sector Forms of employment that are not officially
recognised e.g. people working for themselves on the
streets of developing cities
Post-industrial stage Period in the development of a society when
manufacturing industry declines in importance and is
replaced by other forms of employment
Pre-industrial stage That period in development of a society when
manufacturing industry has yet to develop
Primary employment Working in the primary sector – extracting and
exploiting raw materials e.g. miner
Quaternary employment Working in jobs that are related to ICT and research
Regeneration Growth in areas that have experienced decline in the
past
Secondary employment Working in the secondary sector, making things
Sustainable Meeting our current needs in a way that does not limit
the ability of future generations to meet their own
needs
Telecommuter Person who works away from the office through the
use of the internet
Tertiary employment Working in the service sector, producing ‘intangible
goods’ e.g. teacher34
Understand how the balance between employment sectors is
changing
Employment can be divided into four main groups or sectors:
• Primary industry – people extract raw material from the land or sea e.g. farming
• Secondary industry – people are involved in manufacturing e.g. house building
• Tertiary industry – provide a services e.g. selling goods or nursing
• Quaternary industry – provide information and expert help e.g. IT
Employment structures: The proportion of people working in each of the primary,
secondary and tertiary sector
These are a method of showing employment structure and should be read in the
direction of the arrows
World Employment Structures
Globally LEDC’s
such as Nigeria
and Kenya have
high amounts of
primary industries
due to the fact
that there is a
lack of education
and they are
mainly subsidence
farmers. MEDC's
such as UK and
USA tend to focus
on Tertiary
activities due to
higher education rates and tertiary jobs are higher paid. Primary is low due to the fact
that most MEDC’s have taken to importing food stuffs etc as it is cheaper.35
Clarke-Fisher Model Tertiary services support
and promote quaternary
services
Economies start to develop and Incomes continue to rise,
incomes rise = demand for people start to consume more
manufactured goods increase = services = tertiary sector
secondary industry grows grows
In the pre-industrial stage low-income countries are mainly employed in primary
production, middle income countries are focused on secondary industries and finally
high-income countries are dominated by the tertiary sector.
This model tells us how employment changes over time and how the balance of
employment changes as a country develops. However it does assume that there is a
simple straight development path from LEDC’s to MEDC’s.
Process of industrialisation and deindustrialisation and the impacts of these
Industrialisation is a social and economic process which changes pre-industrial societies
(farming) to industrial ones. The industrial output is a good way of measuring how
industrialised a country is.
Deindustrialisation is the decline in manufacturing (secondary) industry and the growth
in tertiary and quaternary industries.
Greater competition from
Reduced demand for countries such as China and
Reasons for
traditional products due to India
De-industrialisation
new technologies
Mechanisation has increased productivity and
reduced the number of workers needed36
Named Example: Mexico: an industrialising country
Mexico was originally mainly focused on agriculture but the growth of industry meant
many people moved from the rural areas to the cities. In 1950s manufacturing became
the biggest provider of wealth. Manufacturing has been attracted here due to:
- a large and highly skilled workforce
- large consumer market (plenty of people to buy the products)
- Low distribution costs
- Close to government who make the decisions
Re-export businesses have sprung up which are located close to the USA boarder, they
are owned by foreign companies who process goods imported from the USA and re-
export duty free (no tax!). This has caused many problems such as the growth of the
‘informal sector’ e.g. shining shoes.
Named Example: Germany: a de-industrialised country
Germany has the 4th largest economy in the world. Deindustrialisation in the 1980s
forced manufacturing to move to lower-cost sites (many abroad) and the growth of
service industries. The decline in manufacturing meant that Germany had to act to
save its economy by setting up small manufacturing businesses. Germany now has 31%
of people employed in manufacturing but many people are now involved in knowledge-
based industries.
Factors leading to diversification of rural economy in a
developed country
Diversify = create more variety in jobs and industry so that people are not dependent
on just one activity e.g. farming.
Lack of affordable homes due to
Lack of transport links
purchasing of second homes in
- Public transport is infrequent and
rural areas = increasing house prices
expensive
Local depopulation
Challenges for the
- Younger people move out of rural Change in farming:
countryside
areas due to lack of jobs etc - Low wages, increasing
mechanisation, cheaper imports
Disappearance of local services e.g. - Supermarkets have driven prices
bus services, health services have down
declined37 There has been a decline in farming this has meant that farmers have had to diversify their livelihoods in order to survive: - Food Festival e.g. Ludlow Food Festival = celebration of local food that attracts lots of people - Rural sports e.g. Trout fishing in Cumbria. Includes ideas such as paintballing, shooting etc - Farm diversification e.g. Runnage Farm Dartmoor has accommodation. Increase of 40% to UK farm incomes due to diversification. Environmental impact of employment change in urban areas of a developing country Named Example: Mexico City Mexico City has seen the growth of its manufacturing industries which in turn attracts over 1000 people per day to the city. The growth of industry has created many problems: 1. Pollution of the air by both factories and cars. Mexico City is surrounded by mountains so the air cannot move freely around and this means pollutants such as nitrogen oxides become trapped becoming ‘photo-chemical smog’. 2. The new firms and around 20 million people all demand fresh water. Providing this is an issue as the city takes water from underground aquifers which are becoming empty. As they empty the land also sinks (9mm per year). 3. Water supply is polluted by firms who dump chemical waste into rivers 4. Waste disposal system cannot cope. Although the authorities collect 10,000 tones per day, the city produces 11,000 tonnes per day; the rest is thrown into the streets
38

Environmental impact of de-industrialisation and
economic diversification
Named Example: UK
Economic impacts                Social Impacts e.g. Glasgow   Environmental Impacts
- UK use to be a large          - Family breakdown            Positive:
shipbuilding area but has       - Alcoholism and crime        - More available land
declined over the years         - Permanent unemployment      - Less water used in
- Loss of personal income                                        industrial processes
- Loss of taxes to national                                   - Less energy required
and local governments                                            for machines
- Rising demand for income                                    - Reduced traffic
support services                                                 congestion
- Loss of income in the local                                 - Reduced noise and air
areas due people’s lack of                                       pollution
spending power (cant                                          Negative
afford to buy things)                                         - Derelict Land
                                                              - Empty factory buildings
                                                              - Good manufactured
                                                                 further away =
                                                                 transport issues
Identify the potential for regeneration and environmental
change on Brownfield sites
Brownfield site = an area of land which has been built on before and is suitable for
redevelopment
Greenfield site = an area of land that has not previously been built on before

Developing Brownfield sites does have some negatives:
- Often more expensive to develop because of clean up costs
- Regulations for reclaiming the sites can often be a barrier to new development
- Some of these sites can be important wildlife habitats

Named Example: Birmingham – Fort Dunlop
The West Midlands Regional Development Agency has helped to support the
regeneration of the city areas affected by industrial decline.

                                 Fort Dunlop in its prime employed 12000 people and in
                                 1816 a village known as ‘tyretown’ was developed around
                                 the site to meet the workers needs. The factory closed
                                 in 1980s when Dunlop moved its manufacturing abroad.
                                 It was empty for 20 years and then in 2002 it received
                                 planning permission to redevelop into a mixed-use
                                 sustainable 24-hr community.
39 Identify the potential for greener growth in urban areas. Green employment is ‘attempts to improve air and water quality, recycle and reduce waste, promote conservation and to improve the environment’. It includes the following: - Making ‘green’ products from natural renewable materials or recycled goods - Constructing green buildings that use less energy, recycle water and are built from natural materials - Offering ‘green’ services e.g. ecotourism - Quaternary services e.g. architects designing green buildings Examples 1) Eco-tourism Tries to respect the environment and local people, but reduce the impact of tourisms. It is growing on an average of 5% per year. Uluru (Ayers Rock) in Australia offers eco-tourism by the local Anangu people. They offer guided tours to cultural sits and teach about their desert life. - ‘High cost-low volume’ which means it costs £280 pert night at the hotels - Most tourists arrive by air – increasing environmental impact - Located in the remote desert so everything has to be brought in by road 2) Recycling Curitiba in located in SE Brazil. Its population has grown rapidly to 1.6 million creating the normal problems of unemployment, poor housing etc. In 1989 it was the first city in Brazil to introduce separation and recycling of its waste. Today 2/3rds of the city’s waste is processed creating employment sorting organic and inorganic waste. Recovered materials are then sold to local factories and the money is used to fund social programmes e.g. schooling.
40
Topic 5: Changing Cities
What you need to know:
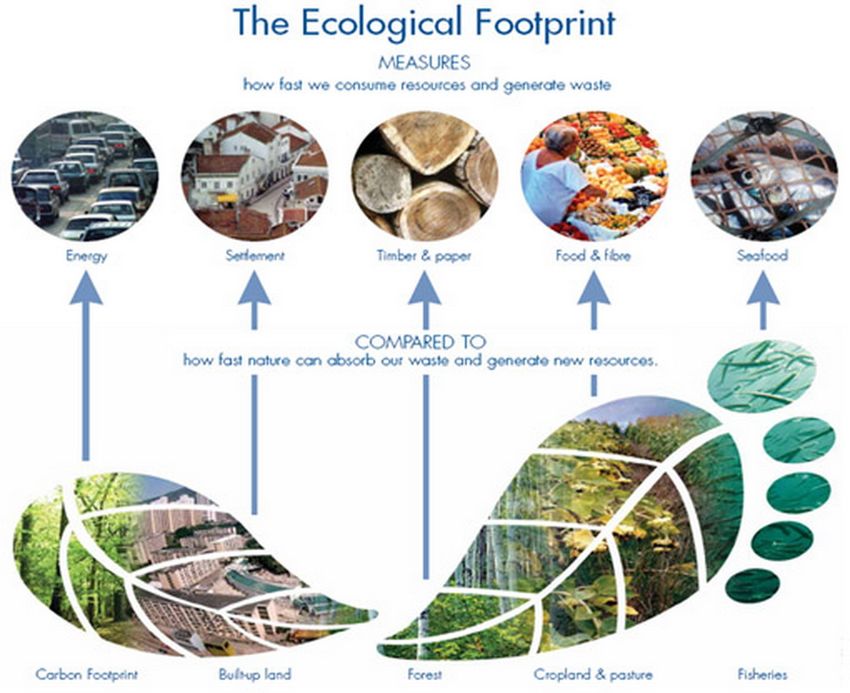
What an eco-footprint is and how we can calculate it
Why many cities have very large eco-footprints
Why eco-footprints vary in size from place to place
What are the main causes of environmental pollution
How we can manage the environment more sustainably and reduce our eco-
footprint
How we can reduce our waste
How we can make our transport more sustainable
How sustainable city living can improve the quality of life
What green consumerism is
How farmers markets are encouraging people to buy high-quality local
produce and cut down on food miles41
Key Terms
Alternative fuels Fuel sources that provide an alternative to fossil fuels
Bus lanes A marked lane in a road in which only public transport
vehicles such as buses and taxis are permitted
Congestion charging A system of traffic control that charges drivers who
enter the congested central area of the city e.g.
London
Eco-footprint A measure of how much land is needed to provide a
place e.g. city with all the energy, water and materials
it needs, including how much is needed to absorb its
pollution and waste
Energy consumption The amount of energy used by individuals, groups or
countries
Environmental pollution The degradation of the environment through the
emission of toxic waste material
Factory farming A highly organised agricultural system with high
inputs and high outputs
Farmers’ market A set of stalls run by farmers and good growers from
the local area
Green consumerism Choosing to buy environmentally friendly products
Household waste Material produced by households that needs to be
disposed of
Hybrid cars Cars which use electric batteries as well as petrol
engines
Landfill Disposal of rubbish by burying it and covering it over
with soil
Organic produce Food grown or produced without the use of chemicals
Park-and-ride schemes A system whereby private vehicles are left of the
edge of an urban area and people are then bused into
the centre
Quality of life The degree of well-being felt by an individual or group
of people in a particular area. This can relate to their
jobs, wagers, food etc.
Sustainable city Cities that have a number of policies that attempt to
reduce their impact on the environment (including the
surrounding area)
Throw-away society A society with the attitude to consumption that pays
little attention to the need to recycle42 What are the environmental issues facing cities? Urban regions and their eco-footprints When towns or cities are first established they use the surrounding countryside to produce food and raw materials for the people to survive. However, as the city expands it begins to have to rely on importing food and raw materials from other areas in order to support itself – therefore its eco-footprint has expanded. The eco-footprint is used to identify how sustainable a city is and what changes need to be made to improve the quality of life for people living within it.
43
How and why eco-footprints vary in size from place to
place?
A comparison of 2 places in the UK shows that:
City Planets Footprint (global
hectares)
Winchester 3.62 6.52
Salisbury 2.79 5.01
Both these cities have around 43,000 people and are only
80km apart. Why are their eco-footprints so different?
Incomes and house values in Winchester are higher so
people can afford to spend more on everything
Both cities have high employment rates
Both people commute out of Winchester and further to work than in Salisbury.
This means Winchester’s carbon footprint is increased, whereas in Salisbury
more people walk, cycle or use public transport
Differences between developed and developing countries
The link between wealth and environmental impacts is not clear as places such as
Germany and the Netherlands have high GDP per capita and longer life expectancies
than the UK but all have lower eco-footprints. However, eco-footprints of developing
countries tend to be much smaller than developed nations as their lifestyles and
consumption patterns are much different.You can also read