Gender Shades: Intersectional Accuracy Disparities in Commercial Gender Classification
←
→
Page content transcription
If your browser does not render page correctly, please read the page content below
Proceedings of Machine Learning Research 81:1–15, 2018     Conference on Fairness, Accountability, and Transparency

      Gender Shades: Intersectional Accuracy Disparities in
              Commercial Gender Classification∗
Joy Buolamwini                                                                                  joyab@mit.edu
MIT Media Lab 75 Amherst St. Cambridge, MA 02139
Timnit Gebru                                                                  timnit.gebru@microsoft.com
Microsoft Research 641 Avenue of the Americas, New York, NY 10011

Editors: Sorelle A. Friedler and Christo Wilson

                     Abstract                            who is hired, fired, granted a loan, or how long
     Recent studies demonstrate that machine             an individual spends in prison, decisions that
     learning algorithms can discriminate based          have traditionally been performed by humans are
     on classes like race and gender. In this            rapidly made by algorithms (O’Neil, 2017; Citron
     work, we present an approach to evaluate            and Pasquale, 2014). Even AI-based technologies
     bias present in automated facial analysis al-       that are not specifically trained to perform high-
     gorithms and datasets with respect to phe-          stakes tasks (such as determining how long some-
     notypic subgroups. Using the dermatolo-             one spends in prison) can be used in a pipeline
     gist approved Fitzpatrick Skin Type clas-           that performs such tasks. For example, while
     sification system, we characterize the gen-
                                                         face recognition software by itself should not be
     der and skin type distribution of two facial
     analysis benchmarks, IJB-A and Adience.
                                                         trained to determine the fate of an individual in
     We find that these datasets are overwhelm-          the criminal justice system, it is very likely that
     ingly composed of lighter-skinned subjects          such software is used to identify suspects. Thus,
     (79.6% for IJB-A and 86.2% for Adience)             an error in the output of a face recognition algo-
     and introduce a new facial analysis dataset         rithm used as input for other tasks can have se-
     which is balanced by gender and skin type.          rious consequences. For example, someone could
     We evaluate 3 commercial gender clas-               be wrongfully accused of a crime based on erro-
     sification systems using our dataset and            neous but confident misidentification of the per-
     show that darker-skinned females are the            petrator from security video footage analysis.
     most misclassified group (with error rates
     of up to 34.7%). The maximum error rate
     for lighter-skinned males is 0.8%. The             Many AI systems, e.g. face recognition tools,
     substantial disparities in the accuracy of
                                                     rely on machine learning algorithms that are
     classifying darker females, lighter females,
     darker males, and lighter males in gender
                                                     trained with labeled data.      It has recently
     classification systems require urgent atten-    been shown that algorithms trained with biased
     tion if commercial companies are to build       data have resulted in algorithmic discrimination
     genuinely fair, transparent and accountable     (Bolukbasi et al., 2016; Caliskan et al., 2017).
     facial analysis algorithms.                     Bolukbasi et al. even showed that the popular
     Keywords: Computer Vision, Algorith-            word embedding space, Word2Vec, encodes soci-
     mic Audit, Gender Classification                etal gender biases. The authors used Word2Vec
                                                     to train an analogy generator that fills in miss-
                                                     ing words in analogies. The analogy man is to
1. Introduction                                      computer programmer as woman is to “X” was
                                                     completed with “homemaker”, conforming to the
Artificial Intelligence (AI) is rapidly infiltrating
                                                     stereotype that programming is associated with
every aspect of society. From helping determine
                                                     men and homemaking with women. The biases
  ∗ Download our gender and skin type balanced PPB   in Word2Vec are thus likely to be propagated
    dataset at gendershades.org                      throughout any system that uses this embedding.

c 2018 J. Buolamwini & T. Gebru.
Gender Shades
Although many works have studied how to 1988) six-point skin type scale, allowing us to
create fairer algorithms, and benchmarked dis- benchmark the performance of gender classifica-
crimination in various contexts (Kilbertus et al., tion algorithms by skin type. Second, this work
2017; Hardt et al., 2016b,a), only a handful of introduces the first intersectional demographic
works have done this analysis for computer vi- and phenotypic evaluation of face-based gender
sion. However, computer vision systems with classification accuracy. Instead of evaluating ac-
inferior performance across demographics can curacy by gender or skin type alone, accuracy
have serious implications. Esteva et al. showed is also examined on 4 intersectional subgroups:
that simple convolutional neural networks can be darker females, darker males, lighter females, and
trained to detect melanoma from images, with ac- lighter males. The 3 evaluated commercial gen-
curacies as high as experts (Esteva et al., 2017). der classifiers have the lowest accuracy on darker
However, without a dataset that has labels for females. Since computer vision technology is be-
various skin characteristics such as color, thick- ing utilized in high-stakes sectors such as health-
ness, and the amount of hair, one cannot measure care and law enforcement, more work needs to
the accuracy of such automated skin cancer de- be done in benchmarking vision algorithms for
tection systems for individuals with different skin various demographic and phenotypic groups.
types. Similar to the well documented detrimen-
tal effects of biased clinical trials (Popejoy and
Fullerton, 2016; Melloni et al., 2010), biased sam- 2. Related Work
ples in AI for health care can result in treatments Automated Facial Analysis. Automated fa-
that do not work well for many segments of the cial image analysis describes a range of face per-
population. ception tasks including, but not limited to, face
In other contexts, a demographic group that detection (Zafeiriou et al., 2015; Mathias et al.,
is underrepresented in benchmark datasets can 2014; Bai and Ghanem, 2017), face classifica-
nonetheless be subjected to frequent targeting. tion (Reid et al., 2013; Levi and Hassner, 2015a;
The use of automated face recognition by law Rothe et al., 2016) and face recognition (Parkhi
enforcement provides such an example. At least et al., 2015; Wen et al., 2016; Ranjan et al., 2017).
117 million Americans are included in law en- Face recognition software is now built into most
forcement face recognition networks. A year- smart phones and companies such as Google,
long research investigation across 100 police de- IBM, Microsoft and Face++ have released com-
partments revealed that African-American indi- mercial software that perform automated facial
viduals are more likely to be stopped by law analysis (IBM; Microsoft; Face++; Google).
enforcement and be subjected to face recogni- A number of works have gone further than
tion searches than individuals of other ethnici- solely performing tasks like face detection, recog-
ties (Garvie et al., 2016). False positives and un- nition and classification that are easy for humans
warranted searches pose a threat to civil liberties. to perform. For example, companies such as Af-
Some face recognition systems have been shown fectiva (Affectiva) and researchers in academia
to misidentify people of color, women, and young attempt to identify emotions from images of peo-
people at high rates (Klare et al., 2012). Moni- ple’s faces (Dehghan et al., 2017; Srinivasan et al.,
toring phenotypic and demographic accuracy of 2016; Fabian Benitez-Quiroz et al., 2016). Some
these systems as well as their use is necessary to works have also used automated facial analysis
protect citizens’ rights and keep vendors and law to understand and help those with autism (Leo
enforcement accountable to the public. et al., 2015; Palestra et al., 2016). Controversial
We take a step in this direction by making two papers such as (Kosinski and Wang, 2017) claim
contributions. First, our work advances gender to determine the sexuality of Caucasian males
classification benchmarking by introducing a new whose profile pictures are on Facebook or dating
face dataset composed of 1270 unique individu- sites. And others such as (Wu and Zhang, 2016)
als that is more phenotypically balanced on the and Israeli based company Faception (Faception)
basis of skin type than existing benchmarks. To have developed software that purports to deter-
our knowledge this is the first gender classifica- mine an individual’s characteristics (e.g. propen-
tion benchmark labeled by the Fitzpatrick (TB, sity towards crime, IQ, terrorism) solely from
2Gender Shades
their faces. The clients of such software include Kemelmacher-Shlizerman et al., 2016). Any sys-
governments. An article by (Aguera Y Arcas et tematic error found in face detectors will in-
al., 2017) details the dangers and errors propa- evitably affect the composition of the bench-
gated by some of these aforementioned works. mark. Some datasets collected in this manner
Face detection and classification algorithms have already been documented to contain signif-
are also used by US-based law enforcement for icant demographic bias. For example, LFW, a
surveillance and crime prevention purposes. In dataset composed of celebrity faces which has
“The Perpetual Lineup”, Garvie and colleagues served as a gold standard benchmark for face
provide an in-depth analysis of the unregulated recognition, was estimated to be 77.5% male and
police use of face recognition and call for rigorous 83.5% White (Han and Jain, 2014). Although
standards of automated facial analysis, racial ac- (Taigman et al., 2014)’s face recognition system
curacy testing, and regularly informing the pub- recently reported 97.35% accuracy on the LFW
lic about the use of such technology (Garvie dataset, its performance is not broken down by
et al., 2016). Past research has also shown that race or gender. Given these skews in the LFW
the accuracies of face recognition systems used dataset, it is not clear that the high reported ac-
by US-based law enforcement are systematically curacy is applicable to people who are not well
lower for people labeled female, Black, or be- represented in the LFW benchmark. In response
tween the ages of 18—30 than for other demo- to these limitations, Intelligence Advanced Re-
graphic cohorts (Klare et al., 2012). The latest search Projects Activity (IARPA) released the
gender classification report from the National In- IJB-A dataset as the most geographically diverse
stitute for Standards and Technology (NIST) also set of collected faces (Klare et al., 2015). In
shows that algorithms NIST evaluated performed order to limit bias, no face detector was used
worse for female-labeled faces than male-labeled to select images containing faces. In compari-
faces (Ngan et al., 2015). son to face recognition, less work has been done
The lack of datasets that are labeled by eth- to benchmark performance on gender classifica-
nicity limits the generalizability of research ex- tion. In 2015, the Adience gender and age classi-
ploring the impact of ethnicity on gender classi- fication benchmark was released (Levi and Has-
fication accuracy. While the NIST gender report sner, 2015b). As of 2017, The National Insti-
explored the impact of ethnicity on gender classi- tute of Standards and Technology is starting an-
fication through the use of an ethnic proxy (coun- other challenge to spur improvement in face gen-
try of origin), none of the 10 locations used in der classification by expanding on the 2014-15
the study were in Africa or the Caribbean where study.
there are significant Black populations. On the
other hand, Farinella and Dugelay claimed that
3. Intersectional Benchmark
ethnicity has no effect on gender classification,
but they used a binary ethnic categorization An evaluation of gender classification perfor-
scheme: Caucasian and non-Caucasian (Farinella mance currently requires reducing the construct
and Dugelay, 2012). To address the underrepre- of gender into defined classes. In this work we use
sentation of people of African-descent in previ- the sex labels of “male” and “female” to define
ous studies, our work explores gender classifica- gender classes since the evaluated benchmarks
tion on African faces to further scholarship on and classification systems use these binary labels.
the impact of phenotype on gender classification. An intersectional evaluation further requires a
Benchmarks. Most large-scale attempts to dataset representing the defined genders with a
collect visual face datasets rely on face de- range of phenotypes that enable subgroup accu-
tection algorithms to first detect faces (Huang racy analysis. To assess the suitability of exist-
et al., 2007; Kemelmacher-Shlizerman et al., ing datasets for intersectional benchmarking, we
2016). Megaface, which to date is the largest provided skin type annotations for unique sub-
publicly available set of facial images, was com- jects within two selected datasets, and compared
posed utilizing Head Hunter (Mathias et al., the distribution of darker females, darker males,
2014) to select one million images from the Yahoo lighter females, and lighter males. Due to phe-
Flicker 100M image dataset (Thomee et al., 2015; notypic imbalances in existing benchmarks, we
3Gender Shades
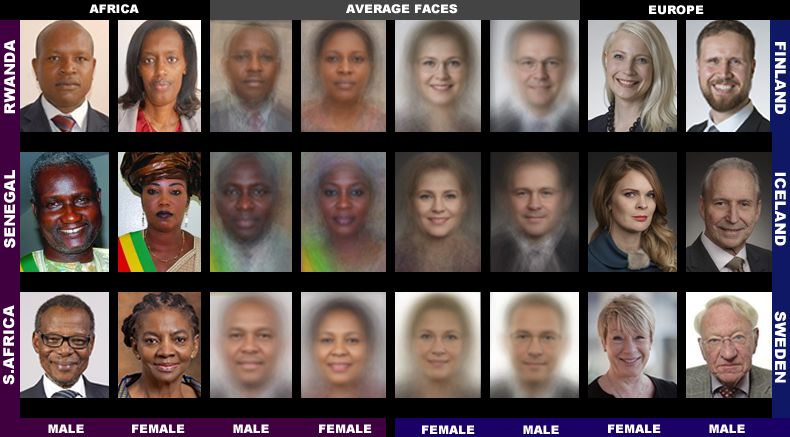
Figure 1: Example images and average faces from the new Pilot Parliaments Benchmark (PPB). As
the examples show, the images are constrained with relatively little variation in pose. The
subjects are composed of male and female parliamentarians from 6 countries. On average,
Senegalese subjects are the darkest skinned while those from Finland and Iceland are the
lightest skinned.
created a new dataset with more balanced skin tent across geographies: even within countries
type and gender representations. these categories change over time.
Since race and ethnic labels are unstable, we
3.1. Rationale for Phenotypic Labeling decided to use skin type as a more visually pre-
cise label to measure dataset diversity. Skin type
Though demographic labels for protected classes is one phenotypic attribute that can be used to
like race and ethnicity have been used for per- more objectively characterize datasets along with
forming algorithmic audits (Friedler et al., 2016; eye and nose shapes. Furthermore, skin type was
Angwin et al., 2016) and assessing dataset diver- chosen as a phenotypic factor of interest because
sity (Han and Jain, 2014), phenotypic labels are default camera settings are calibrated to expose
seldom used for these purposes. While race la- lighter-skinned individuals (Roth, 2009). Poorly
bels are suitable for assessing potential algorith- exposed images that result from sensor optimiza-
mic discrimination in some forms of data (e.g. tions for lighter-skinned subjects or poor illumi-
those used to predict criminal recidivism rates), nation can prove challenging for automated facial
they face two key limitations when used on visual analysis. By labeling faces with skin type, we
images. First, subjects’ phenotypic features can can increase our understanding of performance
vary widely within a racial or ethnic category. on this important phenotypic attribute.
For example, the skin types of individuals iden-
tifying as Black in the US can represent many
3.2. Existing Benchmark Selection
hues. Thus, facial analysis benchmarks consist-
Rationale
ing of lighter-skinned Black individuals would not
adequately represent darker-skinned ones. Sec- IJB-A is a US government benchmark released
ond, racial and ethnic categories are not consis- by the National Institute of Standards and Tech-
4Gender Shades
180o 120o 60o 0o 60o 120o 180o
60o
30o
0o
30o
60o
Darkest Lightest
Figure 2: The global distribution of skin color. Most Africans have darker skin while those from
Nordic countries are lighter-skinned. Image from (Encyclopedia Britannica) c Copyright
2012 Encyclopedia Britannica.
nology (NIST) in 2015. We chose to evaluate this from three African countries (Rwanda, Senegal,
dataset given the government’s involvement and South Africa) and three European countries (Ice-
the explicit development of the benchmark to be land, Finland, Sweden) selected for gender parity
geographically diverse (as mentioned in Sec. 2). in the national parliaments.
At the time of assessment in April and May of
2017, the dataset consisted of 500 unique sub-
Property PPB IJB-A Adience
jects who are public figures. One image of each
unique subject was manually labeled with one of Release Year 2017 2015 2014
six Fitzpatrick skin types (TB, 1988). #Subjects 1270 500 2284
Adience is a gender classification benchmark Avg. IPD 63 pixels - -
released in 2014 and was selected due to its re- BBox Size 141 (avg) ≥36 -
cency and unconstrained nature. The Adience IM Width 160-590 - 816
benchmark contains 2, 284 unique individual sub- IM Height 213-886 - 816
jects. 2, 194 of those subjects had reference im-
ages that were discernible enough to be labeled
by skin type and gender. Like the IJB-A dataset, Table 1: Various image characteristics of the Pi-
only one image of each subject was labeled for lot Parliaments Benchmark compared
skin type. with prior datasets. #Subjects denotes
the number of unique subjects, the aver-
age bounding box size is given in pixels,
3.3. Creation of Pilot Parliaments
and IM stands for image.
Benchmark
Preliminary analysis of the IJB-A and Adi-
ence benchmarks revealed overrepresentation of Figure 1 shows example images from PPB as
lighter males, underrepresentation of darker fe- well as average faces of males and females in
males, and underrepresentation of darker indi- each country represented in the datasets. We
viduals in general. We developed the Pilot Par- decided to use images of parliamentarians since
liaments Benchmark (PPB) to achieve better in- they are public figures with known identities and
tersectional representation on the basis of gender photos available under non-restrictive licenses
and skin type. PPB consists of 1270 individuals posted on government websites. To add skin
5Gender Shades
type diversity to the dataset, we chose parlia- Adience 7.4 6.4 44.6 41.6
%Darker Female
mentarians from African and European coun- %Darker Male
tries. Fig. 2 shows an approximated distribu- IJB-A 4.4 16.0 20.2 59.4
tion of average skin types around the world. As %Lighter Female
seen in the map, African countries typically have PPB 21.3 25.0 23.3 30.3
%Ligher Male
darker-skinned individuals whereas Nordic coun- 0% 25% 50% 75% 100%
tries tend to have lighter-skinned citizens. Col-
onization and migration patterns nonetheless in- Figure 3: The percentage of darker female,
fluence the phenotypic distribution of skin type lighter female, darker male, and lighter
and not all Africans are darker-skinned. Simi- male subjects in PPB, IJB-A and Adi-
larly, not all citizens of Nordic countries can be ence. Only 4.4% of subjects in Adience
classified as lighter-skinned. are darker-skinned and female in com-
The specific African and European countries parison to 21.3% in PPB.
were selected based on their ranking for gen-
der parity as assessed by the Inter Parliamen-
tary Union (Inter Parliamentary Union Rank-
ing). Of all the countries in the world, Rwanda
has the highest proportion of women in parlia- the world, the categorizations are fairly coarse.
ment. Nordic countries were also well represented Nonetheless, the scale provides a scientifically
in the top 10 nations. Given the gender parity based starting point for auditing algorithms and
and prevalence of lighter skin in the region, Ice- datasets by skin type.
land, Finland, and Sweden were chosen. To bal- Gender Labels. All evaluated companies
ance for darker skin, the next two highest-ranking provided a “gender classification” feature that
African nations, Senegal and South Africa, were uses the binary sex labels of female and male.
also added. This reductionist view of gender does not ade-
Table 1 compares image characteristics of PPB quately capture the complexities of gender or ad-
with IJB-A and Adience. PPB is highly con- dress transgender identities. The companies pro-
strained since it is composed of official profile vide no documentation to clarify if their gender
photos of parliamentarians. These profile photos classification systems which provide sex labels are
are taken under conditions with cooperative sub- classifying gender identity or biological sex. To
jects where pose is relatively fixed, illumination is label the PPB data, we use female and male la-
constant, and expressions are neutral or smiling. bels to indicate subjects perceived as women or
Conversely, the images in the IJB-A and Adi- men respectively.
ence benchmarks are unconstrained and subject
pose, illumination, and expression by construc- Labeling Process. For existing benchmarks,
tion have more variation. one author labeled each image with one of six
Fitzpatrick skin types and provided gender an-
notations for the IJB-A dataset. The Adience
3.4. Intersectional Labeling Methodology benchmark was already annotated for gender.
These preliminary skin type annotations on ex-
Skin Type Labels. We chose the Fitzpatrick
isting datasets were used to determine if a new
six-point labeling system to determine skin type
benchmark was needed.
labels given its scientific origins. Dermatologists
use this scale as the gold standard for skin classi- More annotation resources were used to label
fication and determining risk for skin cancer (TB, PPB. For the new parliamentarian benchmark,
1988). 3 annotators including the authors provided gen-
The six-point Fitzpatrick classification system der and Fitzpatrick labels. A board-certified sur-
which labels skin as Type I to Type VI is skewed gical dermatologist provided the definitive labels
towards lighter skin and has three categories that for the Fitzpatrick skin type. Gender labels were
can be applied to people perceived as White (Fig- determined based on the name of the parliamen-
ure 2). Yet when it comes to fully representing tarian, gendered title, prefixes such as Mr or Ms,
the sepia spectrum that characterizes the rest of and the appearance of the photo.
6Gender Shades
Set n F M Darker Lighter DF DM LF LM
All Subjects 1270 44.6% 55.4% 46.4% 53.6% 21.3% 25.0% 23.3% 30.3%
Africa 661 43.9% 56.1% 86.2% 13.8% 39.8% 46.4% 4.1% 9.7%
South Africa 437 41.4% 58.6% 79.2% 20.8% 35.2% 43.9% 6.2% 14.6%
Senegal 149 43.0% 57.0% 100.0% 0.0% 43.0% 57.0% 0.0% 0.0%
Rwanda 75 60.0% 40.0% 100.0% 0.0% 60.0% 40.0% 0.0% 0.0%
Europe 609 45.5% 54.5% 3.1% 96.9% 1.3% 1.8% 44.2% 52.7%
Sweden 349 46.7% 53.3% 4.9% 95.1% 2.0% 2.9% 44.7% 50.4%
Finland 197 42.6% 57.4% 1.0% 99.0% 0.5% 0.5% 42.1% 56.9%
Iceland 63 47.6% 52.4% 0.0% 100.0% 0.0% 0.0% 47.6% 52.4%
Table 2: Pilot Parliaments Benchmark decomposition by the total number of female subjects de-
noted as F, total number of male subjects (M), total number of darker and lighter subjects,
as well as female darker/lighter (DF/LF) and male darker/lighter subjects (DM/LM). The
group compositions are shown for all unique subjects, Africa, Europe and the countries in
our dataset located in each of these continents.
Dataset Lighter (I,II,III) Darker (IV, V, VI) Total
PPB 53.6% 681 46.4% 589 1270
IJB-A 79.6% 398 20.4% 102 500
Adience 86.2% 1892 13.8% 302 2194
Table 3: The distributions of lighter and darker-skinned subjects (according to the Fitzpatrick clas-
sification system) in PPB, IJB-A, and Adience datasets. Adience has the most skewed
distribution with 86.2% of the subjects consisting of lighter-skinned individuals whereas
PPB is more evenly distributed between lighter (53.6%) and darker (46.4%) subjects.
3.5. Fitzpatrick Skin Type Comparison female and lighter male subjects from Adience,
IJB-A, and PBB. PPB provides the most bal-
For the purposes of our analysis, lighter subjects
anced representation of all four groups whereas
will refer to faces with a Fitzpatrick skin type
IJB-A has the least balanced distribution.
of I,II, or III. Darker subjects will refer to faces
labeled with a Fitzpatrick skin type of IV,V, or Darker females are the least represented in
VI. We intentionally choose countries with ma- IJB-A (4.4%) and darker males are the least rep-
jority populations at opposite ends of the skin resented in Adience (6.4%). Lighter males are the
type scale to make the lighter/darker dichotomy most represented unique subjects in all datasets.
more distinct. The skin types are aggregated to IJB-A is composed of 59.4% unique lighter males
account for potential off-by-one errors since the whereas this percentage is reduced to 41.6% in
skin type is estimated using images instead of em- Adience and 30.3% in PPB. As seen in Table 3,
ploying a standard spectrophotometer and Fitz- Adience has the most skewed distribution by skin
patrick questionnaire. type.
Table 2 presents the gender, skin type, and in- While all the datasets have more lighter-
tersectional gender by skin type composition of skinned unique individuals, PPB is around half
PPB. And Figure 3 compares the percentage of light at 53.6% whereas the proportion of lighter-
images from darker female, darker male, lighter skinned unique subjects in IJB-A and Adience
7Gender Shades
is 79.6% and 86.2% respectively. PPB provides Face++ (Microsoft; IBM; Face++). Microsoft’s
substantially more darker-skinned unique sub- Cognitive Services Face API and IBM’s Wat-
jects than IJB-A and Adience. Even though Adi- son Visual Recognition API were chosen since
ence has 2194 labeled unique subjects, which is both companies have made large investments in
nearly twice that of the 1270 subjects in PPB, artificial intelligence, capture significant market
it has 302 darker subjects, nearly half the 589 shares in the machine learning services domain,
darker subjects in PPB. Overall, PPB has a more and provide public demonstrations of their fa-
balanced representation of lighter and darker cial analysis technology. At the time of evalua-
subjects as compared to the IJB-A and Adience tion, Google did not provide a publicly available
datasets. gender classifier. Previous studies have shown
that face recognition systems developed in West-
ern nations and those developed in Asian nations
4. Commercial Gender tend to perform better on their respective popu-
Classification Audit lations (Phillips et al., 2011). Face++, a com-
puter vision company headquartered in China
We evaluated 3 commercial gender classifiers.
with facial analysis technology previously inte-
Overall, male subjects were more accurately clas-
grated with some Lenovo computers, was thus
sified than female subjects replicating previous
chosen to see if this observation holds for gender
findings (Ngan et al., 2015), and lighter subjects
classification. Like Microsoft and IBM, Face++
were more accurately classified than darker in-
also provided a publicly available demonstration
dividuals. An intersectional breakdown reveals
of their gender classification capabilities at the
that all classifiers performed worst on darker fe-
time of evaluation(April and May 2017).
male subjects.
All of the companies offered gender classifica-
tion as a component of a set of proprietary facial
4.1. Key Findings on Evaluated analysis API services (Microsoft; IBM; Face++).
Classifiers The description of classification methodology
• All classifiers perform better on male faces lacked detail and there was no mention of what
than female faces (8.1% − 20.6% difference training data was used. At the time of evaluation,
in error rate) Microsoft’s Face Detect service was described as
using advanced statistical algorithms that “may
• All classifiers perform better on lighter faces not always be 100% precise” (Microsoft API Ref-
than darker faces (11.8% − 19.2% difference erence). IBM Watson Visual Recognition and
in error rate) Face++ services were said to use deep learning-
based algorithms (IBM API Reference; Face++
• All classifiers perform worst on darker female
Terms of Service). None of the commercial gen-
faces (20.8% − 34.7% error rate)
der classifiers chosen for this analysis reported
• Microsoft and IBM classifiers perform best performance metrics on existing gender estima-
on lighter male faces (error rates of 0.0% and tion benchmarks in their provided documenta-
0.3% respectively) tion. The Face++ terms of use explicitly dis-
claim any warranties of accuracy. Only IBM
• Face++ classifiers perform best on darker provided confidence scores (between 0 and 1) for
male faces (0.7% error rate) face-based gender classification labels. But it did
not report how any metrics like true positive rates
• The maximum difference in error rate be-
(TPR) or false positive rates (FPR) were bal-
tween the best and worst classified groups is
anced.
34.4%
4.2. Commercial Gender Classifier 4.3. Evaluation Methodology
Selection: Microsoft, IBM, Face++
In following the gender classification evaluation
We focus on gender classifiers sold in API bun- precedent established by the National Institute
dles made available by Microsoft, IBM, and for Standards and Technology (NIST), we assess
8Gender Shades
Classifier Metric All F M Darker Lighter DF DM LF LM
PPV(%) 93.7 89.3 97.4 87.1 99.3 79.2 94.0 98.3 100
Error Rate(%) 6.3 10.7 2.6 12.9 0.7 20.8 6.0 1.7 0.0
MSFT
TPR (%) 93.7 96.5 91.7 87.1 99.3 92.1 83.7 100 98.7
FPR (%) 6.3 8.3 3.5 12.9 0.7 16.3 7.9 1.3 0.0
PPV(%) 90.0 78.7 99.3 83.5 95.3 65.5 99.3 94.0 99.2
Error Rate(%) 10.0 21.3 0.7 16.5 4.7 34.5 0.7 6.0 0.8
Face++
TPR (%) 90.0 98.9 85.1 83.5 95.3 98.8 76.6 98.9 92.9
FPR (%) 10.0 14.9 1.1 16.5 4.7 23.4 1.2 7.1 1.1
PPV(%) 87.9 79.7 94.4 77.6 96.8 65.3 88.0 92.9 99.7
Error Rate(%) 12.1 20.3 5.6 22.4 3.2 34.7 12.0 7.1 0.3
IBM
TPR (%) 87.9 92.1 85.2 77.6 96.8 82.3 74.8 99.6 94.8
FPR (%) 12.1 14.8 7.9 22.4 3.2 25.2 17.7 5.20 0.4
Table 4: Gender classification performance as measured by the positive predictive value (PPV), error
rate (1-PPV), true positive rate (TPR), and false positive rate (FPR) of the 3 evaluated
commercial classifiers on the PPB dataset. All classifiers have the highest error rates for
darker-skinned females (ranging from 20.8% for Microsoft to 34.7% for IBM).
Classifier Metric DF DM LF LM
PPV(%) 76.2 100 100 100
Error Rate(%) 23.8 0.0 0.0 0.0
MSFT
TPR(%) 100 84.2 100 100
FPR(%) 15.8 0.0 0.0 0.0
PPV(%) 64.0 99.5 100 100
Error Rate(%) 36.0 0.5 0.0 0.0
Face++
TPR(%) 99.0 77.8 100 96.9
FPR(%) 22.2 1.03 3.08 0.0
PPV(%) 66.9 94.3 100 98.4
Error Rate(%) 33.1 5.7 0.0 1.6
IBM
TPR(%) 90.4 78.0 96.4 100
FPR(%) 22.0 9.7 0.0 3.6
Table 5: Gender classification performance as measured by the positive predictive value (PPV), error
rate (1-PPV), true positive rate (TPR), and false positive rate (FPR) of the 3 evaluated
commercial classifiers on the South African subset of the PPB dataset. Results for South
Africa follow the overall trend with the highest error rates seen on darker-skinned females.
the overall classification accuracy, male classifi- lowing groups: all subjects, male subjects, female
cation accuracy, and female classification accu- subjects, lighter subjects, darker subjects, darker
racy as measured by the positive predictive value females, darker males, lighter females, and lighter
(PPV). Extending beyond the NIST Methodol- males. See Table 2 in supplementary materials
ogy we also evaluate the true positive rate, false for results disaggregated by gender and each Fitz-
positive rate, and error rate (1-PPV) of the fol- patrick Skin Type.
9Gender Shades
4.4. Audit Results 61.0% to 72.4.1% of the classification error.
Lighter males who make up 30.3% of the bench-
Male and Female Error Rates
mark contribute only 0.0% to 2.4% of the total
To conduct a demographic performance analy- errors from these classifiers (See Table 1 in sup-
sis, the differences in male and female error rates plementary materials).
for each gender classifier are compared first in We present a deeper look at images from South
aggregate (Table 4) and then for South Africa Africa to see if differences in algorithmic per-
(Table 5). The NIST Evaluation of Automated formance are mainly due to image quality from
Gender Classification Algorithms report revealed each parliament. In PPB, the European parlia-
that gender classification performance on female mentary images tend to be of higher resolution
faces was 1.8% to 12.5% lower than performance with less pose variation when compared to images
on male faces for the nine evaluated algorithms from African parliaments. The South African
(Ngan et al., 2015). The gender misclassifica- parliament, however, has comparable image res-
tion rates on the Pilot Parliaments Benchmark olution and has the largest skin type spread of
replicate this trend across all classifiers. The dif- all the parliaments. Lighter subjects makeup
ferences between female and male classification 20.8% (n=91) of the images, and darker subjects
error rates range from 8.1% to 20.6%. The rela- make up the remaining 79.2% (n=346) of im-
tively high true positive rates for females indicate ages. Table 5 shows that all algorithms perform
that when a face is predicted to be female the es- worse on female and darker subjects when com-
timation is more likely to be correct than when pared to their counterpart male and lighter sub-
a face is predicted to be male. For the Microsoft jects. The Microsoft gender classifier performs
and IBM classifiers, the false positive rates (FPR) the best, with zero errors on classifying all males
for females are double or more than the FPR for and lighter females.
males. The FPR for females is more than 13 On the South African subset of the PPB bench-
times that of males with the Face++ classifier. mark, all the error for Microsoft arises from mis-
classifying images of darker females. Table 5 also
Darker and Lighter Error Rates shows that all classifiers perform worse on darker
females. Face++ is flawless on lighter males and
To conduct a phenotypic performance analysis,
lighter females. IBM performs best on lighter fe-
the differences in darker and lighter skin type er-
males with 0.0% error rate. Examining classifica-
ror rates for each gender classifier are compared
tion performance on the South African subset of
first in aggregate (Table 4) and then for South
PPB reveals trends that closely match the algo-
Africa (Table 5). All classifiers perform better
rithmic performance on the entire dataset. Thus,
on lighter subjects than darker subjects in PPB.
we conclude that variation in performance due
Microsoft achieves the best result with error rates
to the image characteristics of each country does
of 12.9% on darker subjects and 0.7% on lighter
not fully account for the differences in misclassifi-
individuals. On darker subjects, IBM achieves
cation rates between intersectional subgroups. In
the worst classification accuracy with an error
other words, the presence of more darker individ-
rate of 22.4%. This rate is nearly 7 times higher
uals is a better explanation for error rates than a
than the IBM error rate on lighter faces.
deviation in how images of parliamentarians are
composed and produced. However, darker skin
Intersectional Error Rates alone may not be fully responsible for misclassi-
To conduct an intersectional demographic and fication. Instead, darker skin may be highly cor-
phenotypic analysis, the error rates for four inter- related with facial geometries or gender display
sectional groups (darker females, darker males, norms that were less represented in the training
lighter females and lighter males) are compared data of the evaluated classifiers.
in aggregate and then for South Africa.
Across the board, darker females account for 4.5. Analysis of Results
the largest proportion of misclassified subjects.
Even though darker females make up 21.3% of The overall gender classification accuracy results
the PPB benchmark, they constitute between show the obfuscating nature of single perfor-
10Gender Shades
Confidence Scores 1.00 ●
0.75
●
●
●
●
●
●
●
●
●
●
● Gender
4.6. Accuracy Metrics
●
0.50 ● ● Female
0.25 ●
●
●
●
●
●
●
●
Male Microsoft and Face++ APIs solely output single
● ●
0.00
●
●
●
●
●
●
● ● ● labels indicating whether the face was classified
Darker Female Darker Male Lighter Female Lighter Male
Group as female or male. IBM’s API outputs an ad-
Figure 4: Gender classification confidence scores ditional number which indicates the confidence
from IBM (IBM). Scores are near 1 for with which the classification was made. Fig-
lighter male and female subjects while ure 4 plots the distribution of confidence values
they range from ∼ 0.75 − 1 for darker for each of the subgroups we evaluate (i.e. darker
females. females, darker males, lighter females and lighter
males). Numbers near 0 indicate low confidence
whereas those close to 1 denote high confidence
in classifying gender. As shown in the box plots,
the API is most confident in classifying lighter
mance metrics. Taken at face value, gender clas- males and least confident in classifying darker fe-
sification accuracies ranging from 87.9% to 93.7% males.
on the PPB dataset, suggest that these classi- While confidence values give users more in-
fiers can be used for all populations represented formation, commercial classifiers should provide
by the benchmark. A company might justify the additional metrics. All 3 evaluated APIs only
market readiness of a classifier by presenting per- provide gender classifications, they do not out-
formance results in aggregate. Yet a gender and put probabilities associated with the likelihood
phenotypic breakdown of the results shows that of being a particular gender. This indicates that
performance differs substantially for distinct sub- companies are choosing a threshold which deter-
groups. Classification is 8.1% − 20.6% worse on mines the classification: if the prediction proba-
female than male subjects and 11.8% − 19.2% bility is greater than this threshold, the image is
worse on darker than lighter subjects. determined to be that of a male (or female) sub-
ject, and viceversa if the probability is less than
Though helpful in seeing systematic error, gen- this number. This does not give users the abil-
der and skin type analysis by themselves do not ity to analyze true positive (TPR) and false posi-
present the whole story. Is misclassification dis- tive (FPR) rates for various subgroups if different
tributed evenly amongst all females? Are there thresholds were to be chosen. The commercial
other factors at play? Likewise, is the misclassi- classifiers have picked thresholds that result in
fication of darker skin uniform across gender? specific TPR and FPR rates for each subgroup.
And the FPR for some groups can be much higher
The intersectional error analysis that targets than those for others. By having APIs that fail
gender classification performance on darker fe- to provide the ability to adjust these thresholds,
male, lighter female, darker male, and lighter they are limiting users’ ability to pick their own
male subgroups provides more answers. Darker TPR/FPR trade-off.
females have the highest error rates for all gender
classifiers ranging from 20.8% − 34.7%. For Mi-
4.7. Data Quality and Sensors
crosoft and IBM classifiers lighter males are the
best classified group with 0.0% and 0.3% error It is well established that pose, illumination, and
rates respectively. Face++ classifies darker males expression (PIE) can impact the accuracy of au-
best with an error rate of 0.7%. When examining tomated facial analysis. Techniques to create ro-
the gap in lighter and darker skin classification, bust systems that are invariant to pose, illumi-
we see that even though darker females are most nation, expression, occlusions, and background
impacted, darker males are still more misclassi- have received substantial attention in computer
fied than lighter males for IBM and Microsoft. vision research (Kakadiaris et al., 2017; Ganguly
The most improvement is needed on darker fe- et al., 2015; Ahmad Radzi et al., 2014). Illumi-
males specifically. More broadly, the error gaps nation is of particular importance when doing an
between male and female classification along with evaluation based on skin type. Default camera
lighter and darker classification should be closed. settings are often optimized to expose lighter skin
11Gender Shades
better than darker skin (Roth, 2009). Underex- methods to improve dataset composition, feature
posed or overexposed images that present signif- selection, and neural network architectures.
icant information loss can make accurate classi- Because algorithmic fairness is based on differ-
fication challenging. ent contextual assumptions and optimizations for
With full awareness of the challenges that arise accuracy, this work aimed to show why we need
due to pose and illumination, we intentionally rigorous reporting on the performance metrics on
chose an optimistic sample of constrained images which algorithmic fairness debates center. The
that were taken from the parliamentarian web- work focuses on increasing phenotypic and demo-
sites. Each country had its peculiarities. Images graphic representation in face datasets and algo-
from Rwanda and Senegal had more pose and rithmic evaluation. Inclusive benchmark datasets
illumination variation than images from other and subgroup accuracy reports will be necessary
countries (Figure 1). The Swedish parliamen- to increase transparency and accountability in
tarians all had photos that were taken with a artificial intelligence. For human-centered com-
shadow on the face. The South African images puter vision, we define transparency as providing
had the most consistent pose and illumination. information on the demographic and phenotypic
The South African subset was also composed of composition of training and benchmark datasets.
a substantial number of lighter and darker sub- We define accountability as reporting algorith-
jects. Given the diversity of the subset, the mic performance on demographic and pheno-
high image resolution, and the consistency of typic subgroups and actively working to close
illumination and pose, our finding that classi- performance gaps where they arise. Algorith-
fication accuracy varied by gender, skin type, mic transparency and accountability reach be-
and the intersection of gender with skin type do yond technical reports and should include mech-
not appear to be confounded by the quality of anisms for consent and redress which we do not
sensor readings. The disparities presented with focus on here. Nonetheless, the findings from this
such a constrained dataset do suggest that error work concerning benchmark representation and
rates would be higher on more challenging uncon- intersectional auditing provide empirical support
strained datasets. Future work should explore for increased demographic and phenotypic trans-
gender classification on an inclusive benchmark parency and accountability in artificial intelli-
composed of unconstrained images. gence.
5. Conclusion Acknowledgments
We measured the accuracy of 3 commercial gen- We thank board-certified surgical dermatologist
der classification algorithms on the new Pilot Dr. Helen Raynham for providing the official
Parliaments Benchmark which is balanced by Fitzpatrick annotations for the Pilot Parliaments
gender and skin type. We annotated the dataset Benchmark.
with the Fitzpatrick skin classification system
and tested gender classification performance on 4
subgroups: darker females, darker males, lighter References
females and lighter males. We found that all clas-
Face++ API. http://old.faceplusplus.com/
sifiers performed best for lighter individuals and
demo-detect/. Accessed: 2017-10-06.
males overall. The classifiers performed worst
for darker females. Further work is needed to Face, Google APIs for Android, Google De-
see if the substantial error rate gaps on the ba- velopers. https://developers.google.com/
sis of gender, skin type and intersectional sub- android/reference/com/google/android/
group revealed in this study of gender classifica- gms/vision/face/Face. Accessed: 2017-10-
tion persist in other human-based computer vi- 06.
sion tasks. Future work should explore intersec-
tional error analysis of facial detection, identifi- Watson Visual Recognition. https :
cation and verification. Intersectional phenotypic / / www.ibm.com / watson / services / visual -
and demographic error analysis can help inform recognition/. Accessed: 2017-10-06.
12Gender Shades
Microsoft Face API. https : / / in Neural Information Processing Systems 29,
www.microsoft.com / cognitive - services / pages 4349–4357. Curran Associates, Inc.,
en-us/faceapi. Accessed: 2017-10-06. 2016. URL http://papers.nips.cc/paper/
6228 - man - is - to - computer - programmer -
Affectiva Emotion Recognition Software and as - woman - is - to - homemaker - debiasing -
Analysis. https://www.affectiva.com/. Ac- word-embeddings.pdf.
cessed: 2017-10-06.
Physiognomys New Clothes. https : / / Encyclopedia Britannica. Skin distribution map.
medium.com / @blaisea / physiognomys - new - https://media1.britannica.com/eb-media/
clothes-f2d4b59fdd6a. Accessed: 2017-10- 59 / 61759 - 004 - 9A507F1C.gif, 2012. Ac-
06. cessed: 2017-12-17.
Face++ Terms of Use. a. Accessed: 2018-12-13. Aylin Caliskan, Joanna J Bryson, and Arvind
Narayanan. Semantics derived automatically
Faception, Facial Personality Analytics. https: from language corpora contain human-like bi-
//www.faception.com/, b. Accessed: 2017-10- ases. Science, 356(6334):183–186, 2017.
06.
Visual Recognition API Reference. Accessed: Danielle Keats Citron and Frank A Pasquale.
2018-12-13. The scored society: due process for automated
predictions. 2014.
How to Detect Faces in Image. Accessed: 2018-
12-13. Afshin Dehghan, Enrique G Ortiz, Guang Shu,
and Syed Zain Masood. Dager: Deep age,
Proportion of seats held by women in national
gender and emotion recognition using con-
parliaments. https://data.worldbank.org/
volutional neural network. arXiv preprint
indicator/SG.GEN.PARL.ZS?year high desc=
arXiv:1702.04280, 2017.
true. Accessed: 2017-10-06.
Syafeeza Ahmad Radzi, Khalil-Hani Mohamad, Andre Esteva, Brett Kuprel, Roberto A Novoa,
Shan Sung Liew, and Rabia Bakhteri. Con- Justin Ko, Susan M Swetter, Helen M Blau,
volutional neural network for face recognition and Sebastian Thrun. Dermatologist-level clas-
with pose and illumination variation. Interna- sification of skin cancer with deep neural net-
tional Journal of Engineering and Technology works. Nature, 542(7639):115–118, 2017.
(IJET), 6(1):44–57, 2014.
C Fabian Benitez-Quiroz, Ramprakash Srini-
Julia Angwin, Jeff Larson, Surya Mattu, and vasan, and Aleix M Martinez. Emotionet: An
Lauren Kirchner. Machine bias: Theres soft- accurate, real-time algorithm for the automatic
ware used across the country to predict future annotation of a million facial expressions in the
criminals. and its biased against blacks. ProP- wild. In Proceedings of the IEEE Conference
ublica, May, 23, 2016. on Computer Vision and Pattern Recognition,
pages 5562–5570, 2016.
Yancheng Bai and Bernard Ghanem. Multi-scale
fully convolutional network for face detection
in the wild. In Computer Vision and Pattern Giovanna Farinella and Jean-Luc Dugelay. De-
Recognition Workshops (CVPRW), 2017 IEEE mographic classification: Do gender and eth-
Conference on, pages 2078–2087. IEEE, 2017. nicity affect each other? In Informatics, Elec-
tronics & Vision (ICIEV), 2012 International
Tolga Bolukbasi, Kai-Wei Chang, James Y Zou, Conference on, pages 383–390. IEEE, 2012.
Venkatesh Saligrama, and Adam T Kalai. Man
is to computer programmer as woman is to Sorelle A Friedler, Carlos Scheidegger, and
homemaker? debiasing word embeddings. In Suresh Venkatasubramanian. On the (im)
D. D. Lee, M. Sugiyama, U. V. Luxburg, possibility of fairness. arXiv preprint
I. Guyon, and R. Garnett, editors, Advances arXiv:1609.07236, 2016.
13Gender Shades
Suranjan Ganguly, Debotosh Bhattacharjee, and Brendan F Klare, Mark J Burge, Joshua C
Mita Nasipuri. Illumination, pose and occlu- Klontz, Richard W Vorder Bruegge, and
sion invariant face recognition from range im- Anil K Jain. Face recognition performance:
ages using erfi model. International Journal of Role of demographic information. IEEE Trans-
System Dynamics Applications (IJSDA), 4(2): actions on Information Forensics and Security,
1–20, 2015. 7(6):1789–1801, 2012.
Clare Garvie, Alvaro Bedoya, and Jonathan Brendan F Klare, Ben Klein, Emma Taborsky,
Frankle. The Perpetual Line-Up: Unregulated Austin Blanton, Jordan Cheney, Kristen Allen,
Police Face Recognition in America. George- Patrick Grother, Alan Mah, and Anil K Jain.
town Law, Center on Privacy & Technology, Pushing the frontiers of unconstrained face de-
2016. tection and recognition: Iarpa janus bench-
Hu Han and Anil K Jain. Age, gender and mark a. In Proceedings of the IEEE Conference
race estimation from unconstrained face im- on Computer Vision and Pattern Recognition,
ages. Dept. Comput. Sci. Eng., Michigan State pages 1931–1939, 2015.
Univ., East Lansing, MI, USA, MSU Tech.
Michal Kosinski and Yilun Wang. Deep neural
Rep.(MSU-CSE-14-5), 2014.
networks are more accurate than humans at
Moritz Hardt, Eric Price, Nati Srebro, et al. detecting sexual orientation from facial images.
Equality of opportunity in supervised learning. 2017.
In Advances in Neural Information Processing
Systems, pages 3315–3323, 2016a. Marco Leo, Marco Del Coco, Pierluigi Carcagni,
Cosimo Distante, Massimo Bernava, Giovanni
Moritz Hardt, Eric Price, Nati Srebro, et al. Pioggia, and Giuseppe Palestra. Automatic
Equality of opportunity in supervised learning. emotion recognition in robot-children interac-
In Advances in Neural Information Processing tion for asd treatment. In Proceedings of the
Systems, pages 3315–3323, 2016b. IEEE International Conference on Computer
Vision Workshops, pages 145–153, 2015.
Gary B Huang, Manu Ramesh, Tamara Berg,
and Erik Learned-Miller. Labeled faces in the Gil Levi and Tal Hassner. Age and gender classifi-
wild: A database for studying face recogni- cation using convolutional neural networks. In
tion in unconstrained environments. Technical Proceedings of the IEEE Conference on Com-
report, Technical Report 07-49, University of puter Vision and Pattern Recognition Work-
Massachusetts, Amherst, 2007. shops, pages 34–42, 2015a.
Ioannis A Kakadiaris, George Toderici, Georgios
Gil Levi and Tal Hassner. Age and gender classifi-
Evangelopoulos, Georgios Passalis, Dat Chu,
cation using convolutional neural networks. In
Xi Zhao, Shishir K Shah, and Theoharis Theo-
Proceedings of the IEEE Conference on Com-
haris. 3d-2d face recognition with pose and
puter Vision and Pattern Recognition Work-
illumination normalization. Computer Vision
shops, pages 34–42, 2015b.
and Image Understanding, 154:137–151, 2017.
Ira Kemelmacher-Shlizerman, Steven M Seitz, Markus Mathias, Rodrigo Benenson, Marco Ped-
Daniel Miller, and Evan Brossard. The ersoli, and Luc Van Gool. Face detection with-
megaface benchmark: 1 million faces for recog- out bells and whistles. In European Conference
nition at scale. In Proceedings of the IEEE on Computer Vision, pages 720–735. Springer,
Conference on Computer Vision and Pattern 2014.
Recognition, pages 4873–4882, 2016.
Chiara Melloni, Jeffrey S Berger, Tracy Y Wang,
Niki Kilbertus, Mateo Rojas-Carulla, Giambat- Funda Gunes, Amanda Stebbins, Karen S
tista Parascandolo, Moritz Hardt, Dominik Pieper, Rowena J Dolor, Pamela S Douglas,
Janzing, and Bernhard Schölkopf. Avoiding Daniel B Mark, and L Kristin Newby. Repre-
discrimination through causal reasoning. arXiv sentation of women in randomized clinical tri-
preprint arXiv:1706.02744, 2017. als of cardiovascular disease prevention. Circu-
14Gender Shades
lation: Cardiovascular Quality and Outcomes, Rasmus Rothe, Radu Timofte, and Luc
3(2):135–142, 2010. Van Gool. Deep expectation of real and ap-
parent age from a single image without facial
Mei Ngan, Mei Ngan, and Patrick Grother. Face landmarks. International Journal of Computer
recognition vendor test (FRVT) performance of Vision, pages 1–14, 2016.
automated gender classification algorithms. US
Department of Commerce, National Institute Ramprakash Srinivasan, Julie D Golomb, and
of Standards and Technology, 2015. Aleix M Martinez. A neural basis of facial ac-
tion recognition in humans. Journal of Neuro-
Cathy O’Neil. Weapons of math destruction: science, 36(16):4434–4442, 2016.
How big data increases inequality and threat-
Yaniv Taigman, Ming Yang, Marc’Aurelio Ran-
ens democracy. Broadway Books, 2017.
zato, and Lior Wolf. Deepface: Closing the
gap to human-level performance in face veri-
Giuseppe Palestra, Giovanna Varni, Mohamed
fication. In Proceedings of the IEEE confer-
Chetouani, and Floriana Esposito. A multi-
ence on computer vision and pattern recogni-
modal and multilevel system for robotics treat-
tion, pages 1701–1708, 2014.
ment of autism in children. In Proceedings of
the International Workshop on Social Learn- Fitzpatrick TB. The validity and practicality of
ing and Multimodal Interaction for Designing sun-reactive skin types i through vi. Archives
Artificial Agents, page 3. ACM, 2016. of Dermatology, 124(6):869–871, 1988. doi:
10.1001 / archderm.1988.01670060015008.
Omkar M Parkhi, Andrea Vedaldi, Andrew Zis- URL +http : / / dx.doi.org / 10.1001 /
serman, et al. Deep face recognition. In archderm.1988.01670060015008.
BMVC, volume 1, page 6, 2015.
Bart Thomee, David A Shamma, Gerald Fried-
P Jonathon Phillips, Fang Jiang, Abhijit land, Benjamin Elizalde, Karl Ni, Douglas
Narvekar, Julianne Ayyad, and Alice J Poland, Damian Borth, and Li-Jia Li. The
O’Toole. An other-race effect for face recogni- new data and new challenges in multimedia re-
tion algorithms. ACM Transactions on Applied search. arXiv preprint arXiv:1503.01817, 1(8),
Perception (TAP), 8(2):14, 2011. 2015.
Alice B Popejoy and Stephanie M Fullerton. Ge- Yandong Wen, Kaipeng Zhang, Zhifeng Li, and
nomics is failing on diversity. Nature, 538 Yu Qiao. A discriminative feature learning ap-
(7624):161, 2016. proach for deep face recognition. In European
Conference on Computer Vision, pages 499–
Rajeev Ranjan, Swami Sankaranarayanan, Car- 515. Springer, 2016.
los D Castillo, and Rama Chellappa. An all-in-
Xiaolin Wu and Xi Zhang. Automated infer-
one convolutional neural network for face anal-
ence on criminality using face images. arXiv
ysis. In Automatic Face & Gesture Recogni-
preprint arXiv:1611.04135, 2016.
tion (FG 2017), 2017 12th IEEE International
Conference on, pages 17–24. IEEE, 2017. Stefanos Zafeiriou, Cha Zhang, and Zhengyou
Zhang. A survey on face detection in the wild:
Daniel Reid, Sina Samangooei, Cunjian Chen, past, present and future. Computer Vision and
Mark Nixon, and Arun Ross. Soft biometrics Image Understanding, 138:1–24, 2015.
for surveillance: an overview. Machine learn-
ing: theory and applications. Elsevier, pages
327–352, 2013.
Lorna Roth. Looking at shirley, the ultimate
norm: Colour balance, image technologies, and
cognitive equity. Canadian Journal of Commu-
nication, 34(1):111, 2009.
15You can also read