Gene environment dependencies lead to collider bias in models with polygenic scores
←
→
Page content transcription
If your browser does not render page correctly, please read the page content below
www.nature.com/scientificreports
OPEN Gene‑environment dependencies
lead to collider bias in models
with polygenic scores
Evelina T. Akimova1,2*, Richard Breen1,3, David M. Brazel2,3 & Melinda C. Mills2,3
The application of polygenic scores has transformed our ability to investigate whether and how
genetic and environmental factors jointly contribute to the variation of complex traits. Modelling
the complex interplay between genes and environment, however, raises serious methodological
challenges. Here we illustrate the largely unrecognised impact of gene-environment dependencies
on the identification of the effects of genes and their variation across environments. We show that
controlling for heritable covariates in regression models that include polygenic scores as independent
variables introduces endogenous selection bias when one or more of these covariates depends on
unmeasured factors that also affect the outcome. This results in the problem of conditioning on a
collider, which in turn leads to spurious associations and effect sizes. Using graphical and simulation
methods we demonstrate that the degree of bias depends on the strength of the gene-covariate
correlation and of hidden heterogeneity linking covariates with outcomes, regardless of whether the
main analytic focus is mediation, confounding, or gene × covariate (commonly gene × environment)
interactions. We offer potential solutions, highlighting the importance of causal inference. We also
urge further caution when fitting and interpreting models with polygenic scores and non-exogenous
environments or phenotypes and demonstrate how spurious associations are likely to arise, advancing
our understanding of such results.
The importance of understanding the joint contributions of genetic and environmental variation underlying
complex traits is widely recognised. The rise of polygenic scores has resulted in a surge of studies investigating the
mediating and moderating roles of environments along with genetic confounding1 (i.e., whether genes confound
associations between environments or phenotypes). Yet, disentangling the relative importance of polygenic scores
and environmental covariates is difficult. Various methodological concerns have been raised, including but not
limited to, the power and predictive accuracy of polygenic s cores2–4 and the non-exogenous nature of environ-
mental exposures and their c onsequences5–7. Moreover, genes and environments do not operate independently,
necessitating greater scrutiny of both conventional models and new methods addressing gene-environment-trait
correlations8,9. Here we address further methodological problems arising from gene-environment correlations
that have gone largely unrecognised yet make identification of causal effects and the accurate estimation of
associations even more challenging.
We illustrate how the presence of genetic predispositions associated with exposures to an environment (or
phenotype in cases of genetic confounding) introduces endogenous selection bias in a regression analysis. Herit-
able covariates in regression models with polygenic scores are endogenous variables, and this can give rise to the
problem of conditioning on a collider. Collider bias is an important statistical problem that destabilises regression
models and it can arise for a variety of reasons, including sample selection and attrition10. We demonstrate that
collider bias is likely to occur not only in genetic association studies but also in other analyses where polygenic
scores are included, regardless of whether the main focus is mediation, confounding, or gene × environment
(G × E) interaction.
Moreover, the issue we describe here is linked to a growing body of literature showing the heritability of
environments, known as gene-environment correlation (rGE) and pleiotropy. To date, discussion of the meth-
odological implications of these findings has focussed on the implications for G × E interaction studies (e.g. Dud-
bridge and F letcher7) and studies using polygenic scores as instrumental variables (e.g. Conley and Z hang11). We
expand this focus and show that if both genetic and environmental covariates are included in a statistical model,
gene-environment correlations may lead to spurious estimates and effect sizes. Understanding the mechanisms
1
Department of Sociology, University of Oxford, Oxford OX1 1JD, UK. 2Leverhulme Centre for Demographic
Science, University of Oxford, Oxford OX1 1JD, UK. 3Nuffield College, University of Oxford, Oxford OX1 1NF,
UK. *email: evelina.akimova@sociology.ox.ac.uk
Scientific Reports | (2021) 11:9457 | https://doi.org/10.1038/s41598-021-89020-x 1
Vol.:(0123456789)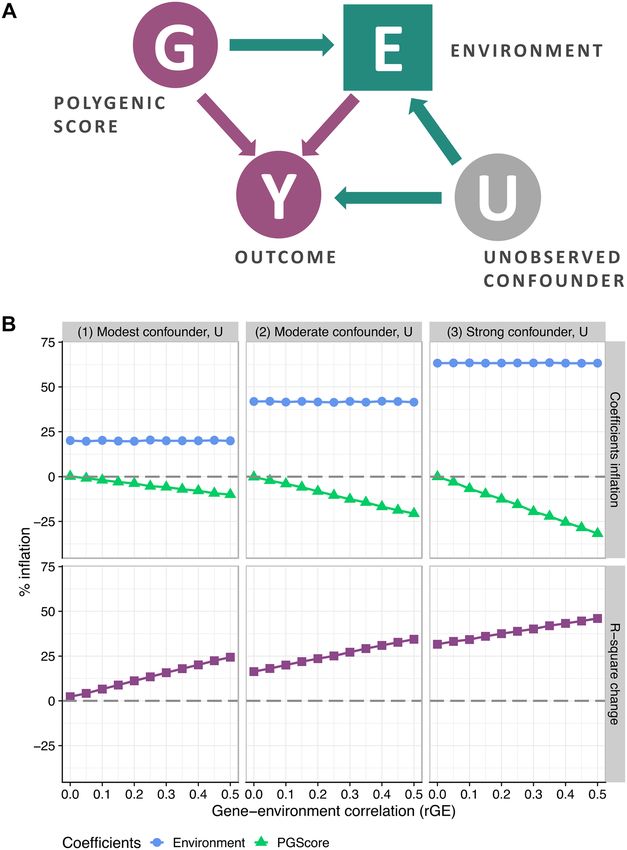
www.nature.com/scientificreports/
that generate these dependencies is crucial for how we may solve the issue. We emphasise that researchers must
grasp the conceptual differences between passive, evocative, and active gene-environment c orrelations12 and the
potential sources of endogeneity of environmental covariates in order to obtain results that are not biased due
to conditioning on a collider.
We use a graphical approach to demonstrate these methodological problems, illustrated by simulations. We
then discuss the consequences of the bias in linear models and offer some potential solutions. The problems
outlined here are relevant for making both causal and non-causal claims, with serious implications for the
interpretation of results.
Endogenous selection bias
The notion of endogenous selection bias arises from the broader concept of selection bias. While the term selec-
tion bias is very widely u sed13, endogenous selection bias commonly arises in analyses in which we adjust for an
endogenous variable—that is, a variable caused by other, unmeasured variables which also affect the outcome.
In this case, bias arises through the adjusting variable operating as a collider. Collider bias was demonstrated by
Day et al.14 in the context of genetic association studies where such biases led to false-positive and biologically
spurious associations. Their investigation considered the case of sex and autosomal genetic variants associated
with height: neither factor is plausibly correlated with the other but both have an effect on height. Day et al.
showed that the inclusion of height as a covariate created a robust but biologically spurious association between
sex and height-associated variants. The bias arose because the respondent’s height is a collider variable—a direct
product of another covariate (SNPs of height) and an outcome (sex).
In what follows we consider a situation in which genes and environment are correlated (for reasons discussed
below) and the environmental variable(s) is affected by variables not measured in the study but which also
affect the outcome. We then discuss the consequences of the resulting collider bias for both additive and G × E
interaction models.
Additive models with polygenic scores. The first type of model we consider is the rather straightfor-
ward design where polygenic scores and environmental covariates (or phenotypes if they are used as covariates)
are jointly included as a set of predictors for an outcome of interest. Such models are intended to reveal whether
genetic influences confound associations between environments and outcomes or whether environments are
mediators of the link between genetic variants and phenotypes. Examples include linking health disparities with
socio-economic outcomes such as the relationship between attention-deficit hyperactivity disorder (ADHD), its
polygenic prediction, and IQ on educational outcomes among teenagers (e.g. Stergiakouli et al.15). Other exam-
ples include studies that examine genetic risk and lifestyle in relation to stroke and cardiovascular mortality (e.g.
Rutten-Jacobs et al.16; Yun et al.17). Another example is where income and labour market outcomes are predicted
by educational measures (e.g., grades, years of education) along with an educational attainment polygenic score
(e.g. Ayorech et al.18; Papageorge and Thom19). Or the study of the variation of exam scores in relation to school
types and polygenic prediction of education (e.g. Smith-Woolley et al.20).
All of these studies are similar with respect to the nature of environmental variables—they are not exogenous,
being the direct or indirect products of polygenic scores which are also included into the models. Dependence
of these covariates could arise through the inclusion of a phenotypic variable—the scenario that is prevalent
in genetic confounding studies. For example, the ADHD polygenic score is directly linked to the diagnosis of
ADHD, so once genetic risk and the corresponding phenotype are covariates, their dependency is present in
the model.
Dependencies could also arise when gene-environment correlation (rGE) plays a role. rGE occurs when expo-
sure to an environment depends on heritable inclinations21. While strictly speaking rGE is a statistical correlation
between genetic variation and exposure to an environment, behavioral genetics theory distinguishes between
passive, evocative, and active m echanisms12,22. Passive rGE arises because non-transmitted parental alleles may
influence the rearing environment, which induces a correlation if parental characteristics are not controlled for.
Moreover, Kong et al.23 demonstrate that the signals obtained from GWAS are likely to reflect both direct and
genetic nurturing effects, which further contributes to our expectation of interdependency between polygenic
scores and environments. Associations could also arise due to active and evocative selection in environments.
Applying the polygenic prediction of educational attainment as an example, we see that it contributes to the vari-
ation of school g rades20 which likely reflects active rGE (i.e., children selecting their environments for genetically
influenced reasons). It could also be linked to school type since parents adjust their educational choices for chil-
dren depending on their child’s characteristics which are partially due to genetic differences, reflecting evocative
rGE (i.e., the child indirectly shapes the environment via the reaction of parent’s to the child’s behaviour)24,25.
It is also important to consider the role of pleiotropy as a cause of gene-environment dependencies. In gen-
eral, pleiotropy refers to situations when one gene influences multiple traits or two traits share genetic variants.
There are different mechanisms involved described by Van Rheenen et al.26 into horizontal, vertical, and spurious
pleiotropy. Horizontal pleiotropy occurs when genetic variants are either linked to multiple traits, either directly
or through a series of intermediate traits; vertical pleiotropy arises if we expect causation among a set of traits;
and, spurious pleiotropy is the result of linkage disequilibrium (LD), misclassification, or other biases. The most
relevant aspect for our argument is that any type of pleiotropy could cause gene-environment dependency. As
noted in the literature11,27, pleiotropy is not unusual among heritable traits. Rather, the null hypothesis is that
pleiotropy exists unless proven otherwise.
One way to assess whether consistent pleiotropy, at the level of observed genetic variance, exists is via genetic
correlations (rg)26,27. To illustrate this point, we can consider studies on cardiovascular mortality and incidents
of stroke which investigate the joint importance of polygenic risk scores and lifestyles16,17. Conceptualisation of
Scientific Reports | (2021) 11:9457 | https://doi.org/10.1038/s41598-021-89020-x 2
Vol:.(1234567890)www.nature.com/scientificreports/
lifestyle includes, but is not limited to, smoking and BMI, which both have moderate genetic correlations with
heart attacks (rg = 0.33 between heart attacks and smoking; rg = 0.36 between heart attacks and BMI28). Therefore,
we expect non-exogenous environments to vary depending on the values of polygenic scores. Such dependencies,
when accompanied by hidden heterogeneity that links environments with outcomes, will result in endogenous
selection bias, which we describe now.
Whether the aim is to address genetic confounding or to reveal mediation, models of this kind include poly-
genic scores and environments as predictors of an outcome of interest. The simple case is illustrated in Fig. 1A.
The polygenic score, G, has an independent association with the outcome, Y, along with an indirect path through
the environment, E. The exclusion from the model of the environmental covariate, E, results in the estimation
of the total effect of G on Y, while the exclusion of G and the inclusion of E produces the association between E
and Y, confounded by unobserved G.
The challenges for the model in Fig. 1A are to produce reliable estimates of the direct effects from G to Y
and from E to Y in the face of confounding by the unmeasured U. Since the focus of our paper is not related to
the issues of polygenic prediction per se, we do not include a discussion on the sources of bias between G and Y
caused by confounders that are likely to arise due to assortative mating or population stratification, which have
been amply explored e lsewhere29. Here, we focus on the role of confounders of the link between environment
and outcome.
The most important problem arising from the presence of unmeasured factors causing E and Y is that of non-
exogenous environments. Factors such as socio-economic conditions, parental characteristics, health policies,
cultural norms, and neighbourhood characteristics could cause E and Y to be correlated and, unless included in
the model, they will be jointly present in the error structure of both variables. The issue is further problematic
because the confounding can be driven by both observed and unobserved factors. Hence, even an extensive set
of controls would not necessarily yield unbiased estimates if substantial confounding on unobservables remained
unaddressed.
Moreover, unobserved confounder(s), U, linking E and Y biases not only their association but also the estimate
of the direct effect of G on Y. This is driven by the fact that E is now a collider since it is a product of both G and
U, as indicated by the arrows from U to E and G in Fig. 1A. It is known that if we do not control for a collider
variable the path between its sources is blocked; however, once a collider is included in the set of covariates, the
associated path is now o pen30. Accordingly, conditioning on E introduces a new path from G to E to Y through
U: this is the green path denoted in Fig. 1A. This path is the source of the collider bias in these models.
We could simply omit the collider, E, from the model in Fig. 1A and estimate the total effect of G on Y,
including the direct path from G to Y and the indirect path through E. However, while this might be desirable
in some cases, models of this type usually aim to disentangle these paths leading to the necessity of including
such covariates into the models along with polygenic scores. Here, it is important to clarify that the heritable
covariate, E, is not a confounding variable because of the direction of the arrow, and thus we cannot treat it as
an omitted variable that we wish to control for. It is rather a mechanism we condition on that introduces collider
bias and requires other sets of solutions we discuss later in the paper.
To further illustrate this bias, we conducted a series of simulations of the simple linear model from Fig. 1A. We
considered the presence of direct effects from G to Y and E to Y, allowed the G–E correlation to vary from 0 indi-
cating no heritability to 0.5 indicating a highly heritable covariate, E, and included an uncontrolled confounder,
U, which is positively correlated with both E and Y at a fixed value. We considered three scenarios where U is a
modest, moderate, or strong confounder of E–Y association. The top panel of Fig. 1B illustrates the deviations of
coefficients from the true simulated values. Notably, the presence of G–E correlation and an omitted confounder,
U, where both U–E and U–Y associations are positive, results in the deflation of polygenic score estimates and
inflation of environmental coefficients. Deflation of the G–Y association is greater with higher values of the
G–E correlation, while the models without this association produced results free of collider bias. Moreover, the
degree of bias also depends on the strength of the unobserved confounder, U. The path coefficient from E to Y
is biased regardless of the strength of the G-E correlation reflecting the role of the omitted confounder, U, as a
source of confounding of this path.
We also develop a mathematical expression of the bias for linear models, which we provide in the Supple-
mentary Information. However, it is important to note that even though we consider simple linear models in
our simulations and derivations, the bias would also arise in other types of regressions, e.g., logistic regression or
Cox models. Since the graphical approach we follow does not require any parametric assumptions, the functional
form describing the relationship between variables is not relevant.
It is also possible to exemplify the nature of inflation of the G-Y association by considering examples from
the existing literature. Using the example of studies on cardiovascular m ortality17 and incidents of s troke16
mentioned previously, the focus was to model the risk of strokes or cardiovascular mortality (Y) according to
genetic risks (G) and lifestyle profiles (E), employing Cox proportional hazards models. A covariate such as a
lifestyle may not be exogenous—individuals choose to follow healthy or less favourable behaviours based on
various observed and unobserved factors. Hence, we expect not only G-E dependency, at least due to pleiotropy,
but also the presence of unobserved confounders, U. Here, potential factors for U include, but are not limited to,
childhood poverty, social or geographically-related deprivation, and socio-economic p osition31–33. This makes
the estimation of G–Y association subject to collider bias since we introduced the path that goes through this
set of unobserved confounders, U, into the statistical model. While one of the desires of these studies is to show
that a healthy lifestyle potentially attenuates genetic risks, observed attenuations should be treated with caution.
Another instance is the study from Papageorge and Thom19, which we can analyse in a more straightfor-
ward manner because of the properties of linear models. Here the researchers regressed a polygenic score of
educational attainment (G) on earnings (Y) and found that greater values of the genetic score were associated
with greater income. What is relevant to our argument is that after the inclusion of educational controls (E) into
Scientific Reports | (2021) 11:9457 | https://doi.org/10.1038/s41598-021-89020-x 3
Vol.:(0123456789)www.nature.com/scientificreports/
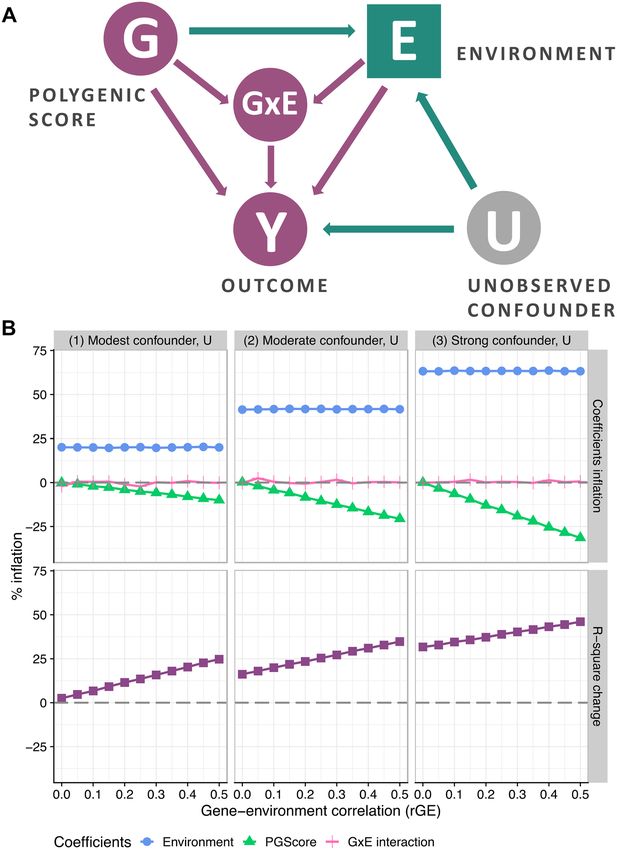
Figure 1. Collider bias in polygenic gene-environment models. Panel A. Schematic diagram of the collider
bias which occurs between polygenic score, environment, and outcome in cases of gene-environment
interdependence. Dark purple circles represent variables, unobserved confounders are shown in grey circles,
collider variables are indicated by squares. By adding E into the model with the polygenic score G, we make E a
collider. A collider that is not conditioned on, blocks the path between its sources (G and U); once a collider is
controlled for, the path is opened as indicated by green nodes. Panel B (top). Spurious regression estimates for
polygenic score and environment from the series of OLS simulations reflecting the range of gene-environment
interdependence and the presence of modest, moderate, or strong confounder, U. Collider bias due to positive
values of gene-environment correlation and the presence of uncontrolled confounder, which is positively
correlated with covariate and outcome, results in deflation of polygenic score estimates. The degree of bias
depends on the strength of unobserved confounder, U, and gene-covariate interdependence. Estimates of the
environmental effect are upwardly biased but are not affected by the gene-environment correlation. Panel B
(bottom). R-squared inflation plot from the series of OLS simulations; collider bias results in inflated values of
explained variance statistics. R-squared statistics for the model with endogenous covariate and polygenic score
includes not only the true share of the variance in Y explained by G and E (baseline estimate indicated by 0), but
also the elements of variance that are due to gene-environment correlation and confounder(s), U.
Scientific Reports | (2021) 11:9457 | https://doi.org/10.1038/s41598-021-89020-x 4
Vol:.(1234567890)www.nature.com/scientificreports/
the model, we observe a 59.5% decrease of the polygenic score coefficient (Table 5 Panel A in Papageorge and
Thom19). In addition, the authors regress the educational attainment polygenic score (G) and years of schooling
(E) on standardised job tasks (Y) to explain the trends they found in the models of earnings. If we take models
on nonroutine analytic and nonroutine interactive tasks (where the association between polygenic score and
outcome is also positive), we also see that the inclusion of educational controls results in about a 70% reduc-
tion in polygenic score coefficients. It is likely that such a change of G-Y association in both analyses is largely
attributed to the extended set of educational controls, which includes both parental and respondent educational
attainment. However, respondent’s own education in these models is an endogenous variable; hence, the decrease
of polygenic score coefficients is likely to be due to collider bias at least to some extent. If we consider a moder-
ate strength of association between the genetic score and respondent’s years of schooling along with additional
assumptions about unobserved confounders linking educational attainment and the type of job tasks, we can
show that around 15–20% of the polygenic score coefficient decrease is plausibly due to collider bias, following
the derivations we include in the Supplementary Information.
In particular, if we consider the model with nonroutine interactive job tasks as the dependent variable (Table 6
in Papageorge and Thom19), we see that the baseline coefficient of the educational attainment polygenic score
is 0.185. This reflects a model without any environmental and phenotypic covariates. In the model with educa-
tional controls, which are respondent’s years of schooling and parental education, the polygenic score coefficient
drops to 0.055. Since the dependent variable is standardised, we can assess the relative importance of collider
bias under additional assumptions. We assume that the coefficient of the correlation between polygenic score
and respondent’s years of schooling is 0.300, and that there is an unobserved confounder U, which is positively
correlated with both years of schooling and job task with coefficients of 0.250 (for example, living in advantaged
higher socio-economic neighbourhood as a child may be an omitted confounder). These are all plausible and
rather modest suggestions if we look at the correlation matrix from Table 6 in Papageorge and Th om19. Follow-
ing the derivations provided in the Supplementary Information, the inflation bias would be 0.021 under these
assumptions, which explains a 16% downward change of the polygenic score coefficient. We provide detailed
calculations for this case in the Supplementary Information.
We also show in Fig. 1B that the described bias results in greater values of explained variance statistics: these
are R-squared values in the case of our simulations. This is because statistical models suffering from this bias
explain both true and artificial (due to collider) variation in a dependent variable as we show in the derivations
in the Supplementary Information. This further complicates the assessment of the relative predictive power of
polygenic scores and environments. As demonstrated in the bottom panel of Fig. 1B, R-squared statistics for the
model with an endogenous covariate and a polygenic score would include not only the true share of the variance
in Y explained by G and E, but also the elements of variance that are due to rGE and confounder(s), U.
To conclude, the inclusion of associated polygenic scores and covariates in regression models may result in
spurious estimates and greater explained variance statistics. The direction and strength of coefficient bias depend
on the strength of the gene-covariate correlation and on the underlying structure of any endogeneity which links
the covariate to the outcome variable.
Gene × environment interaction models. A growing literature estimates the moderating patterns of
environmental risks in the associations between polygenic scores and phenotypes. Here, in the same fashion as
in additive models, environmental exposures of interest are not usually exogenous. For example, recent stud-
ies on gene-environment interaction analysis consider such environments as physical activity34, relationship
status35, educational attainment36, lifestyle37, occupational exposure38, neighbourhood characteristics39 and oth-
ers. There is an ongoing discussion on the implications of non-exogeneity of e nvironments7,40,41. Also, the issue
of collider bias has been demonstrated in the context of case-only gene-environment interaction s tudies42. We
expand on these concerns by showing that moderation models also suffer from collider bias.
Firstly, the problem outlined until this point is also relevant for gene-environment interaction studies. One
difference, however, between additive and moderation models is the presence of the G × E interaction in the set
of covariates. As indicated in Fig. 2A by green nodes, the bias path from G to Y through E and U would still lead
to spurious results. Considering the examples of G × E studies mentioned earlier, the environments may, to some
degree, be products of self-selection, which leads to a greater likelihood of G and E interdependence along with
the presence of unobserved confounder(s), U. Secondly, since the overall G × E interaction pattern depends on the
direct estimates of G on Y and E on Y, results for moderation analyses are biased when direct effects are spurious.
However, the G × E coefficient per se is not inflated due to collider bias. This can be seen in Fig. 2B, along with
the inflation of R-square statistics which were obtained from similar simulations as earlier but with the inclusion
of interaction terms. Our insights are in line with Bun and H arrison43 who provide mathematical annotations
and show that OLS estimation of endogenous interaction terms is consistent. The authors also highlight that this
consistency applies only to interaction coefficients and not to the overall marginal effect.
The inflation of the GxE interaction term is not observed under the scenario where confounder, U, does not
interact with a covariate, E, and polygenic score, G. This setting is considered in Bun and H arrison43 and in our
simulation analyses presented in Fig. 2. However, because of the non-experimental nature of GxE analyses, we
might suspect moderation between an omitted confounder, U, and various covariates in the model. Under this
scenario, the estimation of interaction terms would be spurious and the range of concerns raised by Keller27
would directly apply here. In line with our argument, it is important to highlight that if there is E×U interaction
on the path between E and Y (and thus on the indirect path linking G and Y), our estimate of the GxE term would
be spurious due to collider bias. We provide an illustration of such a case in Figure S1 where the simulations
show that G×E coefficients are biased in proportion to the strength of rGE and the unobserved confounder, U.
Consequently, endogeneity of environmental covariates biases both additive and moderation models.
Scientific Reports | (2021) 11:9457 | https://doi.org/10.1038/s41598-021-89020-x 5
Vol.:(0123456789)www.nature.com/scientificreports/
Figure 2. Collider bias in polygenic gene-environment interaction models. Panel A. Schematic diagram of the
collider bias which occurs between polygenic score, environment, and outcome in cases of gene-environment
interdependence. Dark purple circles represent variables, unobserved confounders are shown in grey circles,
collider variables are indicated in squares. By adding E into the model with the polygenic score G, we make E
a collider. A collider that is not conditioned on, blocks the path between its sources (G and U); once a collider
is controlled for, the path is opened as indicated by green nodes. Panel B (top). Spurious regression estimates
for the polygenic score and environment along with non-inflated interaction terms from the series of OLS
simulations reflecting a range of gene-environment interdependence and the presence of modest, moderate, or
strong confounder, U. Collider bias due to positive values of gene-environment correlation and the presence of
an uncontrolled confounder, which is positively correlated with covariate and outcome, results in deflation of
polygenic score estimates. Deflation is greater the higher the gene-environment correlation; greater confounding
also results in greater bias. The interaction term is not affected but results for moderation analysis are biased as
long as direct effects are spurious. Panel B (bottom). R-squared inflation plot from the series of OLS simulations;
collider bias results in inflated values of explained variance statistics. R-squared statistics for the model with
endogenous covariate and polygenic score includes not only the true share of the variance in Y explained by
G and E (baseline estimate indicated by 0), but also the elements of variance that are due to gene-environment
correlation and confounder(s), U.
Scientific Reports | (2021) 11:9457 | https://doi.org/10.1038/s41598-021-89020-x 6
Vol:.(1234567890)www.nature.com/scientificreports/
Solutions
To address this issue, it is important to understand the nature of the correlation between polygenic scores and
environment (or phenotype if it is used as a covariate)—whether a correlation is conditional and observed
because of omitted confounders between G and E and/or a correlation reflects causal dependency. The former
would necessitate controlling for the confounding factor: this could be parental characteristics (passive rGE)23,44,
ancestry2, and so forth. If a correlation arises as a result of pleiotropy, active or evocative selection, the assump-
tion of non-causal association would be violated and require another set of solutions to avoid collider bias. The
latter is relevant when a phenotypic variable is used as a covariate along with its polygenic prediction since the
association would be at least partially causal.
To obtain unbiased estimates, we need to apply causal inference methods that seek to exploit the exogenous
variation in an environmental covariate. A comprehensive discussion of methods available for researchers and
applicable to the context of this paper is provided by Fletcher and Conley6. Briefly, techniques such as regression
discontinuity and difference-in-difference designs, instrumental variables and quasi-natural experiments will
produce unbiased results for both additive and gene-environment interaction models, conditional on certain
assumptions being met. As an illustrative case, we considered the instrumental variable solution and include it
in our code, which is available online. However, any technique that would disentangle the exogenous variation in
an environmental covariate would produce estimates which are not distorted by collider bias; hence, a choice of a
particular model would depend on the case in question and a set of assumptions that are unique for each method.
There are also existing ways to assess the magnitude of the bias for the general collider cases45,46. Since the
type of collider we described here is the product of both observed and unobserved factors, calculation of bias
magnitude would rely on additional assumptions about the structure of the error correlation between the envi-
ronmental covariate and the outcome. It is possible to assess the strength of gene-covariate association by either
directly measuring their correlation in the data or by taking into account genetic correlations for the trait in
question. The influence of unobserved variables on the bias, however, makes it impossible to provide a definitive
estimate of the issue. In the Supplementary Information, we show the sources of bias in coefficient estimates and
error in R-squared. In line with the results of our simulation analyses, mathematical expressions also demonstrate
that the strength of collider bias is positively associated with the strength of rGE and unobserved confounders.
The use of sensitivity analyses is a valuable tool in showing how robust conclusions are to different degrees of
unobserved confounding and, thus, of collider b ias47.
Conclusion
We have discussed methodological considerations arising due to heritable environments (or phenotypes that
are included into models as covariates) that have not yet been previously recognised. We demonstrated that
the inclusion of environments that are products of polygenic scores may introduce endogenous selection bias
through conditioning on a collider, leading to spurious associations. Particularly, we showed that the degree of
bias depends on the strength of the gene-covariate correlation and of the omitted variable(s) linking the covari-
ate and outcome. We also showed that the portion of explained variance is overestimated proportionally. We
proposed some solutions that exploit the strength of causal inference methods: these are likely to be important
not only for obtaining reliable results but also in the interpretation of existing studies.
Methods
Graphical models. We use a graphical approach to demonstrate the methodological problems. For the
theory behind graphical models, see Pearl et al.48 The graphical approach is a transparent method to demonstrate
the biases and it does not require any parametric assumptions which is an advantage. We also provide equations
and detailed derivations for the bias under the assumptions of linear regression in Supplementary Information
to compliment graphical models. In the schematic diagrams (or directed acyclic graphs) presented in the paper,
arrows indicate associated paths, dark purple circles represent observed variables, grey circles represent unob-
served variables (which are confounders in our case), and collider variables are indicated by squares.
Simulations. To further illustrate this bias, we conducted a series of simulations of the simple linear models.
All simulations are detailed in Supplementary Information. All analyses code is publicly available at: https://
github.com/eva-akimova/collider-simulations.git (https://doi.org/10.5281/zenodo.4184672), to reproduce the
figures presented in the paper. Simulations were conducted in R49 using dplyr50, broom51, purrr52, mvtnorm53,
ggplot254, cowplot55, tidyr56, AER57, forcats58 packages. First, we simulated scenarios of OLS regression for addi-
tive models. We allowed the G-E correlation to vary from 0 indicating no heritability to 0.5 indicating a highly
heritable covariate. We considered three scenarios where U is a modest, moderate, or strong confounder of the
E-Y association (r = 0.12, r = 0.25, and r = 0.38 respectively). We also considered the presence of direct effects
from G to Y and E to Y which coefficients are both positive and 0.6. Second, for the gene-environment interac-
tion models, we simulated the same settings and added the GxE coefficient at a fixed value of 0.1 for all scenarios.
Supplementary information
Supplementary Information includes the detailed derivations for the bias under the assumption of linear relation-
ships that are modelled using regression analysis and detailed information on simulations.
Data availability
The code for the simulations and figures is available on Zenodo (https://doi.org/10.5281/zenodo.4184672) and
GitHub (https://github.com/eva-akimova/collider-simulations.git).
Scientific Reports | (2021) 11:9457 | https://doi.org/10.1038/s41598-021-89020-x 7
Vol.:(0123456789)www.nature.com/scientificreports/
Received: 7 December 2020; Accepted: 20 April 2021
References
1. Barbaro, N., Boutwell, B. B., Barnes, J. C. & Shackelford, T. K. Genetic confounding of the relationship between father absence and
age at menarche. Evol. Hum. Behav. 38, 357–365 (2017).
2. Mostafavi, H. et al. Variable prediction accuracy of polygenic scores within an ancestry group. Elife 9, e48376 (2020).
3. Ware, E. B. et al. Heterogeneity in polygenic scores for common human traits. BioRxiv 6, 106062 (2017).
4. Morris, T. T., Davies, N. M., Hemani, G. & Smith, G. D. Population phenomena inflate genetic associations of complex social traits.
Sci. Adv. 6, eaay0328 (2020).
5. Conley, D. The promise and challenges of incorporating genetic data into longitudinal social science surveys and research. Biode-
mography Soc. Biol. 55, 238–251 (2009).
6. Fletcher, J. M. & Conley, D. The challenge of causal inference in gene-environment interaction research: leveraging research designs
from the social sciences. Am. J. Public Health 103(Suppl 1), S42–S45 (2013).
7. Dudbridge, F. & Fletcher, O. Gene-environment dependence creates spurious gene-environment interaction. Am. J. Human Genet.
95, 301–307 (2014).
8. Avinun, R. The E is in the G: gene–environment–trait correlations and findings from Genome-Wide Association Studies. Perspect.
Psychol. Sci. 15, 81–89 (2019).
9. Ni, G. et al. Genotype–covariate correlation and interaction disentangled by a whole-genome multivariate reaction norm model.
Nat. Commun. 10, 2239 (2019).
10. Munafò, M. R., Tilling, K., Taylor, A. E., Evans, D. M. & Davey Smith, G. Collider scope: when selection bias can substantially
influence observed associations. Int. J. Epidemiol. 47, 226–235 (2017).
11. Conley, D. & Zhang, S. The promise of genes for understanding cause and effect. Proc. Natl. Acad. Sci. 115, 5626 (2018).
12. Plomin, R., DeFries, J. C. & Loehlin, J. C. Genotype-environment interaction and correlation in the analysis of human behavior.
Psychol. Bull. 84, 309–322 (1977).
13. Infante-Rivard, C. & Cusson, A. Reflection on modern methods: selection bias—a review of recent developments. Int. J. Epidemiol.
47, 1714–1722 (2018).
14. Day, F. R., Loh, P.-R., Scott, R. A., Ong, K. K. & Perry, J. R. B. A robust example of collider bias in a genetic association study. Am.
J. Human Genet. 98, 392–393 (2016).
15. Stergiakouli, E. et al. Association between polygenic risk scores for attention-deficit hyperactivity disorder and educational and
cognitive outcomes in the general population. Int. J. Epidemiol. 46, 421–428 (2016).
16. Rutten-Jacobs, L. C. et al. Genetic risk, incident stroke, and the benefits of adhering to a healthy lifestyle: cohort study of 306 473
UK Biobank participants. BMJ 363, k4168 (2018).
17. Yun, J.-S., Jung, S.-H., Shivakumar, M., Xiao, B., Khera, A. V., Park, W.-Y., Won, H.-H. & Kim, D. Polygenic risk, lifestyle, and
cardiovascular mortality: a prospective population-based UK Biobank study. medRxiv, (2021).
18. Ayorech, Z., Plomin, R. & von Stumm, S. Using DNA to predict educational trajectories in early adulthood. Dev. Psychol. 55,
1088–1095 (2019).
19. Papageorge, N. W. & Thom, K. Genes, education, and labor market outcomes: evidence from the health and retirement study. J.
Eur. Econ. Assoc. 18, 1351–1399 (2019).
20. Smith-Woolley, E. et al. Differences in exam performance between pupils attending selective and non-selective schools mirror the
genetic differences between them. npj Sci. Learn. 3, 3 (2018).
21. Jaffee, S. R. & Price, T. S. Gene–environment correlations: a review of the evidence and implications for prevention of mental
illness. Mol. Psychiatry 12, 432–442 (2007).
22. Mills, M. C., Barban, N. & Tropf, F. C. An Introduction to Statistical Genetic Data Analysis (MIT Press, 2020).
23. Kong, A. et al. The nature of nurture: effects of parental genotypes. Science 359, 424–428 (2018).
24. Avinun, R. & Knafo, A. Parenting as a reaction evoked by children’s genotype: a meta-analysis of children-as-twins studies. Pers.
Soc. Psychol. Rev. 18, 87–102 (2014).
25. Klahr, A. M. & Burt, S. A. Elucidating the etiology of individual differences in parenting: a meta-analysis of behavioral genetic
research. Psychol. Bull. 140, 544–586 (2014).
26. van Rheenen, W., Peyrot, W. J., Schork, A. J., Lee, S. H. & Wray, N. R. Genetic correlations of polygenic disease traits: from theory
to practice. Nat. Rev. Genet. 20, 567–581 (2019).
27. Bulik-Sullivan, B. et al. An atlas of genetic correlations across human diseases and traits. Nat. Genet. 47, 1236–1241 (2015).
28. Abbott, L., Bloom, J., Bryant, S., Carey, C., Churchhouse, C., Ganna, A., Goldstein, J., Howrigan, D., King, D., Neale, B. et al. Genetic
correlation between traits and disorders in the UK Biobank, (2020). https://ukbb-rg.hail.is
29. Kerminen, S. et al. Geographic variation and bias in the polygenic scores of complex diseases and traits in Finland. Am. J. Human
Genet. 104, 1169–1181 (2019).
30. Elwert, F. & Winship, C. Endogenous selection bias: the problem of conditioning on a collider variable. Annu. Rev. Sociol. 40, 31–53
(2014).
31. Lindsay, S. The influence of childhood poverty on the self-management of heart disease in later life. In Social Sources of Dispari-
ties in Health and Health Care and Linkages to Policy, Population Concerns and Providers of Care (ed. Jennie Jacobsk, R.) 161–183
(Emerald Group Publishing Limited, 2009).
32. Lawlor, D. A., Davey Smith, G., Patel, R. & Ebrahim, S. Life-Course Socioeconomic position, area deprivation, and coronary heart
disease: findings from the british women’s heart and health study. Am. J. Public Health 95, 91–97 (2005).
33. Kromhout, D., Menotti, A., Kesteloot, H. & Sans, S. Prevention of coronary heart disease by diet and lifestyle. Circulation 105,
893–898 (2002).
34. Wu, Y. Y., Thompson, M. D., Youkhana, F. & Pirkle, C. M. Interaction between physical activity and polygenic score on type 2
diabetes mellitus in older black and white participants from the health and retirement study. J. Gerontol. Ser. A, (2021).
35. Barr, P. B. et al. Polygenic risk for alcohol misuse is moderated by romantic partnerships. Addiction 114, 1753–1762 (2019).
36. Amin, V. et al. Gene-environment interactions between education and body mass: evidence from the UK and Finland. Soc. Sci.
Med. 195, 12–16 (2017).
37. Ye, Y. et al. Interactions between enhanced polygenic risk scores and lifestyle for cardiovascular disease, diabetes, and lipid levels.
Circ. Genomic Precis. Med. 14, e003128 (2021).
38. Zeng, X. et al. Genome-wide interaction study of gene-by-occupational exposures on respiratory symptoms. Environ. Int. 122,
263–269 (2019).
39. Robinette, J. W., Boardman, J. D. & Crimmins, E. M. Differential vulnerability to neighbourhood disorder: a gene×environment
interaction study. J. Epidemiol. Commun. Health 73, 388–392 (2019).
40. Schmitz, L. & Conley, D. Modeling gene-environment interactions with quasi-natural experiments. J. Pers. 85, 10–21 (2017).
41. Keller, M. C. Gene × environment interaction studies have not properly controlled for potential confounders: the problem and
the (simple) solution. Biol. Psychiatry 75, 18–24 (2014).
Scientific Reports | (2021) 11:9457 | https://doi.org/10.1038/s41598-021-89020-x 8
Vol:.(1234567890)www.nature.com/scientificreports/
42. Balazard, F., Le Fur, S., Bougnères, P. & Valleron, A.-J. Interactions and collider bias in case-only gene-environment data. BioRxiv
2017, 124560 (2017).
43. Bun, M. J. G. & Harrison, T. D. OLS and IV estimation of regression models including endogenous interaction terms. Economet.
Rev. 38, 814–827 (2019).
44. Trejo, S. & Domingue, B. W. Genetic nature or genetic nurture? Introducing social genetic parameters to quantify bias in polygenic
score analyses. Biodemography Soc. Biol. 64, 187–215 (2018).
45. VanderWeele, T. J. Bias formulas for sensitivity analysis for direct and indirect effects. Epidemiology 21, 540–551 (2010).
46. Greenland, S. Quantifying biases in causal models: classical confounding vs collider-stratification bias. Epidemiology 14, 300–306
(2003).
47. Ding, P. & VanderWeele, T. J. Sensitivity analysis without assumptions. Epidemiology 27, 368–377 (2016).
48. Pearl, J., Glymour, M. & Jewell, N. P. Causal Inference in Statistics: A Primer (John Wiley and Sons, 2016).
49. Team, R. C. R: A language and environment for statistical computing, (2013).
50. Wickham, H., François, R., Henry, L. & Müller, K. dplyr: A Grammar of Data Manipulation. R package version 1.0.5, (2021).
51. Robinson, D., Hayes, A., & Couch, S. broom: Convert Statistical Objects into Tidy Tibbles. R package version 0.7.2, (2020).
52. Henry, L. & Wickham, H. purrr: Functional Programming Tools. R package version 0.3.4, (2020).
53. Genz, A., Bretz, F., Miwa, T., Mi, X., Leisch, F., Scheipl, F. & Hothorn, T. mvtnorm: Multivariate Normal and t Distributions. R
package version 1.1-1, (2020).
54. Wickham, H. ggplot2: Elegant Graphics for Data Analysis (Springer, 2016).
55. Wilke, C. O. cowplot: Streamlined Plot Theme and Plot Annotations for ’ggplot2’. R package version 1.1.0, (2020).
56. Wickham, H. tidyr: Tidy Messy Data. R package version 1.1.2, (2020).
57. Kleiber, C. & Zeileis, A. Applied Econometrics with R (Springer, 2008).
58. Wickham, H. forcats: Tools for Working with Categorical Variables (Factors). R package version 0.5.0, (2020).
Acknowledgements
Research has been supported by the UKRI/ESRC NCRM SOCGEN grant, ERC Advanced Grant (CHRONO,
835079) and The Leverhulme Trust Large Centre Grant, Leverhulme Centre for Demographic Research (PI, M.C.
Mills). Results from this research were presented earlier at the National Institute on Aging supported 2019 Inte-
grating Genetics and Social Science Conference (R13-AG062366) at the University of Colorado, Boulder.
Author contributions
E.T.A. conceived of the idea and wrote the first version of the manuscript. E.T.A. and D.M.B. wrote the simula-
tion code. R.B. derived the equations in the annex and M.C.M. revised the manuscript. All authors discussed
the design, results and contributed to the final manuscript.
Competing interests
The authors declare no competing interests.
Additional information
Supplementary Information The online version contains supplementary material available at https://doi.org/
10.1038/s41598-021-89020-x.
Correspondence and requests for materials should be addressed to E.T.A.
Reprints and permissions information is available at www.nature.com/reprints.
Publisher’s note Springer Nature remains neutral with regard to jurisdictional claims in published maps and
institutional affiliations.
Open Access This article is licensed under a Creative Commons Attribution 4.0 International
License, which permits use, sharing, adaptation, distribution and reproduction in any medium or
format, as long as you give appropriate credit to the original author(s) and the source, provide a link to the
Creative Commons licence, and indicate if changes were made. The images or other third party material in this
article are included in the article’s Creative Commons licence, unless indicated otherwise in a credit line to the
material. If material is not included in the article’s Creative Commons licence and your intended use is not
permitted by statutory regulation or exceeds the permitted use, you will need to obtain permission directly from
the copyright holder. To view a copy of this licence, visit http://creativecommons.org/licenses/by/4.0/.
© The Author(s) 2021
Scientific Reports | (2021) 11:9457 | https://doi.org/10.1038/s41598-021-89020-x 9
Vol.:(0123456789)You can also read