Genetic associations of protein-coding variants in human disease
←
→
Page content transcription
If your browser does not render page correctly, please read the page content below
Article

Genetic associations of protein-coding
variants in human disease

https://doi.org/10.1038/s41586-022-04394-w                      Benjamin B. Sun1,2 ✉, Mitja I. Kurki3,4,5,6, Christopher N. Foley7,8, Asma Mechakra9,
                                                                Chia-Yen Chen1, Eric Marshall1, Jemma B. Wilk1, Biogen Biobank Team*, Mohamed Chahine10,
Received: 25 May 2021
                                                                Philippe Chevalier9, Georges Christé9, FinnGen*, Aarno Palotie3,4,5,6, Mark J. Daly3,4,5,6 &
Accepted: 20 December 2021                                      Heiko Runz1 ✉

Published online: 23 February 2022

Open access                                                     Genome-wide association studies (GWAS) have identified thousands of genetic
    Check for updates                                           variants linked to the risk of human disease. However, GWAS have so far remained
                                                                largely underpowered in relation to identifying associations in the rare and
                                                                low-frequency allelic spectrum and have lacked the resolution to trace causal
                                                                mechanisms to underlying genes1. Here we combined whole-exome sequencing in
                                                                392,814 UK Biobank participants with imputed genotypes from 260,405 FinnGen
                                                                participants (653,219 total individuals) to conduct association meta-analyses for 744
                                                                disease endpoints across the protein-coding allelic frequency spectrum, bridging the
                                                                gap between common and rare variant studies. We identified 975 associations, with
                                                                more than one-third being previously unreported. We demonstrate population-level
                                                                relevance for mutations previously ascribed to causing single-gene disorders, map
                                                                GWAS associations to likely causal genes, explain disease mechanisms, and
                                                                systematically relate disease associations to levels of 117 biomarkers and clinical-stage
                                                                drug targets. Combining sequencing and genotyping in two population biobanks
                                                                enabled us to benefit from increased power to detect and explain disease associations,
                                                                validate findings through replication and propose medical actionability for rare
                                                                genetic variants. Our study provides a compendium of protein-coding variant
                                                                associations for future insights into disease biology and drug discovery.

Inherited variations in protein-coding and non-coding DNA have a                                individuals and, since its inception, has facilitated biomedical discover-
role in the risk, onset and progression of human disease. Tradition-                            ies at an unprecedented scale2. We and others have recently reported
ally, geneticists have dichotomized diseases as either caused by cod-                           on the ongoing efforts to sequence the exomes of all UKB participants
ing mutations in single genes that tend to be rare, highly penetrant                            and link genetic findings to a broad range of phenotypes3–6. We also
and frequently compromise survival and reproduction (often termed                               established FinnGen (FG) (https://www.finngen.fi), an academic–indus-
‘Mendelian’ diseases), or as common diseases that show a complex pat-                           try collaboration to identify genotype–phenotype correlations in the
tern of inheritance influenced by the joint contributions of hundreds                           Finnish founder population with the aim of better understanding how
of low-impact, typically non-coding genetic variants (often termed                              the genome affects health. Finland is a well-established genetic isolate
‘complex’ diseases). For both rare and common conditions, large human                           and a unique gene pool distinguishes Finns from other Europeans7. The
cohorts systematically characterized for a respective trait of interest                         distinct Finnish haplotype structure is characterized by large blocks
have enabled the identification of thousands of disease-relevant vari-                          of co-inherited DNA in linkage disequilibrium and an enrichment for
ants through either sequencing-based approaches or GWAS. Neverthe-                              alleles that are rare in other populations, but can still be confidently
less, the exact causal alleles and mechanisms that underlie associations                        imputed from genotyping data even in the rare and ultra-rare allele
of genetic variants to disease have so far remained largely elusive1.                           frequency spectrum8–10. Through combining imputed genotypes with
   In recent years, population biobanks have been added to the toolkit                          detailed phenotypes ascertained through national registries, FG holds
for disease gene discovery. Biobanks provide the opportunity to                                 the promise to provide particular insights into the so far little examined
simultaneously investigate multiple traits and diseases at once and                             allele frequency spectrum between 0.1 and 2%, where both sequencing
uncover relationships between previously unconnected phenotypes.                                studies and GWAS have so far remained largely underpowered in rela-
For instance, the UK Biobank (UKB) is a resource that captures detailed                         tion to identifying associations with disease. This spectrum includes
phenotype information matched to genetic data for more than 500,000                             many coding variants with moderate to large effect sizes that can help

1
 Translational Biology, Research and Development, Biogen Inc., Cambridge, MA, USA. 2BHF Cardiovascular Epidemiology Unit, Department of Public Health and Primary Care, University of
Cambridge, Cambridge, UK. 3Psychiatric and Neurodevelopmental Genetics Unit, Massachusetts General Hospital, Boston, MA, USA. 4The Stanley Center for Psychiatric Research, The Broad
Institute of MIT and Harvard, Cambridge, MA, USA. 5Institute for Molecular Medicine Finland (FIMM), University of Helsinki, Helsinki, Finland. 6Analytic and Translational Genetics Unit,
Department of Medicine, Massachusetts General Hospital, Boston, MA, USA. 7MRC Biostatistics Unit, School of Clinical Medicine, University of Cambridge, Cambridge, UK. 8Optima Partners,
Edinburgh, UK. 9Université de Lyon 1, Université Lyon 1, INSERM, CNRS, INMG, Lyon, France. 10CERVO Brain Research Center and Department of Medicine, Faculty of Medicine, Université Laval,
Quebec City, Quebec, Canada. *Lists of authors and their affiliations appear at the end of the paper. ✉e-mail: bbsun92@outlook.com; heiko.runz@gmail.com

                                                                                                                                         Nature | Vol 603 | 3 March 2022 | 95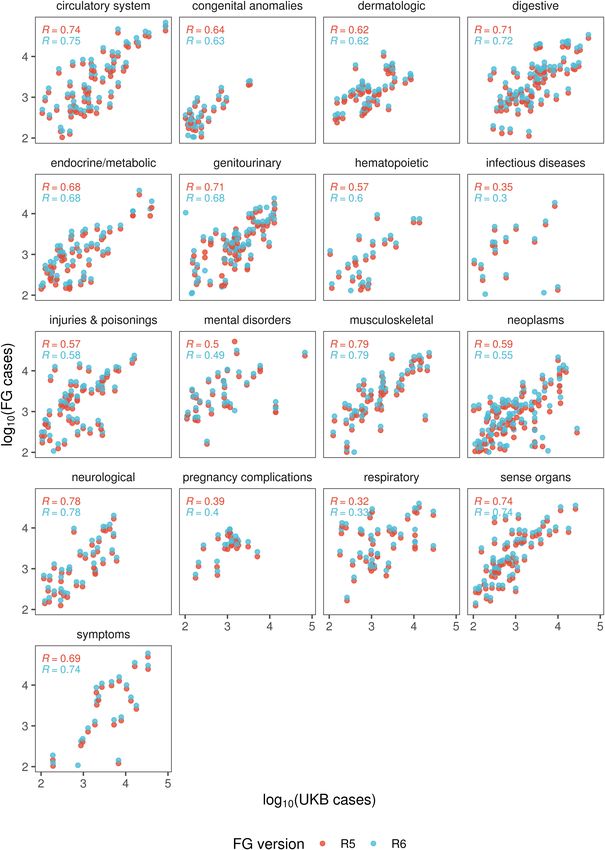
Article
identify causal genes in GWAS loci, provide mechanistic insights into             ranges traditionally interrogated in GWAS (MAF of 7.9% (UKB) and
disease pathologies, and potentially bridge rare and common diseases.             3.7% (FG)). Several variants with large effect sizes reside in well studied
   Here, we have leveraged the combined power of UKB and FG to inves-             disease genes such as BRCA1 (breast cancer), IDH2 (myeloid leukaemia),
tigate how rare and low-frequency variants in protein-coding regions of           VWF (von Willebrand disease) or HFE (disorders or iron metabolism),
the genome contribute to the risk for human traits and diseases. Using            proposing that carriers could benefit from clinical monitoring for
data from a total of 653,219 individuals, we tested how approximately             associated conditions. Association testing within UKB and FG indi-
48,000 coding variants identified in both biobanks through either                 vidually would have yielded 318 and 479 associations, respectively, at
whole-exome sequencing or genotype imputation associate with 744                  P < 5 × 10⁻⁸ (Supplementary Tables 4, 5). Thus, our combined approach
distinct disease endpoints. Disease associations were compared against            using both biobanks increased the number of significant findings by
information from rare disease, biomarker and drug target resources                approximately threefold for UKB and twofold for FG. Of the 318 and 479
and complemented by deep dives into distinct disease mechanisms of                significant sentinel variants in UKB and FG, 252 (72.6%) and 258 (53.9%)
individual genes and coding variants. Our results showcase the benefits           replicated at P < 0.05 in FG and UKB, respectively (Supplementary
of combining large population cohorts to discover and replicate novel             Tables 4, 5), further highlighting the strength of our approach to yield
associations, explain disease mechanisms across a range of common                 results that are more robust through replication than findings derived
and rare diseases, and shed light on a substantial gap in the allelic spec-       from a single biobank.
trum that neither genotyping nor sequencing studies have previously                  Our study benefits from population enrichment of rare alleles in
been able to address.                                                             Finns versus NFEs (and vice versa) that increases the power for asso-
                                                                                  ciation discovery. Using a combination of theoretical analyses and
                                                                                  empirical simulations, we show that by leveraging population-enriched
Coding associations with human disease                                            variants we could increase inverse-variance weighted meta-analysis
An overview of the study design and basic demographics are provided in            Z-scores and hence our ability to detect underlying associations (Sup-
Extended Data Fig. 1, Supplementary Table 1. In brief, we systematically          plementary Information). The gain in power from enriched alleles was
harmonised disease phenotypes across UKB and FG using Phecode and                 present across a range of rare MAFs (0.01–1%), with the strongest power
ICD10 mappings and retained 744 specific disease endpoints grouped                gain in the rare and ultra-rare MAF range of 0.01% to 0.25% (Fig. 1d,
into 580 disease clusters (Methods, Supplementary Table 2). Disease               Extended Data Fig. 5, Supplementary Information, Supplementary
case counts relative to cohort size showed good correlations both                 Files 2a–c (interactive)). Notably, we demonstrate both theoretically
overall between UKB and FG (Spearman’s ρ = 0.65, P < 5.3 × 10−90) and             and in practice that gains in power due to allele enrichment remain even
across distinct disease groups (Extended Data Fig. 2).                            after adjusting for power gains due to increased sample size (Supple-
   We performed coding-wide association studies (CWAS) across 744                 mentary Fig. 2 (MAF enrichment on Z-scores), Extended Data Fig. 5d).
disease endpoints over a mean of 48,189 (range: 25,309–89,993) (Meth-             Of the sentinel variants, we found 73 (33 in UKB and 40 in FG) to be
ods, Supplementary Table 2) post-quality control coding variants across           enriched by more than twofold and 23 (8 in UKB and 15 in FG) by more
the allele frequency spectrum derived from whole-exome sequencing                 than fourfold relative to the other biobank (Fig. 1b, Supplementary
of 392,814 European ancestry individuals in UKB and meta-analysed                 Table 6). Most highly population-enriched variants are rare (MAF 2 × 10⁻⁹) or FG (59.6% at P > 5 × 10⁻⁸; 58.6% at P > 2 × 10⁻⁹) alone. We   with a single disease cluster (Extended Data Fig. 6b). Thirteen loci were
found 13 associations (across 11 genes) with log odds ratios greater              associated with at least five trait clusters (at P < 5 × 10⁻⁸), including
than 2 (Fig. 1c). Of these, 12 associated variants had MAF < 1%, and              well established pleiotropic regions such as the MHC, APOE, PTPN22,
only the haemochromatosis variant rs1800562 showed frequency                      GCKR, SH2B3 and FUT2 (Fig. 1a). For instance, in addition to a known

96 | Nature | Vol 603 | 3 March 2022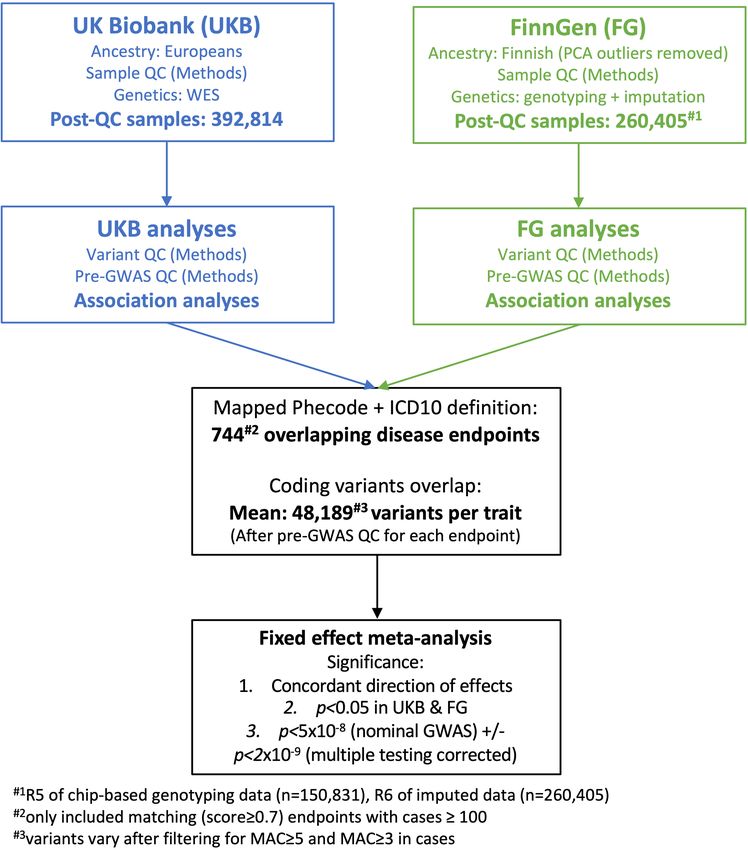
a
ABCG5
PNPLA3
TM6SF2
SH2B3
CHEK2
MC1R
APOE
PTPN22
ODF3
GCKR
FUT2
LRRC34
MHC
60
40
–log10(P)
20
0
1 2 3 4 5 6 7 8 9 10 11 12 13 14 15 16 17 18 19 20 2122
Chromosome position
Circulatory Digestive Genitourinary Neoplasms Sense organs
Disease group
Dermatologic Endocrine or metabolic Musculoskeletal Respiratory Other
Novel variant and gene Novel variant, previously reported gene Previously reported variant
b c d e
Known Novel
IDH2
BRCA1
7
–1 3
PDE9A 6
log10MAF (FG)
4
IVW uplift
5
abs[log(OR)]
–2 4
Density
IDH2 MYBPC3 2
DNAAF5 ABCC6 CHEK2 3
ALDH16A1
ELL2 2
2 VWF HFE
–3 XPA 1
50
CFI
30
Fo
HCN4
0.
ld
20
01
–4
en
0
00
0 10
0.
ric
5
00
hm
0. 10
1
50
0 0.1 0.2 0.3 0.4 0.5 0 0.1 0.2 0.3 0.4 0.5
0. .00 01
00
0 .00
–5 –4 –3 –2 –1 –4 –3 –2 –1
en
0
0
00 05
MAF
25
t
log10MAF (UKB) log10(mean MAF) MAF MAF
> 8 in FG 2–4 Meta–analysis only
Cohort FG UKB
4–8 4–8 FG only
AF fold enrichment Significant (P < 5 × 10⁻⁸) in
2–4 > 8 in UKB UKB only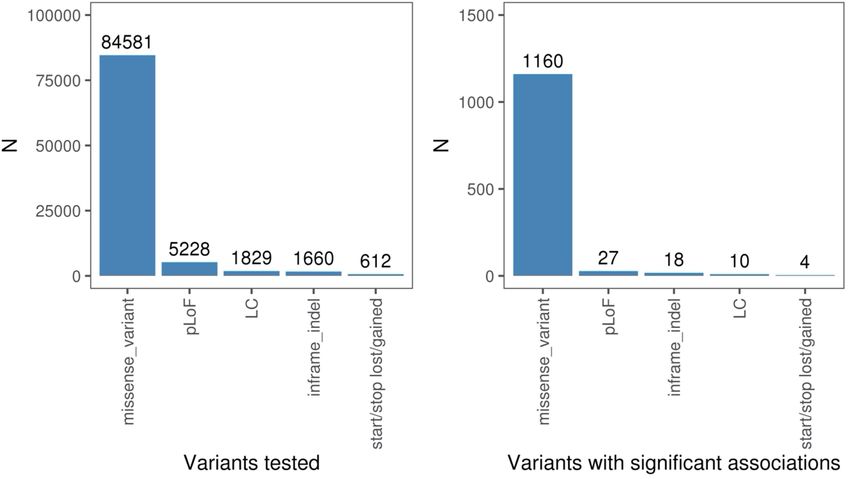
Article
Table 1 | Genes with sentinel variants enriched more than fourfold in either UKB or FG datasets
Gene rs ID (amino acid change) Chr A0/A1 A1 frequency log2 FE OMIM gene–phenotype CWAS gene–phenotype relationships
(UKB; FG (%)) (FG/UKB) relationships
CHEK2 rs17879961 (I200T) 22 A/G 0.04%; 2.99% 6.25 Cancer (breast, prostate, rs17879961:G, benign meningeal
rs555607708a (T410fs) AG/– 0.24%; 0.64% 1.42 colorectal, osteosarcoma); neoplasm
Li–Fraumeni syndrome rs555607708:del (2.8× FG enriched),
cancer (breast, thyroid, colorectal
(benign)); uterine leiomyoma; ovarian
cysts; PCOS
DBH rs77273740 (R79W) 9 C/T 0.10%; 4.95% 5.69 Orthostatic hypotension Hypertension (IA)
PITX2 rs143452464 (P41S) 4 G/A 0.02%; 1.01% 5.42 Anterior segment dysgenesis; Arrythmia and AF
Axenfeld–Rieger syndrome;
ring dermoid of cornea
SLC24A5 rs1426654 (T111A) 15 A/G 0.09%; 1.13% 3.67 Skin, hair, eye pigmentation Non-epithelial cancer of skin (other)
(dark); oculocutaneous (IA)
albinism
CFHR5 rs565457964 (E163fs) 1 C/CAA 0.32%; 3.96% 3.66 Nephropathy due to CFHR5 Degeneration of macula and posterior
deficiency pole of retina (IA)
ANKH rs146886108 (R187Q) 5 C/T 0.72%; 0.07% -3.28 Chondrocalcinosis; Type 2 diabetes mellitus (IA)
craniometaphyseal dysplasia
ALDH16A1 rs150414818 (P527R) 19 C/G 0.10%; 0.95% 3.23 – Gout
LRRK1 rs41531245 (T967M) 15 C/T 0.09%; 0.76% 3.15 – Contracture of palmar fascia; fasciitis;
umbilical hernia
CFI rs141853578 (G119R) 4 C/T 0.11%; 0.01% −3.10 Atypical haemolytic uremic Retinal disorders (other)
syndrome; age-related macular
degeneration; CFI deficiency
FLG rs61816761 (R501*) 1 G/A 2.45%; 0.29% −3.10 Atopic dermatitis; ichthyosis rs61816761:A, dermatitis (other)
rs138381300a (S761fs) CACTG/− 2.45%; 1.35% −0.85 vulgaris rs138381300:del (1.8× UKB enriched),
asthma; non-epithelial cancer of skin
(other)
SOS2 rs72681869 (P191R) 14 G/C 1.09%; 0.15% −2.84 Noonan syndrome Hypertension (IA)
XPA rs144725456 (H244R) 9 T/C 0.01%; 0.06% 2.61 Xeroderma pigmentosum Non-epithelial cancer of skin (other)
CDC25A rs146179438 (Q24H) 3 C/A 1.52%; 8.72% 2.52 − Kidney and urinary stones (IA)
F10 rs61753266 (E142K) 13 G/A 0.33%; 1.83% 2.46 Factor X deficiency PE and pulmonary heart disease
(inverse association)
TNXB rs61745355 (G2848R) 6 C/T 2.22%; 11.86% 2.42 Ehlers–Danlos syndrome; rs61745355:T, lymphoma
rs10947230a (R2704H) C/T 5.96%; 14.75% 2.31 vesicoureteral reflux rs10947230:T, lichen planus
rs11507521 (T302A) T/C 13.29%; 9.17% −0.54 rs1150752:C, chronic hepatitis;
other inflammatory liver diseases;
atherosclerosis
SLC39A8 rs13107325 (A391T) 4 C/T 7.40%; 1.46% −2.35 Congenital disorder of Shoulder lesions
glycosylation
CLPTM1 rs150484293 (L140F) 19 C/T 0.35%; 0.07% −2.33 − Dementia
ELL2 rs141299831 (S18L) 5 G/A 0.02%; 0.12% 2.29 − Benign neoplasm of other and
ill-defined parts of digestive system
CASP7 rs141266925 (F214L) 10 T/C 0.31%; 1.5% 2.29 − Cataracts
BRCA1 rs80357906 (Q1777fs) 17 T/TG 0.001%; 0.01% 2.21 Cancer (breast, ovarian, Breast cancer
pancreatic); Fanconi anaemia
SCN5A rs45620037 (T220I) 3 G/A 0.11%; 0.49% 2.20 Sudden infant death syndrome; Arrythmia and AF
dilated cardiomyopathy;
arrythmiab
CACNA1D rs1250342280 (F1943del) 3 CCTT/C 0.60%; 0.14% −2.09 Primary aldosteronism, Hypertension
seizures, and neurologic
abnormalities; sinoatrial node
dysfunction and deafness
WNT10A rs121908120 (F228I) 2 T/A 2.72%; 0.65% −2.06 Odontoonychodermal Follicular cysts of skin and
dysplasia; Schopf–Schulz– subcutaneous tissue (IA)
Passarge syndrome; selective
tooth agenesis
a
Other sentinel variants in the gene with greater than fourfold enrichment.
b
Sudden infant death syndrome; atrial fibrillation; Brugada syndrome; progressive and non-progressive heart block; long QT syndrome, sick sinus syndrome; ventricular fibrillation.
All enrichment indicated by two-sided Fisher’s test; unadjusted P < 5 × 10⁻⁵.
AF, atrial fibrillation; Chr, chromosome; FE, fold enrichment; IA, inverse association; PCOS, polycystic ovarian syndrome; PE, pulmonary embolism; A0, reference allele; A1, alternative (effect)
allele.
98 | Nature | Vol 603 | 3 March 2022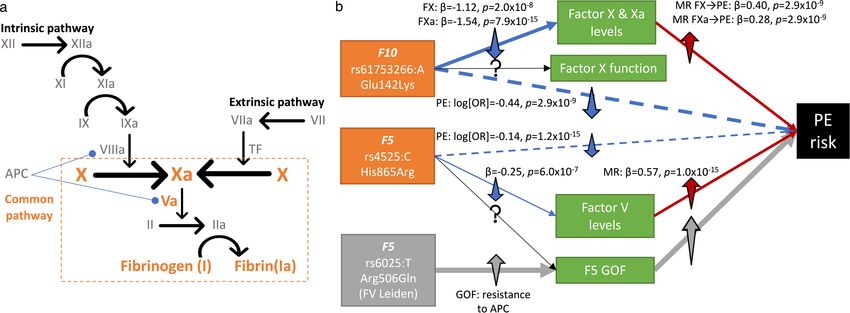
Seventeen of the twenty-three genes with highly population-enriched haemoglobin concentration (β = 0.033, P = 7.7 × 10⁻¹⁰) and haematocrit
sentinel variants (Table 1) were listed as disease genes at Online Mende- percentage (β = 0.036, P = 9.9 × 10⁻¹¹), suggesting increased renal-driven
lian Inheritance in Man (OMIM). Of these, ten (CHEK2, DBH, SCL24A5, erythropoiesis (Fig. 2b). Serum creatinine was not increased in carriers
CFI, FLG, XPA, F10, BRCA1, SCN5A and CACNA1D) showed associations of the deletion (β = −0.07, P = 3.6 × 10⁻³³), suggesting that renal function
with conditions identical or related to the respective Mendelian dis- is not adversely affected in deletion carriers. Among 11,114 renal or
ease, revealing a relevance of the associated variants on the popula- ureteric, and 13,319 urinary tract stone cases, we identified 735 (renal or
tion level. For instance, we found the missense variant rs77273740 ureteric) and 863 (urinary tract) carriers of the deletion who may ben-
in DBH (enriched by more than 50-fold in FG)—a gene associated efit from clinical interventions targeting NPT2A-related pathways and
with orthostatic hypotension—to be associated with reduced risk of monitoring for disturbed biochemical and haematological biomarkers.
hypertension (log(OR) = −0.19, P = 1.3 × 10⁻²³), and an in-frame deletion
(rs1250342280) in CACNA1D (enriched by 4.3× in UKB)—a gene associ- CHEK2 deletion and haematological signs. A frameshift deletion in
ated with primary aldosteronism—was associated with increased risk CHEK2 (rs555607708; MAF = 0.64% (FG), 0.24% (UKB)) that increases
of hypertension (log(OR) = 0.19, P = 2.0 × 10⁻⁸) (Table 1). breast cancer risk has also been previously implicated in myelopro-
liferative neoplasms through GWAS18 and lymphoid leukaemia in a
candidate variant study19. Consistently, we found nominally significant
Biomedical insights through CWAS associations with risks of both, myeloid (log(OR) = 1.52, P = 9.5 × 10⁻⁸)
We leveraged the coding variant associations identified in our study and lymphoid (log(OR) = 1.38, P = 3.1 × 10⁻⁷) leukaemia, but also multiple
to generate biological insights for a range of distinct genes, pathways myeloma (log(OR) = 1.07, P = 5.1 × 10⁻⁵) and non-Hodgkin lymphoma
and diseases and in the following exemplify the broad utility of our (log(OR) = 0.81, P = 4.7 × 10⁻⁴). Association of rs555607708 with clinical
resource with a set of selected use cases. haematology traits showed statistically significant associations with
increased blood cell counts for both myeloid (leukocytes, neutrophils
Coagulation proteins in pulmonary embolism and platelets at P < 1 × 10⁻⁶; monocyte and erythrocytes at P < 1 × 10⁻³)
We found known and novel associations with pulmonary embolism risk, and lymphoid (lymphocytes, P = 5.7 × 10⁻¹⁷) lineages (Fig. 2c). Further-
including two rare variant associations (average MAF < 1%) in genes more, we found associations with increased mean platelet volume
encoding components of the coagulation cascade at the convergent (P = 1.3 × 10⁻¹⁶) and platelet distribution width (P = 5.2 × 10⁻¹³), consist-
common pathway (Extended Data Fig. 7). For instance, we discovered ent with increased platelet activation and previous associations of
a rare missense mutation in F10, enriched by approximately fivefold mean platelet volume and platelet distribution width with chronic
in FG (rs61753266:A; Glu142Lys; MAF = 0.33% (UKB) and 1.85% (FG)), myeloid leukaemia20. We also found associations with decreased mean
and a venous thromboembolism risk-reducing variant in F5 (rs4525:C, corpuscular haemoglobin (P = 7.8 × 10⁻¹²) and mean corpuscular vol-
His865Arg; MAF = 27.2% (UKB) and 22.3% (FG)), to be protective ume (P = 5.3 × 10⁻¹⁰), suggesting that predisposition to haematological
against pulmonary embolism (log(OR)F10 = −0.44, PF10 = 2.9 × 10⁻⁹; cancers by loss of CHEK2 function is accompanied by a microcytic red
log(OR)F5 = −0.14, PF5 = 1.2 × 10⁻¹⁵). The effects of these associations on blood cell phenotype (Fig. 2c).
the levels of their respective circulating factors and thromboembolic
diseases, Mendelian randomization analyses that support developing Coding associations aid drug development
drugs inhibiting factors V and X for pulmonary embolism and findings We cross-referenced genes with significant coding variant associations
on additional clotting factors are discussed in (Supplementary Infor- with drug targets21. We found 66 genes with trait cluster associations that
mation ‘New roles for coagulation proteins in PE’). are the targets of either approved drugs (26 genes) or drugs currently
being tested in clinical trials (40 genes), 14 of which are in phase III trials
Rare variants yield mechanistic insights (Supplementary Table 10). We found a statistically significant enrich-
We interrogated the sentinel variants identified in this study for associa- ment of significant genes in our study that were also approved drug
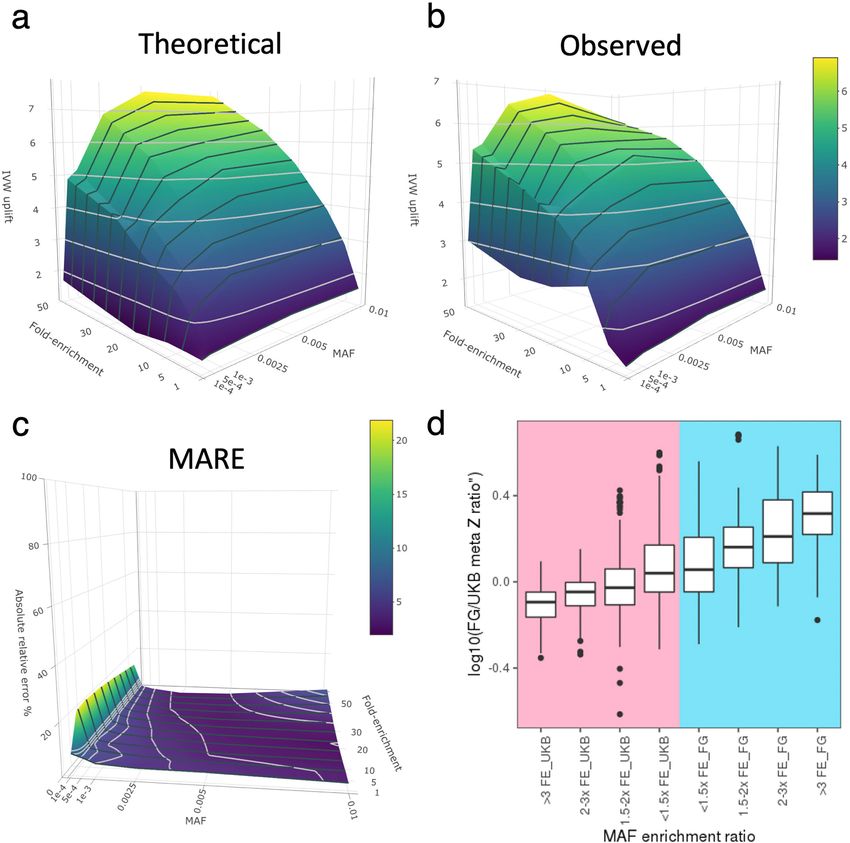
tions with 117 quantitative biomarkers spanning eight categories in UKB targets (26 out of 482, compared with a background of 569 approved
(Supplementary Table 8). At a multiple testing adjusted threshold of targets out of 19,955 genes, OR = 1.9, P = 0.0024), which is in line with
P < 1 × 10⁻⁶, we found 112 of the biomarkers to be associated with at least previous estimates of a higher success rate for drug targets supported
one of 433 sentinel variants across 247 regions (Fig. 2a, Supplementary by genetics22,23. Sensitivity analyses using more stringent associa-
Table 9, Supplementary Information). Ninety-five of the regions were tion P-value thresholds further increased these probability estimates
associated with five or more biomarker categories (Extended Data (P = 5 × 10⁻⁹ (OR = 2.3, P = 0.00070); P = 5 × 10⁻¹⁰ (OR = 2.5, P = 0.00037)),
Fig. 6c, Supplementary Table 9), including pleiotropic disease loci supporting previous observations of higher likelihood of therapeutic
such as MHC, APOE, GCKR, SH2B3 and FUT2. success with stronger genetic associations (Supplementary Table 11).
Specific examples are highlighted in the Supplementary Information.
SLC34A1 deletion and fluid biomarkers. Cross-referencing disease
with biomarker associations provided mechanistic insights into novel Atrial fibrillation (AF). GWAS have yielded a sizeable number of loci24,25.
findings. For instance, a low-frequency in-frame deletion in SLC34A1 We chose AF to exemplify how results from our study can further elu-
(rs1460573878; MAF = 2.6% (UKB) and 2.7% (FG); p.Val91_Ala97del) cidate the genetics and biological basis of one distinct human trait.
coding for the sodium phosphate cotransporter NPT2a expressed Notably, we report several coding variant associations (Supplementary
in proximal tubular cells was associated with increased risk of renal Table 3) in which prior GWAS24,25 had fallen short for resolving GWAS
(log(OR) = 0.24, P = 4.0 × 10⁻⁹) and urinary tract stones (log(OR) = 0.21, loci to coding genes and explaining disease mechanisms.
P = 6.8 × 10⁻⁹). The deletion has previously been implicated in hyper-
calciuric renal stones15,16 and autosomal recessive idiopathic infantile METTL11B methylase missense variant in AF. The AF GWAS senti-
hypercalcaemia17 in family studies. The variant is also associated with in- nel variant rs72700114 is an intergenic variant located between MET-
creased serum calcium (β = 0.047, P = 5.4 × 10⁻¹¹) and reduced phosphate TL11B and LINC01142 with no obvious candidate gene24–26. Our study
(β = −0.075, P = 3.3 × 10⁻²⁶), consistent with a disrupted function or cell revealed that a low-frequency missense variant in the methylase MET-
surface expression of the transporter17 (Fig. 2b). We further find associa- TL11B (rs41272485:G; Ile127Met; MAF = 3.9% (UKB) and 3.8% (FG))
tions with increased levels of serum urate (β = 0.048, P = 4.5 × 10⁻¹⁷), also was associated with increased AF risk (log(OR) = 0.14, P = 4.0 × 10⁻¹¹).
suggesting an increased risk of uric acid stones. Additionally, we found This variant locates to the enzyme’s S-adenosylmethionine
associations with increased erythrocyte count (β = 0.035, P = 4.7 × 10⁻¹⁰), –S-adenosyl-l-homocysteine ligand-binding site27 and is expected to
Nature | Vol 603 | 3 March 2022 | 99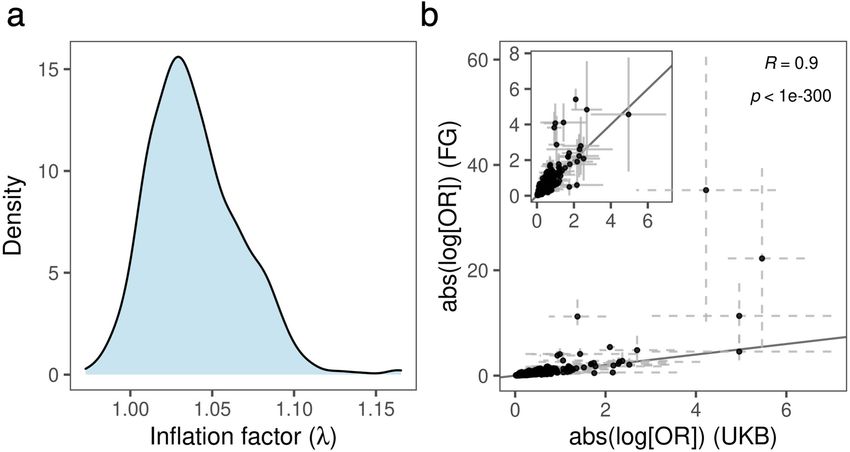
Article
a Category
Anthropometry
1
Blood biochemistry
Blood count
2
Eye measures
3 Impedance measures
4 Physical measures
5 Spirometry
Urine measures
Chromosome position
6
Effect size
7
0.10
8
9 0.05
10 0
11 –0.05
12 –0.10
13
14
15 Disease group
16
Circulatory
17
Dermatologic
18
Digestive
19
Endocrine or metabolic
20 Genitourinary
21
22 Musculoskeletal
Cholesterol
Apolipoprotein B
LDL direct
C-reactive protein
HDL cholesterol
Red blood cell (erythrocyte) distribution width
Glycated haemoglobin (HbA1c)
Urate
Heel bone mineral density
Heel bone mineral density (BMD) T-score
Neutrophil percentage
Impedance of leg (right)
Impedance of leg (left)
Impedance of whole body
Impedance of arm (right)
Impedance of arm (left)
Phosphate
Forced vital capacity
Forced expiratory volume in 1 s
Urea
Pulse rate
Testosterone
Peak expiratory flow
Hand grip strength (left)
Hand grip strength (right)
Potassium in urine
Creatinine (enzymatic) in urine
Astigmatism angle (left)
Basophil count
Basophil percentage
Sodium in urine
logMAR, final (left)
Cylindrical power (right)
Cylindrical power (left)
logMAR, final (right)
Red blood cell (erythrocyte) count
Vitamin D
Mean platelet (thrombocyte) volume
Platelet distribution width
Leg fat-free mass (right)
Leg fat-free mass (left)
Basal metabolic rate
Whole body fat-free mass
Whole body water mass
Trunk fat-free mass
Arm fat-free mass (right)
Arm fat-free mass (left)
Standing height
Seated height
Creatinine
Trunk fat mass
Leg fat mass (right)
Leg fat mass (left)
Whole body fat mass
Arm fat mass (right)
Arm fat mass (left)
Body mass index
Body fat percentage
Trunk fat percentage
Waist circumference
Leg fat percentage (right)
Leg fat percentage (left)
Arm fat percentage (right)
Arm fat percentage (left)
Weight
Hip circumference
Monocyte percentage
compensated (right)
compensated (left)
Corneal resistance factor (left)
Corneal resistance factor (right)
Corneal hysteresis (right)
Corneal hysteresis (left)
Glucose
Spherical power (right)
Spherical power (left)
Mean reticulocyte volume
Mean sphered cell volume
FEV1/ FVC ratio Z-score
Cystatin C
Alkaline phosphatase
Triglycerides
Mean corpuscular volume
Mean corpuscular haemoglobin
Reticulocyte percentage
Reticulocyte count
Monocyte count
Mean corpuscular haemoglobin concentration
Haemoglobin concentration
Haematocrit percentage
SHBG
Direct bilirubin
Total bilirubin
Alanine aminotransferase
Aspartate aminotransferase
Gamma glutamyltransferase
Total protein
Albumin
Calcium
Lymphocyte count
White blood cell (leukocyte) count
Neutrophil count
IGF-1
Lymphocyte percentage
Diastolic blood pressure
Systolic blood pressure
Eosinophil count
Eosinophil percentage
Platelet count
Platelet crit
Apolipoprotein A
Lipoprotein A
Neoplasms
Respiratory
Sense organs
Other
b c
SLC34A1 deletion (rs1460573878) CHEK2 deletion (rs555607708) log(OR)
log(OR) Trait Effect (95% CI) P –1 0 1 2
Trait Effect (95% CI) P –0.4 –0.2 0 0.2
Myeloid leukaemia 1.53 (0.97,2.09) 9.5 × 10⁻⁸
Renal or ureteric stones 0.24 (0.16,0.32) 4 × 10⁻⁹ Trait type Lymphoid leukaemia 1.38 (0.85,1.91) 3.1 × 10⁻⁷
Urinary tract stones 0.22 (0.15,0.29) 6.8 × 10⁻⁹ Multiple myeloma 1.07 (0.55,1.59) 5.1 × 10⁻⁵ Cell count
Lymphocyte count 0.014 (0,0.027) 0.043 Biochemistry Non-Hogkin lymphoma 0.81 (0.35,1.26) 0.00047 Cell property
Monocyte count 0.015 (0.003,0.028) 0.017 Disease White blood cell (leukocyte) count 0.22 (0.18,0.27) 1.7 × 10⁻²⁴
Reticulocyte count 0.017 (0.003,0.03) 0.013 Red cells Basophil count 0.02 (–0.02,0.06) 0.27
Haemoglobin concentration 0.033 (0.022,0.043) 7.7 × 10⁻¹⁰ Eosinophil count 0.05 (0.01,0.09) 0.018
White cells Monocyte count 0.1 (0.06,0.14) 4 × 10⁻⁶
Erythrocyte count 0.035 (0.024,0.046) 4.7 × 10⁻¹⁰ Neutrophil count 0.17 (0.13,0.21) 5.5 × 10⁻¹⁵
Haematocrit percentage 0.036 (0.025,0.047) 9.9 × 10⁻¹¹ Lymphocyte count 0.18 (0.14,0.22) 5.7 × 10⁻¹⁷ Trait type
Phosphate –0.075 (–0.089,–0.061) 3.3 × 10⁻²⁶ Reticulocyte count 0.03 (–0.01,0.07) 0.16
Creatinine –0.066 (–0.076,–0.055) 3.6 × 10⁻³³ Red blood cell (erythrocyte) count 0.07 (0.03,0.1) 0.00017 Haematological cancer
Apolipoprotein B 0.014 (0.001,0.027) 0.04 Mean corpuscular haemoglobin –0.14 (–0.18,–0.1) 7.8 × 10⁻¹² Plalelets
Testosterone 0.016 (0.007,0.025) 0.00039 Mean corpuscular volume –0.13 (–0.17,–0.09) 5.3 × 10⁻¹⁰
Triglycerides 0.019 (0.006,0.032) 0.0038 Mean sphered cell volume –0.1 (–0.14,–0.06) 4.6 × 10⁻⁶ Red cells
Direct bilirubin 0.021 (0.007,0.034) 0.0021 Mean reticulocyte volume –0.09 (–0.14,–0.05) 1.3 × 10⁻⁵ White cells, lymphoid
Mean corpuscular haemoglobin concentration –0.05 (–0.09,–0.01) 0.027
Urea 0.021 (0.008,0.034) 0.0017 Haemoglobin concentration –0.01 (–0.04,0.03) 0.63 White cells, myeloid
Total bilirubin 0.021 (0.01,0.033) 2 × 10⁻⁴ Red blood cell (erythrocyte) distribution width 0.06 (0.02,0.1) 0.0044 White cells, total
Cystatin C 0.025 (0.013,0.037) 2.5 × 10⁻⁵ Platelet count 0.12 (0.08,0.16) 1.3 × 10⁻⁸
Calcium 0.047 (0.033,0.061) 5.4 × 10⁻¹¹ Platelet distribution width 0.15 (0.11,0.19) 5.2 × 10⁻¹³
Urate 0.048 (0.037,0.059) 4.5 × 10⁻¹⁷ Mean platelet (thrombocyte) volume 0.16 (0.12,0.2) 1.3 × 10⁻¹⁶
Platelet crit 0.22 (0.18,0.26) 4.1 × 10⁻²⁷
–0.05 0 0.05
–0.2 0 0.2 0.4
Effect size
Effect size
Fig. 2 | Biomarker associations with sentinel variants. a, Heat map of shown. c, Forest plot of associations (unadjusted regression effect estimate
sentinel associations with biomarkers. Only significant associations (P < 10 −6) with 95% confidence interval (CI)) between CHEK2 deletion (rs555607708) with
are shown. Colours on the left axis indicate chromosomes, with cyan indicating haematological biomarkers. Unadjusted P values are shown. Disease
the MHC region. Colours on the right axis indicate sentinel association with associations n = 653,219 biologically independent samples. Specific sample
disease by group. Colours along the top indicate the category of biomarkers. sizes for biomarker associations are listed in Supplementary Table 8. IGF-1,
b, Forest plot of associations (unadjusted regression effect estimates with 95% insulin-like growth factor 1; LDL, low-density lipoprotein; SHBG, sex hormone
confidence intervals (CI)) between SLC34A1 deletion (rs1460573878) with binding globulin.
haematological and biochemistry biomarkers. associations with P < 0.05 are
perturb methylation of other AF risk genes with N-terminal (Ala/Pro/ the voltage sensing segment of SCN5A, causes a partial loss of func-
Ser)-Pro-Lys methylation motifs that are enriched in cardiomyocytes tion of the NaV1.5 channel in atrial cells and has been associated with
(Methods, Supplementary Table 12, Supplementary Results), which dilated cardiomyopathy29 and conduction defects including sick sinus
probably explains the association. syndrome and atrial standstill30 in family studies with bradycardic
changes. Consistently, we found a nominal association with reduced
Rare variants and ion channel AF loci. Within the SCN5A–SCN10A lo- pulse rate (β = −0.078, P = 0.023), suggesting that protective effects of
cus, we replicated a common missense variant in SCN10A (rs6795970:A; the variant will be most beneficial for the common tachycardic form
Ala1073Val; MAF = 40.0% (UKB) and 44.6% (FG)) that was previously of AF through reducing pulse rate. The SCN10A and SCN5A variants
described as prolonging cardiac conduction28. Additionally, we found found here are probably both moderators of AF risk that act by differ-
associations with reduced AF risk (log(OR) = −0.06, P = 2.1 × 10⁻¹²), re- ent mechanisms. Potential mechanisms underlying further AF loci are
duced pulse rate (β = −0.02, P = 4.8 × 10⁻¹⁸), and a suggestive signal for described in Supplementary Discussion.
increased risk of atrioventricular block (log(OR) = 0.10, P = 1.9 × 10⁻⁷). It
is thus tempting to speculate that loss of function of NaV1.8—the sodium Genetic effects underlying AF and pulse. To further evaluate the hy-
channel encoded by SCN10A—blunts the effects of vagus nerve activity pothesis that distinct genetic mechanisms underlying AF risk inversely
on the atria. In addition, we found a rare, enriched missense variant modulate pulse rate, we adjusted the clustered Mendelian randomiza-
in FG (rs45620037:A; Thr220Ile; MAF = 0.11% (UKB) and 0.47% (FG); tion31 (MR-Clust) algorithm to better accommodate rare-variants. We
SIFT = 0.03, PolyPhen = 0.96) in SCN5A—which encodes the cardiac then related expectation maximization clustering of AF associated
sodium channel NaV1.5—to be associated with decreased risk of AF variants with homogenous directional effects on pulse rate (Methods).
(log(OR) = −0.65, P = 1.3 × 10⁻¹²). This missense variant resides within We found clusters of CWAS AF sentinel variants in SCN10A (rs6795970)
100 | Nature | Vol 603 | 3 March 2022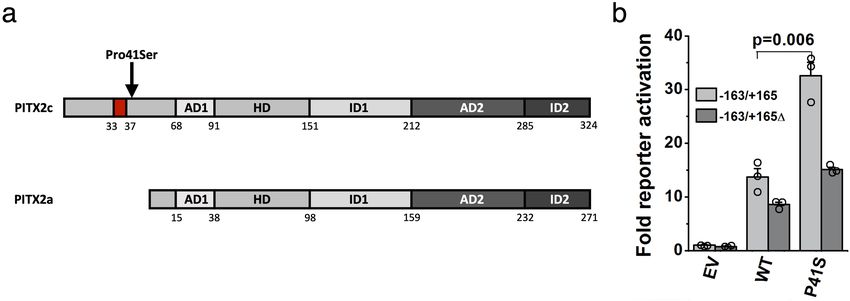
SCN10A,SCN5A
SCN5A
Discussion
Genetic association with pulse
Genetic association with pulse
SCN10A
0 0
Cluster Cluster Here we have conducted the largest association study of protein-coding
HCN4
1
1
2 –0.2 2
genetic variants so far against hundreds of disease endpoints ascer-
–0.2
3 3 tained from two massive population biobanks, UK Biobank and
4 4
–0.4 Null –0.4
Null FinnGen. We report novel disease associations, most notably in the
HCN4 rare and low-allelic frequency spectrum, replicate and assign puta-
–0.6 –0.6
tive causalities to many previously reported GWAS associations, and
0 0.25 0.50 0.75 1.00 0 0.25 0.50 0.75 1.00 leverage the insights gained to elucidate disease mechanisms, dem-
Genetic association with AF Genetic association with AF
onstrating that the step from association to biological insight may
be considerably shorter for coding variant association studies than
Genetic association with pulse
Cluster Genetic association with pulse 0 it has traditionally been for GWAS. In addition to a substantial gain in
0 1
2 power over previous studies, our analyses benefit from replication
3
–0.2 4
–0.2 Cluster between two population cohorts, increasing the robustness of our
5 Null findings and setting the stage for future similar studies in ethnically
6
–0.4
7 –0.4 more diverse populations.
8
9 Notably, our study identifies both pathogenic variants residing
–0.6 –0.6
in monogenic disease genes to impact the risk for related complex
0 0.25 0.50 0.75 1.00 0 0.25 0.50 0.75 1.00 conditions as well as new, probably causal sentinel variants within
Genetic association with AF Genetic association with AF
GWAS loci in genes with known and novel biological roles in the respec-
Fig. 3 | Genetic and functional insights into atrial fibrillation. Clustered tive GWAS trait. With this, our study is one of the first to help bridge
Mendelian randomization plot of association of atrial fibrillation loci with the gap between common and rare disease genetics across a broad
pulse rate. Only variants with cluster inclusion probability greater than 0.7 are range of conditions and provides support for the hypothesis that the
included. Top left, CWAS loci (sentinels). Top right, overlapping CWAS and genetic architecture of many diseases is continuous1. Of the 975 asso-
atrial fibrillation GWAS loci. Bottom left, all atrial fibrillation GWAS loci from ciations identified in our study, 145 are driven by unique variants in
Nielsen et al.49 (with zoomed inset). Bottom right, all atrial fibrillation GWAS
the so far little-interrogated rare and low-allelic frequency spectrum
loci with permuted pulse (null, with zoomed inset).
between 0.1 and 2% that neither GWAS nor sequencing studies have
been able to thoroughly interrogate across a range of diseases and
that is hypothesized to contribute to the ‘missing heritability’ of many
and HCN4 (rs151004999) as two genetic components of AF that can human diseases34.
increase and decrease pulse rate, respectively (Fig. 3, Supplementary Our approach benefits considerably from the Finnish genetic back-
Table 13). Identifying components of AF with diverging directionality on ground, where certain alleles are stochastically enriched to unusually
pulse rate matches clinical observations that AF can be caused by both high allele frequencies6–8, at times exceeding population frequen-
tachycardia and bradycardia32. Using sentinel variants from a recent AF cies in the UK Biobank by more than 50-fold. Our theoretical and
GWAS24 for sensitivity analyses yielded concordant patterns. By inte- empirical results suggest the increasing utility of enriched variants
grating CWAS and GWAS sentinel variants for AF we found additional for identifying associations quantitatively towards lower allelic fre-
clusters with differing effects on pulse rate. Expectedly, within the AF quencies. Notably, we identify the most prominent relative power
GWAS loci24, the two rare missense alleles in HCN4 (rs151004999:T, gain in the rarest variant frequency spectrum, highlighting a role for
log(OR) = 0.72) and SCN5A (rs45620037:A, log(OR) = −0.65) identi- sequencing studies and integrating additional population cohorts
fied in our study had much larger effect sizes on AF risk than the re- with enriched variants for identifying novel disease associations at
spective non-coding sentinel GWAS variants (rs74022964:T (HCN4 scale. We identify several alleles with comparatively high effect sizes
locus), log(OR) = 0.12; rs6790396:C (SCN5A and SCN10A locus), and a prevalence in the population that warrants follow-up, both
log(OR) = −0.058) (Fig. 3). experimentally as well as potentially directly in clinical settings to
help improve disease outcomes. For instance, our data propose that
Functional effects of PITX2c(Pro41Ser). Finally, we found a rare 6.5% of UKB and FG participants with kidney or urinary tract stones,
missense variant in PITX2 as associated with increased risk of AF conditions debilitating more than 15% of men and 5% of women by 70
(log(OR) = 0.38, P = 1.1 × 10⁻⁹). This variant is enriched nearly 50-fold years of age35, carry a deletion in SLC34A1. Monitoring patients for
in FG (rs143452464:A; Pro41Ser; MAF = 0.023% (UKB) and 1.1% (FG)) the clinical biomarkers identified here as associated with this dele-
and was independently identified in a French family with AF (Supple- tion might help to differentiate aetiologies and guide individualized
mentary Information), whereas GWAS had linked intergenic variants treatments. Similarly, coding variant associations identified in our
between PITX2 and FAM241A to AF risk. PITX2 is a bicoid type homeobox study may serve as an attractive source to generate hypotheses for
transcription factor previously assumed to play a role in cardiac rhythm drug discovery programs. Our results support previous studies22,23
control33. The Pro41Ser variant lies in the N-terminal domain that is that drug targets supported by human genetics have an increased
only present in the PITX2c isoform expressed in cardiac muscle. In likelihood of success, which can be considered particularly high when
reporter assays comparing the ability of PITX2c wild-type and Pro41Ser the genetic effect on a drug target closely mimics that of a pharma-
protein constructs to transactivate a luciferase reporter plasmid con- cological intervention36.
taining a putative PITX2c-binding element, PITX2c(Pro41Ser) showed Our results foreshadow the discovery of many additional cod-
an approximately 2.4-fold higher activation of the reporter than the ing and non-coding associations from cross-biobank analyses at
wild type (P = 0.006, Extended Data Fig. 8). This effect was abrogated even larger sample sizes. With the continued growth of population
upon deletion of the putative PITX2c-binding site. In cultured cardiac biobanks with comprehensive health data in non-European popula-
muscle HL-1 cells, the Pro41Ser mutation increased the transcription tions, the emergence of more and more cost-effective technologies
of several presumed PITX2c target genes (Supplementary Table 14, for sequencing and genotyping, and computational advances to
Supplementary Information). Together, these results are consistent analyse genetic and non-genetic data at scale, future studies will be
with a putative gain-of-function mechanism of Pro41Ser on PITX2c able to assess the genetic contribution to health and disease at even
transactivation potential and AF risk. finer resolution.
Nature | Vol 603 | 3 March 2022 | 101
Article
                                                                                                    23. King, E. A., Davis, J. W. & Degner, J. F. Are drug targets with genetic support twice as likely
Online content                                                                                          to be approved? Revised estimates of the impact of genetic support for drug
                                                                                                        mechanisms on the probability of drug approval. PLoS Genet. 15, e1008489 (2019).
Any methods, additional references, Nature Research reporting sum-                                  24. Nielsen, J. B. et al. Biobank-driven genomic discovery yields new insight into atrial
maries, source data, extended data, supplementary information,                                          fibrillation biology. Nat. Genet. 50, 1234–1239 (2018).
                                                                                                    25. Roselli, C. et al. Multi-ethnic genome-wide association study for atrial fibrillation. Nat.
acknowledgements, peer review information; details of author contri-                                    Genet. 50, 1225–1233 (2018).
butions and competing interests; and statements of data and code avail-                             26. Thorolfsdottir, R. B. et al. A missense variant in PLEC increases risk of atrial fibrillation. J.
ability are available at https://doi.org/10.1038/s41586-022-04394-w.                                    Am. Coll. Cardiol. 70, 2157–2168 (2017).
                                                                                                    27. Dong, C. et al. An asparagine/glycine switch governs product specificity of human
                                                                                                        N-terminal methyltransferase NTMT2. Commun. Biol. 1, 183 (2018).
1.  Claussnitzer, M. et al. A brief history of human disease genetics. Nature 577, 179–189          28. Chambers, J. C. et al. Genetic variation in SCN10A influences cardiac conduction. Nat.
    (2020).                                                                                             Genet. 42, 149–152 (2010).
2.  Bycroft, C. et al. The UK Biobank resource with deep phenotyping and genomic data.              29. Olson, T. M. et al. Sodium channel mutations and susceptibility to heart failure and atrial
    Nature 562, 203–209 (2018).                                                                         fibrillation. JAMA 293, 447–454 (2005).
3.  Van Hout, C. V. et al. Exome sequencing and characterization of 49,960 individuals in the       30. Zaklyazminskaya, E. & Dzemeshkevich, S. The role of mutations in the SCN5A gene in
    UK Biobank. Nature 586, 749–756 (2020).                                                             cardiomyopathies. Biochim. Biophys. Acta 1863, 1799–1805 (2016).
4. Szustakowski, J. D. et al. Advancing human genetics research and drug discovery through          31. Foley, C. N., Mason, A. M., Kirk, P. D. W. & Burgess, S. MR-Clust: clustering of genetic
    exome sequencing of the UK Biobank. Nat. Genet. 53, 942–948 (2021).                                 variants in Mendelian randomization with similar causal estimates. Bioinformatics 37,
5.  Wang, Q. et al. Rare variant contribution to human disease in 281,104 UK Biobank exomes.            531–541 (2020).
    Nature 597, 527–532 (2021).                                                                     32. Sidhu, S. & Marine, J. E. Evaluating and managing bradycardia. Trends Cardiovasc. Med.
6.  Karczewski, K. J. et al. Systematic single-variant and gene-based association testing of            30, 265–272 (2020).
    3,700 phenotypes in 281,850 UK Biobank exomes. Preprint at https://doi.org/                     33. Syeda, F., Kirchhof, P. & Fabritz, L. PITX2-dependent gene regulation in atrial fibrillation
    10.1101/2021.06.19.21259117 (2021).                                                                 and rhythm control. J. Physiol. 595, 4019–4026 (2017).
7.  Peltonen, L., Jalanko, A. & Varilo, T. Molecular genetics of the Finnish disease heritage.      34. Eichler, E. E. et al. Missing heritability and strategies for finding the underlying causes of
    Hum. Mol. Genet. 8, 1913–1923 (1999).                                                               complex disease. Nat. Rev. Genet. 11, 446–450 (2010).
8.  Lim, E. T. et al. Distribution and medical impact of loss-of-function variants in the Finnish   35. Howles, S. A. & Thakker, R. V. Genetics of kidney stone disease. Nat. Rev. Urol. 17, 407–421
    founder population. PLoS Genet. 10, e1004494 (2014).                                                (2020).
9.  Locke, A. E. et al. Exome sequencing of Finnish isolates enhances rare-variant association      36. Plenge, R. M., Scolnick, E. M. & Altshuler, D. Validating therapeutic targets through human
    power. Nature 572, 323–328 (2019).                                                                  genetics. Nat. Rev. Drug Discov. 12, 581–594 (2013).
10. Hassan, S. et al. High-resolution population-specific recombination rates and their effect
    on phasing and genotype imputation. Eur. J. Hum. Genet. 29, 615–624 (2020).                     Publisher’s note Springer Nature remains neutral with regard to jurisdictional claims in
11. Buniello, A. et al. The NHGRI-EBI GWAS Catalog of published genome-wide association             published maps and institutional affiliations.
    studies, targeted arrays and summary statistics 2019. Nucleic Acids Res. 47, D1005–D1012
    (2019).                                                                                                            Open Access This article is licensed under a Creative Commons Attribution
12. Staley, J. R. et al. PhenoScanner: a database of human genotype-phenotype associations.                            4.0 International License, which permits use, sharing, adaptation, distribution
    Bioinformatics 32, 3207–3209 (2016).                                                                               and reproduction in any medium or format, as long as you give appropriate
13. Landrum, M. J. et al. ClinVar: improving access to variant interpretations and supporting       credit to the original author(s) and the source, provide a link to the Creative Commons license,
    evidence. Nucleic Acids Res. 46, D1062–D1067 (2018).                                            and indicate if changes were made. The images or other third party material in this article are
14. Miller, D. T. et al. ACMG SF v3.0 list for reporting of secondary findings in clinical exome    included in the article’s Creative Commons license, unless indicated otherwise in a credit line
    and genome sequencing: a policy statement of the American College of Medical                    to the material. If material is not included in the article’s Creative Commons license and your
    Genetics and Genomics (ACMG). Genet. Med. 23, 1381–1390 (2021).                                 intended use is not permitted by statutory regulation or exceeds the permitted use, you will
15. Lapointe, J. Y. et al. NPT2a gene variation in calcium nephrolithiasis with renal phosphate     need to obtain permission directly from the copyright holder. To view a copy of this license,
    leak. Kidney Int. 69, 2261–2267 (2006).                                                         visit http://creativecommons.org/licenses/by/4.0/.
16. Halbritter, J. et al. Fourteen monogenic genes account for 15% of nephrolithiasis/
    nephrocalcinosis. J. Am. Soc. Nephrol. 26, 543–551 (2015).                                      © The Author(s) 2022
17. Schlingmann, K. P. et al. Autosomal-recessive mutations in SLC34A1 encoding
    sodium-phosphate cotransporter 2A cause idiopathic infantile hypercalcemia. J. Am.
                                                                                                    Biogen Biobank Team
    Soc. Nephrol. 27, 604–614 (2016).
18. Hinds, D. A. et al. Germ line variants predispose to both JAK2 V617F clonal hematopoiesis
    and myeloproliferative neoplasms. Blood 128, 1121–1128 (2016).                                  Benjamin B. Sun1,2, Chia-Yen Ghen1, Eric Marshall1, Jemma B. Wilk1 & Heiko Runz1
19. Sellick, G. S., Sullivan, K., Catovsky, D. & Houlston, R. S. CHEK2*1100delC and risk of
    chronic lymphocytic leukemia. Leuk. Lymphoma 47, 2659–2660 (2006).                              A full list of members and their affiliations appears in the Supplementary Information
20. Yan, K. et al. Normal platelet counts mask abnormal thrombopoiesis in patients with
    chronic myeloid leukemia. Oncol. Lett. 10, 2390–2394 (2015).
                                                                                                    Finn Gen
21. Wang, Y. et al. Therapeutic target database 2020: enriched resource for facilitating
    research and early development of targeted therapeutics. Nucleic Acids Res. 48,
    D1031–D1041 (2020).                                                                             Mitja I. Kurki3,4,5,6, Aarno Palotie3,4,5,6 & Mark J. Daly3,4,5,6
22. Nelson, M. R. et al. The support of human genetic evidence for approved drug
    indications. Nat. Genet. 47, 856–860 (2015).                                                    A full list of members and their affiliations appears in the Supplementary Information

102 | Nature | Vol 603 | 3 March 2022
Methods
                                                                            FG genetic QC. Samples were genotyped with Illumina and Affym-
Samples and participants                                                    etrix arrays (Thermo Fisher Scientific). Genotype calls were made with
UKB is a UK population study of approximately 500,000 participants          GenCall and zCall algorithms for Illumina and AxiomGT1 algorithm for
aged 40–69 years at recruitment2. Participant data (with informed con-      Affymetrix data. Sample, genotyping as well as imputation procedures
sent) include genomic, electronic health record linkage, blood, urine       and QC are detailed in Supplementary Information.
and infection biomarkers, physical and anthropometric measurements,
imaging data and various other intermediate phenotypes that are con-        Coding variant selection. GnomAD v.2.0 variant annotations were
stantly being updated. Further details are available at https://biobank.    used for FinnGen variants39. The following gnomAD annotation catego-
ndph.ox.ac.uk/showcase/. Analyses in this study were conducted under        ries are included: pLOF, low-confidence loss-of-function (LC), in-frame
UK Biobank Approved Project number 26041. Ethic protocols are pro-          insertion–deletion, missense, start lost, stop lost, stop gained. Variants
vided by the UK Biobank Ethics Advisory Committee (https://www.             have been filtered to imputation INFO score > 0.6. Additional variant
ukbiobank.ac.uk/learn-more-about-uk-biobank/about-us/ethics).               annotations were performed using variant effect predictor (VEP)40 with
   FG is a public-private partnership project combining electronic          SIFT and PolyPhen scores averaged across the canonical annotations.
health record and registry data from six regional and three Finnish
biobanks. Participant data (with informed consent) include genom-           Disease endpoint association analyses
ics and health records linked to disease endpoints. Further details are     For optimized meta-analyses with FG, analyses in UKB were performed
available at https://www.finngen.fi/. More details on FG and ethics         in the subset of exome-sequence UKB participants with white European
protocols are provided in Supplementary Information. We used data           ancestry for consistency with FG (n = 392,814). We used REGENIE v1.0.6.7
from FG participants with completed genetic measurements (R5 data           for association analyses via a two-step procedure as detailed in ref. 41. In
release) and imputation (R6 data release). FinnGen participants pro-        brief, the first step fits a whole genome regression model for individual
vided informed consent for biobank research. Recruitment protocols          trait predictions based on genetic data using the leave one chromosome
followed the biobank protocols approved by Fimea, the National Super-       out (LOCO) scheme. We used a set of high-quality genotyped variants:
visory Authority for Welfare and Health. The Coordinating Ethics Com-       MAF > 5%, MAC > 100, genotyping rate >99%, Hardy–Weinberg equilib-
mittee of the Hospital District of Helsinki and Uusimaa (HUS) approved      rium (HWE) test p > 10−15, 100 cases and for variants with MAC ≥ 5 in total
tries. For disease definition consistency, we reproduced the same Phe-      samples and MAC ≥ 3 in cases and controls. The number of variants used
code maps using the same ICD-10 definitions in UKB. In particular, we       for analyses varies for different diseases as a result of the MAC cut-off
expertly curated 15 neurological phenotypes using ICD10 codes. We           for different disease prevalence. The association models in both steps
retained phenotypes where the similarity score ( Jaccard index: ICD10FG     also included the following covariates: age, age2, sex, age*sex, age2*sex,
∩ ICD10UKB / ICD10FG ∪ ICD10UKB) was >0.7 and additionally excluded         first 10 genetic principal components (PCs).
spontaneous deliveries and abortions.                                          Association analyses in FG were performed using mixed model logis-
   Phecodes and ICD10 coded phenotypes were first mapped to uni-            tic regression method SAIGE v0.3942. Age, sex, 10 PCs and genotyping
fied disease names and disease groups using mappings from Phecode,          batches were used as covariates. For null model computation for each
PheWAS and icd R packages followed by manual curation of unmapped           endpoint each genotyping batch was included as a covariate for an end-
traits and diseases groups, mismatched and duplicate entries. Disease       point if there were at least 10 cases and 10 controls in that batch to avoid
endpoints were mapped to Experimental Factor Ontology (EFO) terms           convergence issues. One genotyping batch need be excluded from covari-
using mappings from EMBL-EBI and Open Targets based on exact dis-           ates to not have them saturated. We excluded Thermo Fisher batch 16
ease entry matches followed by manual curation of unmapped traits.          as it was not enriched for any particular endpoints. For calculating the
   Disease trait clusters were determined through first calculating the     genetic relationship matrix, only variants imputed with an INFO score
phenotypic similarity via the cosine similarity, then determining clus-     >0.95 in all batches were used. Variants with >3% missing genotypes were
ters via hierarchical clustering on the distance matrix (1-similarity)      excluded as well as variants with MAF < 1%. The remaining variants were
using the Ward algorithm and cutting the hierarchical tree, after inspec-   linkage-disequilibrium pruned with a 1-Mb window and r2 threshold of
tion, at height 0.8 to provide the most semantically meaningful clusters.   0.1. This resulted in a set of 59,037 well-imputed not rare variants for GRM
                                                                            calculation. SAIGE options for null computation were: “LOCO=false, num-
Genetic data processing                                                     Markers=30, traceCVcutoff=0.0025, ratioCVcutoff=0.001”. Association
UKB genetic QC. UKB genotyping and imputation were performed as             tests were performed phenotypes with case counts >100 and for variants
described previously2. Whole-exome sequencing data for UKB partici-         with minimum allele count of 3 and imputation INFO >0.6 were used.
pants were generated at the Regeneron Genetics Center (RGC) as part of         We additionally performed sex-specific associations for a subset of
a collaboration between AbbVie, Alnylam Pharmaceuticals, AstraZen-          gender-specific diseases (60 female diseases and in 50 disease clus-
eca, Biogen, Bristol-Myers Squibb, Pfizer, Regeneron and Takeda with        ters, 14 male diseases and in 13 disease clusters) in both FG and UKB
the UK Biobank. Whole-exome sequencing data were processed using            using the same approach without inclusion of sex-related covariates
the RGC SBP pipeline as described3,38. RGC generated a QC-passing           (Supplementary Table 2)
‘Goldilocks’ set of genetic variants from a total of 454,803 sequenced         We performed fixed-effect inverse-variance meta-analysis combin-
UK Biobank participants for analysis. Additional quality control (QC)       ing summary effect sizes and standard errors for overlapping variants
steps were performed prior to association analyses as detailed below.       with matched alleles across FG and UKB using METAL43.
Article
used two-sample Mendelian randomization using summary statistics,
Definition and refinement of significant regions with effect of the variants on their respective factor levels obtained
To define significance, we used a combination of (1) multiple test- from previous large scale (protein quantitative trait loci) pQTL stud-
ing corrected threshold of P < 2 × 10⁻⁹ (that is, 0.05/(approximately ies46,47. Let βXY denote the estimated causal effect of a factor level on
26.8 × 10⁶), the sum of the mean number of variants tested per disease pulmonary embolism risk and βX , βY be the genetic association with a
cluster)), to account for the fact that some traits are highly correlated factor level (FV, FX or FXa) and pulmonary embolism risk respectively.
disease subtypes, (2) concordant direction of effect between UKB and Then, the Mendelian randomization ratio-estimate of βXY is given by:
FG associations, and (3) P < 0.05 in both UKB and FG.
We defined independent trait associations through linkage- βY
βXY =
disequilibrium-based (r2 = 0.1) clumping ±500 kb around the βX
lead variants using PLINK44, excluding the HLA region (chr6:25.5-
34.0Mb) which is treated as one region due to complex and extensive where the corresponding standard error se(βXY ), computed to leading
linkage-disequilibrium patterns. We then merged overlapping inde- order, is:
pendent regions (±500 kb) and further restricted each independent
variant (r2 = 0.1) to the most significant sentinel variant for each unique se(βY )
se(βXY ) =
gene. For overlapping genetic regions that are associated with multiple |βX |
disease endpoints (pleiotropy), to be conservative in reporting the
number of associations we merged the overlapping (independent) Clustered Mendelian randomization. To assess evidence of several
regions to form a single distinct region (indexed by the region ID col- distinct causal mechanisms by which AF may influence pulse rate (PR)
umn in Supplementary Table 3). we used MR-Clust31. In brief, MR-Clust is a purpose-built clustering
algorithm for use in univariate Mendelian randomization analyses.
Cross-reference with known associations It extends the typical Mendelian randomization assumption that a
We cross-referenced the sentinel variants and their proxies (r2 > 0.2) risk factor can influence an outcome via a single causal mechanism48
for significant associations (P < 5 × 10⁻⁸) of mapped EFO terms and to a framework that allows one or more mechanisms to be detected.
their descendants in GWAS Catalog11 and PhenoScanner12. To be more When a risk-factor affects an outcome via several mechanisms, the set
conservative with reporting of novel associations, we also considered of two-stage ratio-estimates can be divided into clusters, such that
whether the most-severe associated gene in our analyses were reported variants within each cluster have similar ratio-estimates. As shown in31,
in GWAS Catalog and PhenoScanner. In addition, we also queried our two or more variants are members of the same cluster if and only if they
sentinel variants in ClinVar13 to define known associations with rarer affect the outcome via the same distinct causal pathway. Moreover, the
genetic diseases and further manually curated novel associations estimated causal effect from a cluster is proportional to the total causal
(where the association is a novel variant association and a novel gene effect of the mechanism on the outcome. We included variants within
association) for previous genome-wide significant (P < 5 × 10⁻⁸) asso- clusters where the probability of inclusion >0.7. We used MR-Clust
ciations. algorithm allowing for singletons/outlier variants to be identified as
To assess medical actionability of associated genes, we cross- their own ‘clusters’ to reflect the large but biologically plausible effect
referenced the associated genes with the latest ACMG v3. (75 unique sizes seen with rare and low-frequency variants.
genes linked to 82 conditions, linked to cancer (n = 28), cardiovascular
(n = 34), metabolic (n = 3), or miscellaneous conditions (n = 8)). This list Bioinformatic analyses for METTL11B
was supplemented by 20 ‘ACMG watchlist genes’14 for which evidence We searched [Ala/Pro/Ser]-Pro-Lys motif containing proteins using the
for inclusion to ACMG 3.0 list was considered too preliminary based on ‘peptide search’ function on UniProt49, filtering for reviewed Swiss-Prot
either technical, penetrance or clinical management concerns proteins and proteins listed in Human Protein Atlas50 (HPA) (n = 7,656).
We obtained genes with elevated expression in cardiomyocytes
Biomarker associations of lead variants (n = 880) from HPA based on the criteria: ‘cell_type_category_rna: car-
For the lead sentinel variants, we performed association analyses using diomyocytes; cell type enriched, group enriched, cell type enhanced’
the two-step REGENIE approach described above with 117 biomark- as defined by HPA at https://www.proteinatlas.org/humanproteome/
ers including anthropometric traits, physical measurements, clinical celltype/Muscle+cells#cardiomyocytes (accessed 20th March 2021)
haematology measurements, blood and urine biomarkers available with filtering for those with valid UniProt IDs (Swiss-Prot, n = 863).
in UKB (detailed in Supplementary Table 8). Additional biochemis- Enrichment test was performed using Fisher’s exact test. Additionally,
try subgroupings were based on UKB biochemistry subcategories: we performed enrichment analyses using any [Ala/Pro/Ser]-Pro-Lys
https://www.ukbiobank.ac.uk/media/oiudpjqa/bcm023_ukb_bio- motif positioned within the N-terminal half of the protein (n = 4,786).
marker_panel_website_v1-0-aug-2015-edit-2018.pdf
Additional methods Additional methods on further FinnGen QC;
Drug target mapping and enrichment theoretical description and simulation of the effect of MAF enrich-
We mapped the annotated gene for each sentinel variant to drugs using ment on inverse-variance weighted (IVW) meta-analysis Z-scores; and
the therapeutic target database (TTD)21. We retained only drugs which functional characterization of PITX2c(Pro41Ser) are provided in the
have been approved or are in clinical trial stages. For enrichment analy- Supplementary Information.
sis of approved drugs with genetic associations, we used Fisher’s exact
test on the proportion of significant genes targeted by approved drug Reporting summary
against a background of all approved drugs in TTD21 (n = 595) and 20,437 Further information on research design is available in the Nature
protein coding genes from Ensembl annotations45. Research Reporting Summary linked to this paper.
Mendelian randomization analyses
F5 and F10 effects on pulmonary embolism. The missense variants Data availability
rs4525 and rs61753266 in F5 and F10 genes were taken as genetic instru- Full summary association results of this study are accessible at https://
ments for Mendelian randomization analyses. To assess potential that doi.org/10.5281/zenodo.5571000. Summary and individual-level
each factor level is causally associated with pulmonary embolism we whole-exome sequencing data from UKB participants have beenYou can also read