No.3 CAREC Institute Quarterly Economic Monitor - June 2021
←
→
Page content transcription
If your browser does not render page correctly, please read the page content below
CAREC Institute
Quarterly Economic Monitor

                       No.3
Hans Holzhacker
Kamalbek Karymshakov
Shiliang Lu

June 2021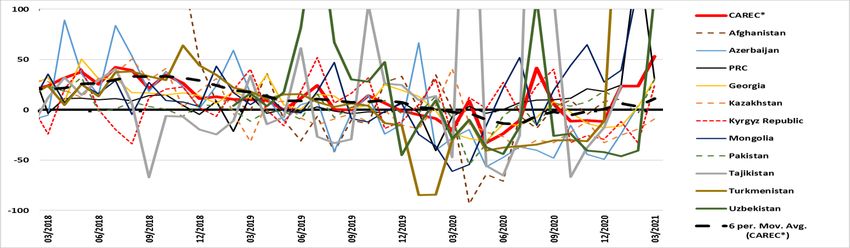
CAREC Institute

Quarterly Economic Monitor

      Hans Holzhacker
   Kamalbek Karymshakov
        Shiliang Lu

         June 2021
Disclaimer
This issue of the CAREC Institute Quarterly Economic Monitor looks at economic developments in the
CAREC region based on latest available GDP, fiscal, monetary, and external economy data, along with
some high-frequency data. It also reviews the vaccination progress in the CAREC region and lists news
about economic cooperation within the region.

The Monitor is co-authored by Hans Holzhacker, Chief Economist at the CAREC Institute, Kamalbek
Karymshakov, Economist at the CAREC Institute, and Shiliang Lu, Research Specialist at the CAREC
Institute.

The views expressed in this Economic Monitor are the views of the authors and do not necessarily reflect
the views or policies of the CAREC Institute, its funding entities, or its Governing Council. The CAREC
Institute does not guarantee accuracy of the data included in this paper and accepts no responsibility for
any consequences of their use. The terminology used may not necessarily be consistent with the CAREC
Institute’s official terms. By making any designation of or reference to a particular territory or geographical
area, or by using country names in the report, the author(s) did not intend to make any judgment as to
the legal or other status of any territory or area. Boundaries, colors, denominations, or any other
information shown on maps do not imply any judgment on the legal status of any territory, or any
endorsement or acceptance of such boundaries, colors, denominations, or information.

This work is available under the Creative Commons Attribution 3.0 IGO license (CC BY 3.0 IGO)
https://creativecommons.org/licenses/by/3.0/igo/. By using the content of this paper, you agree to be
bound by the terms of this license. This CC license does not apply to other copyright materials in this
paper. If the material is attributed to another source, please contact the copyright owner or publisher of
that source for permission to reproduce it. The CAREC Institute cannot be held liable for any claims that
arise as a result of your use of the material.

Central Asia Regional Economic Cooperation (CAREC) Institute
No. 376 Nanchang Road, Urumqi, Xinjiang, the PRC
f: +86-991-8891151
LinkedIn
km@carecinstitute.org
www.carecinstitute.org

CAREC Institute Quarterly Economic Monitor ∣ June 2021                                           Page 2 of 38
CONTENTS

ON THE WAY TO RECOVERY, BUT THE PHASING OUT OF SUPPORT MEASURES MUST BE CAREFUL AND
SELECTIVE...................................................................................................................................................... 6
Recovery, but some CAREC economies still experienced negative growth in Q1 ..................................... 6
The recovery is largely driven by manufacturing, growth in services is still rather weak ......................... 8
Consumption and investment severely hit in 2020, and still need time to recover fully ........................ 10
Lower wages and increasing unemployment ............................................................................................ 12
Higher money supply, but credit growth is still sluggish .......................................................................... 15
Exchange rates remained relatively stable during the pandemic ............................................................ 17
High-frequency indicators: export-driven recovery in industrial output, retail sales volatile ................ 18
Prospects depend on the global economy, but overcoming COVID-19 at home remains key ................ 21
VACCINATION PROGRESS IN THE CAREC REGION .............................................................................. 22
CONCLUSIONS ................................................................................................................................. 26
ANNEX 1: CAREC-COUNTRY POLICY RESPONSES TO COVID-19 ........................................................... 27
ANNEX 2: CAREC COOPERATION INITIATIVES IN THE MEDIA .............................................................. 33
CAREC governments’ cooperation initiatives ............................................................................................ 33
CAREC cross-border business activities ..................................................................................................... 36
CAREC intra-regional economic highlights ................................................................................................ 38

CAREC Institute Quarterly Economic Monitor ∣ June 2021                                                                                        Page 3 of 38

Figures

Figure 1. Real GDP growth (%, yoy) .............................................................................................................. 7
Figure 2. GDP: Agriculture (%, yoy) ............................................................................................................... 9
Figure 3. GDP: Manufacturing (%, yoy) ......................................................................................................... 9
Figure 4. GDP: Mining and Quarrying (%, yoy) ........................................................................................... 10
Figure 5. GDP: Services (%, yoy).................................................................................................................. 10
Figure 6. GDP by expenditure: Household consumption (%, yoy) .............................................................. 11
Figure 7. GDP by expenditure: Gross fixed capital formation (%, yoy)....................................................... 11
Figure 8. Investment in “basic funds” (fixed assets), early 2021 (%, yoy) .................................................. 12
Figure 9. GDP by expenditure: Government spending (%, yoy) ................................................................. 12
Figure 10. Real wage growth (%, yoy) ......................................................................................................... 13
Figure 11. Unemployment rates (annual, %) .............................................................................................. 14
Figure 12. Employment by sectors (%, yoy) ................................................................................................ 14
Figure 13. Poverty headcount ratio at national poverty lines (% of population) ....................................... 15
Figure 14. Money supply M2 (%, yoy)......................................................................................................... 15
Figure 15. Bank Deposits (%, yoy) ............................................................................................................... 16
Figure 16. Bank loans (%, yoy) .................................................................................................................... 16
Figure 17. Non-performing loans (as % total loans) ................................................................................... 17
Figure 18. Exchange rates (USD/national currency, 3-2018=1.00) ............................................................. 17
Figure 19. Share of foreign exchange in deposits (%) ................................................................................. 18
Figure 20. Export (USD based, FOB, %, yoy) ............................................................................................... 18
Figure 21. Import (USD based, CIF, %, yoy) ................................................................................................ 19
Figure 22. Trade balance (USD based, monthly data in % of full-year GDP) .............................................. 19
Figure 23. Industrial output (%, yoy) .......................................................................................................... 20
Figure 24. Retail sales (%, yoy) .................................................................................................................... 20
Figure 25. Inflation: Consumer price index (%, yoy) ................................................................................... 21
Figure 26. Google COVID-19 community mobility: Retail & Recreation..................................................... 21
Figure 27. Google COVID-19 community mobility: Workplaces ................................................................. 22
Figure 28. Google mobility reports, retail sales and industrial output in CAREC ....................................... 22
Figure 29. Daily new confirmed COVID-19 cases per mIn people (as of 9 June 2021) ............................... 23
Figure 30. COVID-19 vaccine development (as of 8 June 2021) ................................................................. 24
Figure 31. Share of persons who received at least one dose of COVID-19 vaccine in the total population
(as of 9 June 2021) ...................................................................................................................................... 25
Figure 32. COVID-19 vaccination policy: vaccine delivery for different groups (as of 9 June 2021) .......... 26

Tables
Table 1. Real GDP growth forecasts (%, yoy) ................................................................................................ 7
Table 2. Real GDP growth (%, yoy)................................................................................................................ 8
Table 3. Vaccine status in the CAREC economies ....................................................................................... 24

CAREC Institute Quarterly Economic Monitor ∣ June 2021                                                                                    Page 4 of 38
Abbreviations

ADB           Asian Development Bank

bln           billion

CAREC         Central Asia Regional Economic Cooperation

CNY            Chinese Yuan

CPI           Consumer Price Index

GDP           Gross Domestic Product

IMF           International Monetary Fund

mln           million

NPL           Non-performing Loans

PRC           People's Republic of China

Q1            First quarter

Q2            Second quarter

Q3            Third quarter

Q4            Fourth quarter

qoq           quarter-on-quarter

WB            World Bank

WHO           World Health Organization

yoy           year-on-year

CAREC Institute Quarterly Economic Monitor ∣ June 2021     Page 5 of 38
ON THE WAY TO RECOVERY, BUT THE PHASING OUT OF SUPPORT MEASURES MUST BE
                          CAREFUL AND SELECTIVE

Average CAREC region real GDP growth finally turned positive in the first quarter of 2021, after negative
growth rates throughout 2020. The recovery was especially strong in the PRC. Countries with a high share
of exports going to the PRC such as Mongolia and Turkmenistan also profited from this. Higher fuel and
metal prices benefitted the CAREC net exporters of mineral fuels and metals. A number of CAREC
economies reached already higher readings in several indicators than in comparable periods of 2019.

However, GDP still contracted in four of the eleven CAREC economies. Goods exports and manufacturing
rose substantially, but services posted a less impressive recovery than manufacturing, and household
consumption a less impressive one than production. The negative social impact of the pandemic is still
severe. In industries such as accommodation and restaurants employment took a drastic hit. Real wage
growth has been subdued in early 2021. Whereas money supply has significantly increased since the
second half of 2020 thanks to accommodative central bank policies and a higher saving ratio, loan growth
has been sluggish in most CAREC economies. Non-performing loans have not increased drastically in most
CAREC economies. However, there was an increase in the Kyrgyz Republic and in Mongolia from already
rather high levels. In other CAREC economies banks’ asset quality might deteriorate too after the phasing
out of the authorities’ support measures and the re-tightening of risk assessment rules.

Investment still needs to recover, growth rates were still negative in several CAREC economies in early
2021. Investment recovery depends even more than the rest of the economy on overcoming the
uncertainties related to the pandemic. Governments should encourage investment especially now by
further improving the business climate and easing doing business by advancing e-government and
simplifying regulations. At the same time, a special focus should be given to greening projects,
digitalization, but also projects in the services sector, including in health, education, and tourism.
Opportunities for launching such projects involving more than one CAREC country should be explored.

To avoid a highly diverging speed of recovery for different sectors of the economy and for different parts
of the population, and leaving behind substantial parts of businesses and the population, policy measures
in support of the economy and households must be reduced carefully and selectively. Our previous CAREC
Quarterly Economic Monitor showed that some fiscal space for maneuver is left in most CAREC
economies. This issue of the Monitor shows that given loan growth is rather weak, exchange rates are
reasonably stable, and inflation has accelerated only moderately, monetary policy could also remain
supportive for some time where needed. Economic policies must be calibrated carefully to support the
upswing while not jeopardizing future fiscal and monetary sustainability. At the same time plans must be
concretized how to build forward better, especially how to accelerate the green and digital transitions.

Proper public health measures remain key for a fast recovery, especially progress in COVID-19 vaccination.
The relaxing of containment measures must be aligned with success in fighting the pandemic. The
correlation between high-frequency output and demand indicators and mobility indicators reflecting
containment measures has weakened in 2021, but a severe resurgence of the pandemic and resulting
renewed quarantine requirements would certainly derail the nascent recovery.

        Recovery, but some CAREC economies still experienced negative growth in Q1

After the sharp downturn in 2020, CAREC economies are on the way to recovery. Average real GDP
growth for the CAREC region accelerated to plus 2.9% year-on-year in Q1 2021 from minus 0.8% year-on-
year in Q4 2020 (Figure 1). The International Monetary Fund, the World Bank, and the Asian Development

CAREC Institute Quarterly Economic Monitor ∣ June 2021                                       Page 6 of 38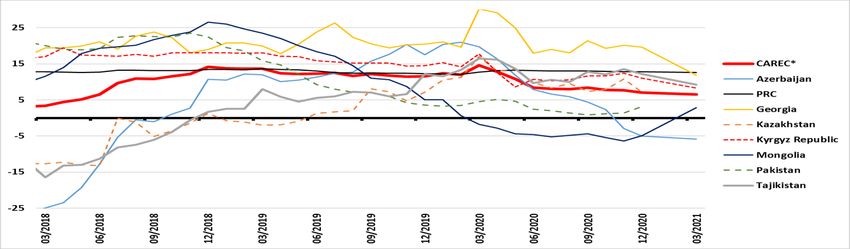
Bank forecast an acceleration of GDP1 growth in 2021 for all CAREC economies except Afghanistan and
Turkmenistan (Table 1). They forecast a further acceleration in 2022 except for the PRC because of the
PRC’s extraordinary high rate in 2021. This is in line with recent developments, but to achieve the
envisioned growth CAREC economies will have to avoid setbacks due to a resurgence of the COVID-19
pandemic.
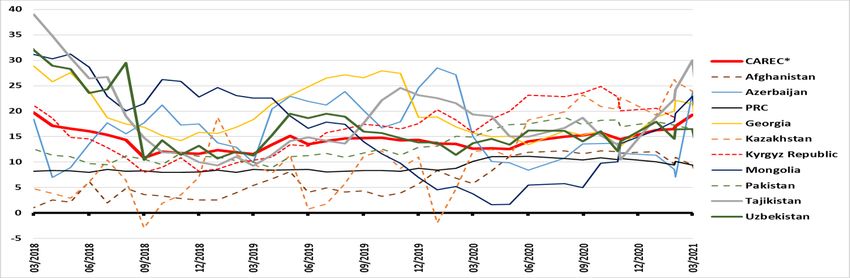
Figure 1. Real GDP growth (%, yoy)
18
15
12 CAREC*
9 Azerbaijan
6 PRC
3 Georgia
Kazakhstan
0
Kyrgyz Republic
-3
Mongolia
-6
Pakistan
-9 Tajikistan
-12 Uzbekistan
-15
Q2/2020
Q1/2018
Q2/2018
Q3/2018
Q4/2018
Q1/2019
Q2/2019
Q3/2019
Q4/2019
Q1/2020
Q3/2020
Q4/2020
Q1/2021
*Refers to the simple average of CAREC economies where data are available.
Source: CEIC. Authors’ calculations.
Table 1. Real GDP growth forecasts (%, yoy)
2020 2021F 2022F 2021F 2022F
Average ADB, IMF and ADB IMF WB ADB IMF WB
WB
Afghanistan 3.9 2.7 3.6 3.0 4.0 1.0 4.0 4.2 2.6
Azerbaijan -4.3 2.3 2.7 1.9 2.3 2.8 2.5 1.7 3.9
PRC 2.3 8.3 5.5 8.1 8.4 8.5 5.5 5.6 5.4
Georgia -6.1 4.3 5.6 3.5 3.5 6.0 6.0 5.8 5.0
Kazakhstan -2.6 3.2 3.7 3.2 3.2 3.2 3.5 4.0 3.7
Kyrgyz Republic -8.6 4.4 4.6 3.5 6.0 3.8 5.0 4.6 4.3
Mongolia -5.3 5.2 6.4 4.8 5.0 5.9 5.7 7.5 6.1
Pakistan 0.5 1.6 3.3 2.0 1.5 1.3 4.0 4.0 2.0
Tajikistan 4.5 5.1 5.2 5.0 5.0 5.3 5.5 4.5 5.6
Turkmenistan 5.9 4.7 4.4 4.8 4.6 4.9 3.9
Uzbekistan 1.6 4.6 5.3 4.0 5.0 4.8 5.0 5.3 5.5
Source: Asian Development Bank. Asian Development Outlook, Financing A Green and Inclusive Recovery, April
2021; International Monetary Fund. World Economic Outlook: Managing Divergent Recoveries, April 2021;
International Monetary Fund. Regional economic outlook update. Middle East and Central Asia: Arising from the
Pandemic: Building Forward Better, April 2021; World Bank. Global Economic Prospects, June 2021.
1Gross domestic product (GDP) is the sum of value added in goods and services produced within a country’s borders in a
specific time period (most often, and also here, during a year. Real GDP is nominal GDP at constant prices.
CAREC Institute Quarterly Economic Monitor ∣ June 2021 Page 7 of 38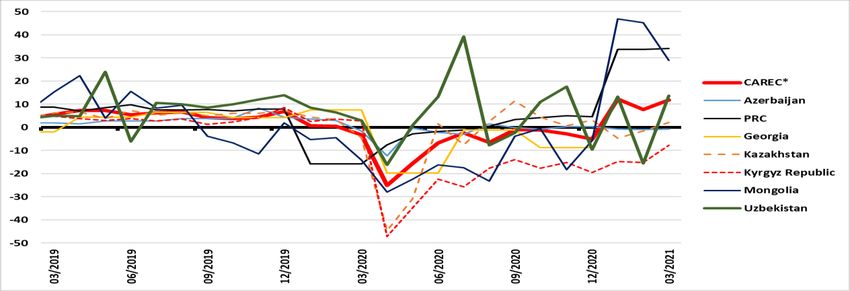
In the PRC and Mongolia, the upswing was very steep in Q1. In these countries real GDP growth
accelerated to 18.3% yoy and 15.7% yoy in Q1 2021, respectively, offsetting the deep declines in Q1 2020
(Table 2). Uzbekistan saw also significant yoy growth in Q1 2021 even though growth in Q1 2020 was still
strong there. However, Azerbaijan, Georgia and Kazakhstan still experienced negative growth rates of
1.3% yoy, 4.2% yoy and 1.6% yoy, respectively. The Kyrgyz Republic saw real GDP contraction to accelerate
to minus 9.4% yoy in Q1 from minus 6.2% yoy in Q4. Fast growth in the PRC and Mongolia, and quarter
by quarter improvements in most other CAREC economies, was made possible by successfully controlling
the COVID-19 pandemic in the PRC, better dealing with the pandemic, and adjusting to the pandemic in
other CAREC economies, and by higher oil, copper, and other commodity prices that have helped net
commodity exporters.

Table 2. Real GDP growth (%, yoy)
                      2019    2020                 2019                             2020                  2021    2021/
                                                                                                                 2019**
                                      Q1     Q2      Q3    Q4       Q1       Q2             Q3     Q4     Q1       Q1
 Afghanistan           1.2     3.9     -      -       -     -        -        -              -      -      -       -
 Azerbaijan            2.5     -4.3   4.6    4.0     2.3   -0.5     1.5      -3.4          -6.8    -6.7   -1.3    0.2
 PRC                   6.0     2.3    6.3    6.0     5.9   5.8      -6.8     3.2           4.9     6.5    18.3    10.3
 Georgia               5.0     -6.1   5.2    4.8     5.4   4.6      2.3     -13.2          -5.6    -6.8   -4.2    -2.0
 Kazakhstan            4.5     -2.6   3.7    4.4     5.0   4.9      2.4      -6.1          -5.2    -2.1   -1.6    0.8
 Kyrgyz Rep.           4.6     -8.6   8.5    4.2     1.8   -8.6     -3.3    -14.2          -10.5   -6.2   -9.4   -12.4
 Mongolia              5.2     -5.3   8.8    7.1     5.4   0.9     -10.7     -9.1          -3.1    -0.3   15.7    3.3
 Pakistan              1.0     0.5    1.5   -0.9     0.2   0.9      1.1      -3.8          3.1     1.7     -       -
 Tajikistan            7.5     4.5    7.5    7.5     6.8   6.6      7.0      0.0           5.6     5.4     -       -
 Turkmenistan          6.3     5.9     -      -       -     -        -        -              -      -      -       -
 Uzbekistan            5.8     1.6    5.7    6.0     5.9   5.8      4.6      0.4           0.8     1.6    3.0     7.7
 Average
                       4.3     -1.4   5.8    4.8     4.3   2.3      -0.2     -5.1          -1.9    -0.8   2.9     2.7
 CAREC***
* Some countries don’t provide quarterly data, but publish only on longer periods, e.g. Jan-Sep; the figures in this
   table are rough estimates by the authors how these data translate into quarterly numbers.
** Growth of Q1 2020 and Q1 2021 linked.
*** Simple average of CAREC economies where data are available.
Source: CEIC, authors’ calculations based on national statistical office data and news.

     The recovery is largely driven by manufacturing, growth in services is still rather weak

Agricultural production significantly increased from a year earlier in early 2021. Growth in agriculture
accelerated to 4% yoy in Q1 2021 from 1.7% yoy in Q4 2020 on average in the CAREC region (Figure 2). All
CAREC economies secured positive growth with the exception of Mongolia, which saw a decline by 10.4%
yoy in Q4 2020. The PRC achieved the highest growth at 11% yoy. However, for most countries the real
proof for agriculture will come only later in the year during the main months of harvests.

CAREC Institute Quarterly Economic Monitor ∣ June 2021                                                     Page 8 of 38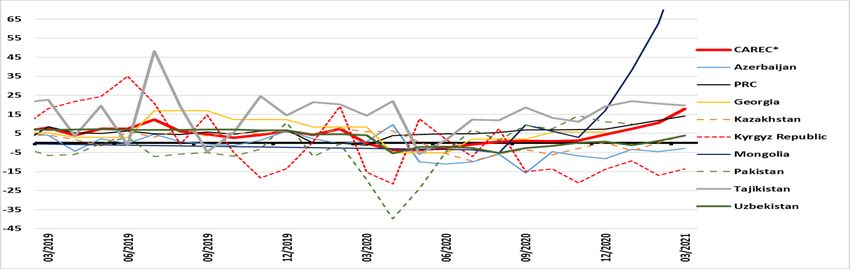
Figure 2. GDP: Agriculture (%, yoy)

Source: CEIC, authors’ calculations.

Recovery in industry was thanks to manufacturing whereas mining was still weak in most countries.
Growth in manufacturing was positive already in the second half of 2020 on average in CAREC and
accelerated to 6.4% yoy in Q1 2021 (Figure 3). The high Q1 figure was due to a surge in the PRC by 30%
yoy, and substantial growth in Mongolia, Kazakhstan, and Uzbekistan. Georgia and the Kyrgyz Republic
saw a decline by 3% yoy and 23% yoy, respectively.
In contrast to manufacturing, growth in mining still looks rather weak except for Mongolia (and
presumably Turkmenistan, judging from exports). It was negative in Q4 2020 in all CAREC economies with
available data other than Mongolia and continued to be so in Q1 2021 (Figure 4).

Services were severely buffeted by the COVID-19 pandemic. Growth in services remained negative in all
countries with data availability in Q4 2020, services’ value added decreased by 9.2% yoy on average in
CAREC (Figure 5). Azerbaijan, Georgia, Kazakhstan, the Kyrgyz Republic, and Mongolia, all experienced a
heavy yoy contractions in services in three quarters in 2020, beginning with Q2. According to latest data,
Mongolia saw some increase at 3.6% yoy in Q1 2021, whereas services continued to decline by 2.4% yoy
in Kazakhstan. However, the PRC saw the value added in transportation, storage and postal services and
that of real estate services grow by 32.1% yoy and 21.4% yoy respectively, with an average two-year
growth of 6.6% and 6.8% respectively, according to the National Bureau of Statistics of China.

Figure 3. GDP: Manufacturing (%, yoy)

CAREC Institute Quarterly Economic Monitor ∣ June 2021                                       Page 9 of 38
Figure 4. GDP: Mining and Quarrying (%, yoy)

Figure 5. GDP: Services (%, yoy)

Source: CEIC, authors’ calculations.

     Consumption and investment severely hit in 2020, and still need time to recover fully

Consumption growth is still volatile. Average CAREC household consumption growth turned positive in
nominal terms2 to 5.8% yoy in Q3 after falling severely in Q2 2020 but slowed again to 0.2% yoy in Q4
2020 (Figure 6). Azerbaijan, the Kyrgyz Republic, and Mongolia saw a decline in household consumption
still in Q4 2020, even not adjusting for inflation. In Mongolia, household consumption still declined in Q1
2021. The deep contraction in CAREC’s household consumption, especially in Q2 2020, was due to a
decline in household incomes and reduced mobility during the pandemic Difficulties to record/estimate
consumption properly due to the switching of households to e-commerce perhaps played a role too to
keep indicators low because some consumption might have been overlooked. On the other hand, there
might be some underestimation of the contraction in the informal sector. However, in the PRC per capita
consumption expenditures increased nominally by 17.6% yoy in Q1, according to the National Bureau of
Statistics of China.

2   For most CAREC economies data are readily available only in nominal terms, not deflated. Therefore, we can discuss in this
    chapter only nominal developments. However, we regard this as nevertheless useful for highlighting the swings on the
    demand side.

CAREC Institute Quarterly Economic Monitor ∣ June 2021                                                           Page 10 of 38
Figure 6. GDP by expenditure: Household consumption (%, yoy) Source: CEIC, national statistical office, authors’ calculations. Gross fixed capital formation was weak throughout 2020 in the CAREC region and remained rather weak also in Q1 2021. It contracted especially severely in the Kyrgyz Republic and in Mongolia (Figure 7). In Q4 2020, gross fixed capital formation remained 34% below previous year’s readings in the Kyrgyz Republic, and 24% in Mongolia. However, Mongolia saw some improvement in Q1 2021. In the PRC, investment in fixed assets (excluding rural households) was up by 25.6% yoy, and up by 2.9% from Q1 2019. Looking at a slightly different indicator, still common in the post-Soviet region, “investment in basic funds”3, reveals that investment growth was still negative in the countries for which this statistic is available for Q1 2021 (Figure 8). Figure 7. GDP by expenditure: Gross fixed capital formation (%, yoy) Source: CEIC, national statistical office, authors’ calculations. 3 The indicator reflects investment in fixed assets only of companies (in particular not in housing). CAREC Institute Quarterly Economic Monitor ∣ June 2021 Page 11 of 38
Figure 8. Investment in “basic funds” (fixed assets), early 2021 (%, yoy)
15
10
5
0
-5
-10
-15
-20
Azerbaijan Kazakhstan Kyrgyz Republic Uzbekistan
*Azerbaijan, the Kyrgyz Republic data refer to January-April 2021; Kazakhstan, Uzbekistan data refer to January-
March 2021
Source: National statistical offices, authors’ calculations
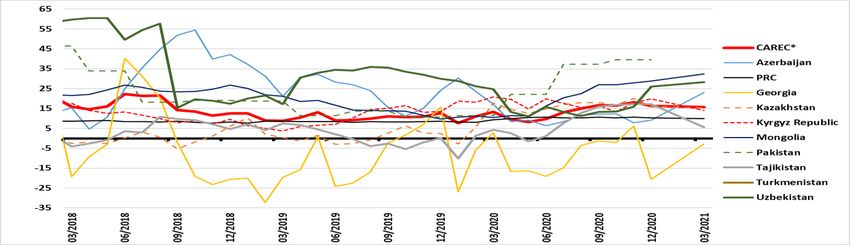
While growth in other components of GDP by expenditure was subdued in 2020, government spending
was substantially up. In Q4 2020, a quarter with a high share of expenditures from the annual budget in
many countries, government spending was 31% higher than a year earlier on average in CAREC (Figure 9).
The highest growth was observed in Azerbaijan, Kazakhstan, and Uzbekistan at 46% yoy, 45% yoy and 55%
yoy, respectively. The Kyrgyz Republic saw a more moderate growth by 7% yoy. After strong growth also
in Mongolia in Q4, the country cut government spending by 7% yoy in Q1 2021, from rather high growth
rates before though.
Figure 9. GDP by expenditure: Government spending (%, yoy)
Source: CEIC, national statistical office, authors’ calculations.
Lower wages and increasing unemployment
After a peak in early 2020, average CAREC real wage growth decelerated throughout 2020 and further
in 2021, thus contributing to consumption weakness. It turned from plus 9.0% yoy in January 2020 to
minus 1.5% yoy in March 2021, at least for the countries with already available data. Weak labor demand
along with slightly re-increasing inflation rates negatively affected real wage4 growth in almost all CAREC
economies in Q1 2021. The exception was Kazakhstan, which reported real wage growth of plus 2.6% yoy
in March 2021, after minus 3.0% yoy in December 2020, however (Figure 10). Azerbaijan saw the sharpest
swing from extraordinary high 24% yoy in early 2020 to minus 8% by March 2021. The Kyrgyz Republic
4 Real wage growth is nominal wage growth adjusted for the effects of inflation.
CAREC Institute Quarterly Economic Monitor ∣ June 2021 Page 12 of 38also experienced negative growth rates in Q1 2021. The downward path in Tajikistan, which began in late 2019 was reversed by some recovery in September-November 2020 but has been followed by stagnation since. Uzbekistan saw a deceleration too, although growth rates remained marginally positive. Figure 10. Real wage growth (%, yoy) *Refers to the simple average of CAREC economies where data are available. ** Real wages are estimated based on nominal wage and CPI. Source: CEIC, authors’ calculations. Data for 2020 indicate only a mild increase in unemployment, but these data hardly reveal the full picture. Azerbaijan saw an increase in the unemployment rate from 4.8% to 6.3%, Georgia from 17.6% to 18.5 % in 2020 after a decrease since 2010 (Figure 11). Unemployment rates rose only marginally to 4.9% and 4.4% in Kazakhstan and Pakistan, respectively. In most CAREC economies unemployment rates are based on registered unemployed persons. They do not fully reflect unemployment dynamics due to insufficiently developed active labor market policies and therefore little incentives to register. However, a survey among micro, small, and medium enterprises in four CAREC economies commissioned by the CAREC Institute and soon to be published, indicates that these enterprises indeed tried to keep their workforce and rather reduced working hours and wages, thus contributing to stabilizing employment. Official figures nevertheless probably underestimate the scale of unemployment. By December 2020, employment was below a year earlier in almost all countries for which data are available. Exception is Mongolia that indicated plus 1.8% yoy employment growth in December 2020. Services sectors such as trade, accommodation and food saw severe cuts in employment in several CAREC economies. In Georgia, the Kyrgyz Republic, and Mongolia employment in accommodation and food decreased by 35%, 21% and 28% yoy, respectively. Substantially lower employment in several sectors of the economy, especially hospitality, indicate that actual unemployment might be higher as is evident from unemployment rates5 (Figure 12). In addition, some share of returned labor migrants is likely swelling the number of the unemployed. 5Unemployment rate is the share of the labor force that is not currently employed but could be. This can refer to registered unemployed persons or to estimates of unemployment based on surveys. CAREC Institute Quarterly Economic Monitor ∣ June 2021 Page 13 of 38
Figure 11. Unemployment rates (annual, %)

*Refers to the simple average of CAREC economies where data are available.
** Values of right-hand side vertical axis refer to unemployment rates in Georgia.
Source: CEIC, authors’ calculations.

Figure 12. Employment by sectors (%, yoy)

*Uzbekistan data refer to the full year.
Source: CEIC, national statistical offices, authors’ calculations.

The adverse effects of the COVID-19 crisis on employment and incomes have re-increased the risk of
poverty. Almost all CAREC economies saw poverty rates falling until 2019. Afghanistan, Mongolia,
Tajikistan, Pakistan, and the Kyrgyz Republic, had nevertheless still levels above 20% in 2019 (Figure 13).
Poverty rates are not available yet for 2020, but recent analytical reports note an increase in the share of
populations endangered to fall into poverty6. The World Bank, for instance, estimates that the poverty
rate in the Kyrgyz Republic might have increased by 11 percentage points in 20207.

6 In the report published by the National Statistics Office of Mongolia (NSO) and the World Bank (2020) it is indicated that
  additional 15 percent of people of Mongolia remain vulnerable to falling into poverty. The National Statistics Office of
  Mongolia (NSO) and the World Bank (2020) “Mongolia Poverty Update”. Available at:
  https://www.1212.mn/BookLibraryDownload.ashx?url=Poverty_report_2018_ENG.pdf&ln=En (accessed 17 May 2021)
7 World Bank “One Year Later in the Kyrgyz Republic’s Battle Against COVID-19”. Available at:

  https://www.worldbank.org/en/news/feature/2021/03/17/one-year-later-in-the-kyrgyz-republic-s-battle-against-covid-19
  (accessed 15 May 2021)

CAREC Institute Quarterly Economic Monitor ∣ June 2021                                                         Page 14 of 38
Figure 13. Poverty headcount ratio at national poverty lines (% of population)
Source: Asian Development Bank, World Bank, national statistical offices, authors’ calculations.
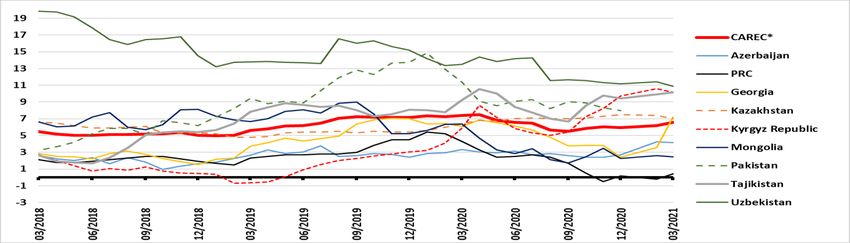
Higher money supply, but credit growth is still sluggish
Money supply has accelerated since mid-2020 thanks to accommodative central bank policies and, since
the second half of 2020, thanks to faster deposit growth. Broad money growth accelerated from 14%
yoy on average in CAREC in 2020 to 19% yoy by March 2021 (Figure 14)8. Countries with above average
expansion of money supply were Azerbaijan, Georgia, Kazakhstan, Mongolia, and Tajikistan. Deposit
growth varied among countries but was on average higher in the second half of 2020 than in the first half
of 2020 and in 2019 (Figure 15).
Figure 14. Money supply M2 (%, yoy)
*Refers to the simple average of CAREC economies where data are available.
Source: CEIC. Authors’ calculations.
8Broad money is a measure of the amount of money circulating in a national economy including both highly liquid "narrow
money" such as cash and sight deposits, and also less liquid forms such as term deposits.
CAREC Institute Quarterly Economic Monitor ∣ June 2021 Page 15 of 38Figure 15. Bank Deposits (%, yoy) *Refers to the simple average of CAREC economies where data are available. Source: CEIC. Authors’ calculations. In contrast to money supply, average CAREC loan growth slowed since mid-2020. In the PRC the increase in outstanding bank loans moderated only from 13.2% yoy in June 2020 to 12.3% yoy by April 2021, but some countries experienced a more pronounced deceleration (Figure 16). An exception is again Mongolia: after significantly negative growth rates in most of 2020, loan growth turned positive in March 2021. Figure 16. Bank loans (%, yoy) *Refers to the simple average of CAREC economies where data are available. Source: CEIC. Authors’ calculations. The average CAREC non-performing loans ratio was stable throughout 2020, with even a slight decline the last two quarters. However, developments differed in different countries. Azerbaijan and Kazakhstan saw a decline, whereas the Kyrgyz Republic, Mongolia, Pakistan, and Uzbekistan experienced increasing NPL ratios (Figure 17)9. Data for the first quarter 2021 indicate some further growth in NPLs in the Kyrgyz Republic to 11%, and in Uzbekistan to still rather moderate 3.6%. Mongolia’s NPL ratio slightly decreased in the first quarter of 2021 but is at 11.5% still rather high. Past assets quality reviews in Mongolia have still to bear fruit. While government-supported bad asset workout programs in the aftermath of the 2008- 2009 financial crisis in some countries have contributed to keep NPLs manageable, it remains to be seen how the difficulties caused by the COVID-19 pandemic will impact NPL ratios after government support measures for companies and households will be phased out, and classification procedures will be re- tightened. 9A nonperforming loan (NPL) is a loan on which the borrower has not made payments of principal or interest as scheduled for some time, in most definitions more than 90 days. CAREC Institute Quarterly Economic Monitor ∣ June 2021 Page 16 of 38
Figure 17. Non-performing loans (as % total loans)
*Refers to the simple average of CAREC economies where data are available.
Source: CEIC. Authors’ calculations.
Exchange rates remained relatively stable during the pandemic
Despite increased money supply, exchange rates have depreciated mostly only moderately since the
begin of the pandemic, in part because of central bank support and regulation. The CNY has re-
appreciated since mid-2020 in line with the PRC’s export boom. There was also a slight appreciation in
Kazakhstan, Pakistan, and Uzbekistan in early 2021, whereas the PRC, Georgia and the Kyrgyz Republic
saw a slight deprecation. Azerbaijan and Turkmenistan preserved their fixed exchange rate regimes
(Figure 18).
Figure 18. Exchange rates (USD/national currency, 3-2018=1.00)
*Refers to the simple average of CAREC economies where data are available.
Source: CEIC. Authors’ calculations.
Exchange rate stability has been supported by contained dollarization. High dollarization reflects
potential exchange rates risks and is often the only hedge against depreciation available in CAREC
economies. It limits the effectiveness of monetary policy and must be considered when central banks
design their policies. Despite heightened economic risks, there was no flight to the dollar, at least not in
domestic dollar deposits. The share of foreign exchange in bank deposits has remained stable or even
declined in most CAREC economies (Figure 19). However, dollarization is still high in Azerbaijan and
Georgia. It might be higher also in other countries than official figures suggest because of the dollar’s role
in the informal economy. At the early stages of the pandemic also some dollar outflows from some CAREC
economies were registered.
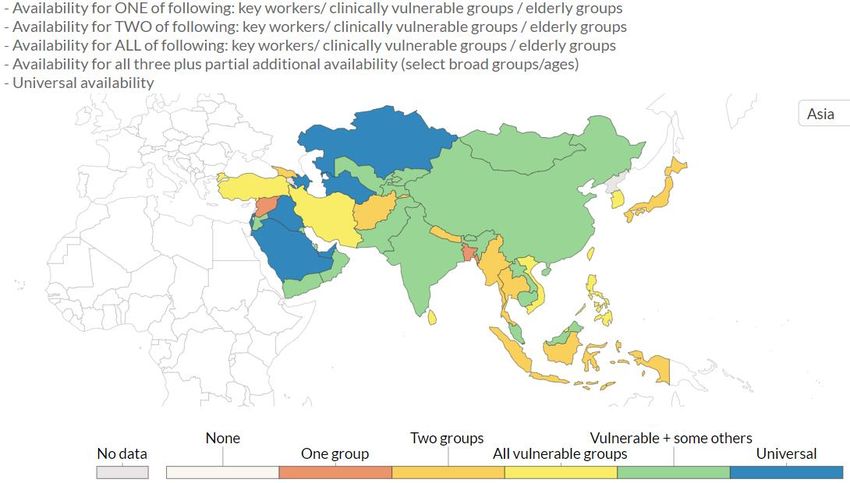
CAREC Institute Quarterly Economic Monitor ∣ June 2021 Page 17 of 38Figure 19. Share of foreign exchange in deposits (%) *Refers to the simple average of CAREC economies where data are available. Source: CEIC. Authors’ calculations. High-frequency indicators: export-driven recovery in industrial output, retail sales volatile After volatile, but generally highly negative readings in 2020, CAREC exports recovered in Q1 2021. Exports were still by 11% lower in USD terms than the year before in December 2020 on average in CAREC, but regained momentum in 2021 to reach 53% yoy growth in March (Figure 20). This was enough to make export growth positive also compared to March 2019. Exports of the PRC surged in early 2021 to 155% yoy in February, including exports of pandemic-related goods such as masks. Countries with a very high share of exports going to the PRC such as Mongolia and Turkmenistan experienced strong export growth already since January 2021. Export growth of other CAREC economies remained subdued until February 2021. However, by March 2021 all CAREC economies except Kazakhstan, with a large share of exports going to Europe, announced positive growth rates. Figure 20. Export (USD based, FOB, %, yoy) *Refers to the simple average of CAREC economies where data are available. Source: CEIC, authors’ calculations. With consumption and production recovering, also import growth turned positive from February 2021 on. It reached 36% yoy in March 2021 on average in CAREC (Figure 21). Imports increased in most CAREC economies, but especially strongly in the PRC, Kazakhstan, Mongolia, and Pakistan with growth in March reaching 37%, 41%, 46% and 69% yoy, respectively. In most CAREC economies imports were higher in March 2021 than in March 2019. Most likely CAREC imports will surpass pre-COVID-19 levels during the rest of 2021. CAREC Institute Quarterly Economic Monitor ∣ June 2021 Page 18 of 38
Figure 21. Import (USD based, CIF, %, yoy)

*Refers to the simple average of CAREC economies where data are available.
Source: CEIC, authors’ calculations.

It remains to be seen how stronger import growth will affect trade balances in the longer term10. Trade
deficits in % of GDP have not changed very much compared to 2019 on average in CAREC, or even
narrowed temporarily a bit (Figure 22). A lot will depend on the further development of fuel and metal
prices, with net fuel and metal exporters profiting from high prices, net importers experiencing terms of
trade losses. The April 2021 issue of the World Bank’s pink sheets forecasts energy prices to remain
elevated in the coming years, and metals to decline somewhat from 2021 levels, but remain significantly
above 2019 and 2020 levels11.

Figure 22. Trade balance (USD based, monthly data in % of full-year GDP)

*Refers to the simple average of CAREC economies where data are available.
Source: CEIC, authors’ calculations.

To a large part thanks to export growth, also CAREC industrial production strongly recovered in the first
quarter of 2021. Growth reached 17% yoy in March 2021 on average in CAREC (Figure 23). In March 2021
industrial output growth reached 14% yoy in the PRC, 20% yoy in Tajikistan. It reached astonishing growth
of 100.3% yoy in Mongolia, with growth of 156% in mining and 47% in manufacturing. The mining boom
was related to the export surge that reached 93% yoy in March. However, in Azerbaijan and the Kyrgyz
Republic, industrial output continued the decline that began in mid-2020 in these countries with a
contraction in March 2021 by 2.8% yoy and 13.7% yoy, respectively. In Kazakhstan and Uzbekistan

10   The trade balance is the difference between the value of a country's exports and imports.
11   https://thedocs.worldbank.org/en/doc/c5de1ea3b3276cf54e7a1dff4e95362b-0350012021/original/CMO-April-2021.pdf

CAREC Institute Quarterly Economic Monitor ∣ June 2021                                                Page 19 of 38
industrial output growth was at 4.0% yoy and 3.8% yoy still rather moderate by March. With the exception
of the Kyrgyz Republic and Azerbaijan, industrial output was higher in March 2021 than in March 2019 for
the countries with available data.

Figure 23. Industrial output (%, yoy)

*Refers to the simple average of CAREC economies where data are available.
Source: CEIC. Authors’ calculations.

The contraction in consumption as captured by retail sales has eased since mid-2020 and consumption
growth turned positive in Q1 2021. However, there was some volatility. Only in the PRC and in Mongolia
retails sales were constantly higher than the year before throughout Q1 (Figure 24). Kazakhstan saw some
decline in January and February, and a rather weak recovery to only plus 2.2% yoy in March. Retail sales
in Uzbekistan were also volatile, up by 13.3% yoy in January, down by 16% yoy in February, then
recovering to plus 13.7 % yoy in March. The Kyrgyz Republic continued to experience a decline in all
months of Q1 and was 8% in minus yoy in March. Retail sales were higher in March 2021 than in March
2019 in the PRC, Mongolia and Uzbekistan, but in other countries the trend is less clear yet. Retail sales
severely contracted in April and May 2020 in CAREC, and it will be interesting to watch where April, May
2021 data will leave consumption levels relative to 2019.

Figure 24. Retail sales (%, yoy)

*Refers to the simple average of CAREC economies where data are available.
Source: CEIC. Authors’ calculations.

Inflation re-accelerated in Q1 2021, moderately though. Average CAREC consumer price inflation
increased from 5.9% in December 2020 to 6.6% in March 2021. All CAREC economies saw inflation
accelerate since January 2021, though at different speed. Between December 2020 and March 2021, the
inflation rate rose from 2.7% to 4.2% in Azerbaijan, from 2.4% to 7.2% in Georgia, from 9.7% to 10.2% in
the Kyrgyz Republic, and from 9.4% to 10.1% in Tajikistan (Figure 25). However, on average inflation is still

CAREC Institute Quarterly Economic Monitor ∣ June 2021                                        Page 20 of 38
below the reading of early 2020. It remains to be seen how strong the pass-through from the current
increase in global inflation will be.

Figure 25. Inflation: Consumer price index12 (%, yoy)

*Refers to the simple average of CAREC economies where data are available.
Source: CEIC. Authors’ calculations.

     Prospects depend on the global economy, but overcoming COVID-19 at home remains key

After the rebound in social and economic activity until March 2021, some volatility was seen since April
2021. Google’s mobility for “Retail and recreation” (Figure 26) and “Workplaces” (Figure 27) indicators
had a trough in CAREC in January 2021 at minus 18% and minus 22% compared to the baseline,
respectively, but reached plus 5.4%, and minus 4.8% in March 2021. However, both mobility types
renewed their fall in April to recover again in May.

Figure 26. Google COVID-19 community mobility: Retail & Recreation

      40
                                                                                                                                                                            CAREC*
      20
                                                                                                                                                                            Afghanistan
       0                                                                                                                                                                    Georgia

      -20                                                                                                                                                                   Kazakhstan
                                                                                                                                                                            Kyrgyz Republic
      -40
                                                                                                                                                                            Mongolia
      -60
                                                                                                                                                                            Pakistan
      -80                                                                                                                                                                   Tajikistan
            02/2020

                      03/2020

                                04/2020

                                          05/2020

                                                    06/2020

                                                              07/2020

                                                                        08/2020

                                                                                  09/2020

                                                                                            10/2020

                                                                                                      11/2020

                                                                                                                12/2020

                                                                                                                          01/2021

                                                                                                                                    02/2021

                                                                                                                                              03/2021

                                                                                                                                                        04/2021

                                                                                                                                                                  05/2021

*Refers to the simple average of CAREC economies where data are available.
Source: “Google COVID-19 Mobility Reports” (accessed 10 May 2021); authors’ calculations.

12The consumer price index (CPI) measures the cost of goods and services in a basket reflecting the purchased of the average
consumer.

CAREC Institute Quarterly Economic Monitor ∣ June 2021                                                                                                                           Page 21 of 38
Figure 27. Google COVID-19 community mobility: Workplaces
25
15
CAREC*
5
Afghanistan
-5
Georgia
-15
-25 Kazakhstan
-35 Kyrgyz Republic
-45 Mongolia
-55 Pakistan
-65
Tajikistan
02/2020
03/2020
04/2020
05/2020
06/2020
07/2020
08/2020
09/2020
10/2020
11/2020
12/2020
01/2021
02/2021
03/2021
04/2021
05/2021
*Refers to the simple average of CAREC economies where data are available.
Source: “Google COVID-19 Mobility Reports” (accessed 10 May 2021); authors’ calculations.
For the sustained revival of the CAREC economies the pandemic must be overcome. The correlation
between the mobility indicators and industrial production and retail sales has weakened since Q4 2020
(Figure 28). It is nevertheless obvious that a severe resurgence of the pandemic would again affect both
consumption and production highly negatively. The pandemic must be overcome to make the recovery
sustainable and a basis for building forward even better.
Figure 28. Google mobility reports, retail sales and industrial output in CAREC
20
10
0
-10 Retail & Recreation*
-20 Workplaces*
-30 Retail sales (%, yoy)
Industrial output (%, yoy)
-40
-50
02/2020
03/2020
04/2020
05/2020
06/2020
07/2020
08/2020
09/2020
10/2020
11/2020
12/2020
01/2021
02/2021
03/2021
04/2021
05/2021
*Refers to the simple average of CAREC economies where data are available.
Source: “Google COVID-19 Mobility Reports” (accessed 10 May 2021); CEIC, authors’ calculations.
VACCINATION PROGRESS IN THE CAREC REGION
Metrics reflecting the daily new confirmed COVID-19 cases of the CAREC region resemble a roller
coaster. Since mid-March 2021, most CAREC economies have gone through a third wave of the COVID-19
pandemic and the number of new infections surged up substantially. Mongolia registered another record
high of 404 new confirmed cases per million people solely on 7 June, slightly below the overall peak in
April 2021. Other countries such as Georgia, Kazakhstan and Azerbaijan have also seen a significant rise
of new cases over the past two or three months (Figure 29).
CAREC Institute Quarterly Economic Monitor ∣ June 2021 Page 22 of 38Figure 29. Daily new confirmed COVID-19 cases per mIn people (as of 9 June 2021) Note: Shown is the rolling 7-day average. The number of confirmed cases is lower than the number of actual cases; the main reason for that is limited testing. Source: Our World in Data: Coronavirus (COVID-19) Cases (accessed 10 June 2021) There is still a shortage of vaccines globally, but the number of available vaccines has increased. According to the World Health Organization (WHO), there are 185 COVID-19 vaccine candidates in preclinical development and 102 in clinical development at present13 (Figure 30). Among them, vaccines from AstraZeneca/Oxford, Moderna, Pfizer/BioNTech, Sinovac and CanSino have moved to the phase 4 trials14. To make vaccines available as rapidly as possible to address the health crisis, the WHO has listed five COVID-19 vaccines approved earlier for emergency use, namely, Pfizer/BioNTech, Janssen (Johnson & Johnson), Moderna and two AstraZeneca/Oxford vaccines 15 . Recent additions to the list are two Chinese-made inactivated vaccines by Sinopharm16 and Sinovac17, respectively. Despite various vaccines for countries to procure, the provision of overall COVID-19 jabs is still far from enough. According to the United Nations International Children's Emergency Fund (UNICEF), COVAX was 140 million doses short of its target by the end of May and will be 190 million doses short by the end of June18. However, the situation is improving, though still not sufficiently, due to more pledges by countries to share vaccines. "The addition expands the list of COVID-19 vaccines that COVAX19 can buy, and gives countries confidence to expedite their own regulatory approval, and to import and administer a vaccine." said Dr Tedros Adhanom Ghebreyesus, WHO Director-General20. 13 https://www.who.int/publications/m/item/draft-landscape-of-covid-19-candidate-vaccines 14 Clinical trials on the COVID-19 vaccine take place across four phases. Phase 1 trials assess the vaccine’s safety, appropriate dosages, and side effects within small groups of people (approx. 20-50 people). Phase 2 trials further explore safety and start to investigate efficacy on several hundred people. Phase 3 trials involve thousands of people to confirm that the vaccine is safe and effective for broader use. Phase 4 trials, conducted after national regulatory approval, involve further monitoring on the vaccine’s efficacy and safety in an even wider population over a longer timeframe. 15 AstraZeneca/Oxford vaccines refer to vaccines produced by AstraZeneca-SKBio (Republic of Korea) and the Serum Institute of India. 16 https://reliefweb.int/report/world/who-lists-additional-covid-19-vaccine-emergency-use-and-issues-interim-policy 17 https://www.who.int/news/item/01-06-2021-who-validates-sinovac-covid-19-vaccine-for-emergency-use-and-issues-interim- policy-recommendations 18 http://finance.sina.com.cn/chanjing/cyxw/2021-05-17/doc-ikmyaawc5784090.shtml 19 COVAX is co-led by the Coalition for Epidemic Preparedness Innovations (CEPI), Gavi and the World Health Organization (WHO), alongside key delivery partner UNICEF. Its aim is to accelerate the development and manufacture of COVID-19 vaccines, and to guarantee fair and equitable access for every country in the world. 20 https://global.chinadaily.com.cn/a/202105/10/WS609869eca31024ad0babccd2.html CAREC Institute Quarterly Economic Monitor ∣ June 2021 Page 23 of 38
Figure 30. COVID-19 vaccine development (as of 8 June 2021)
                                                                       Preclinical       Clinical

                                                  185                                                                            102

     0                   50                             100                          150                         200                      250
                                                                     Number of vaccines

Source: World Health Organization: Draft landscape and tracker of COVID-19 candidate vaccines (accessed 11 June
2021)

In the CAREC region, most member countries have secured doses from more than one source. Pakistan,
for example, ordered doses from five vaccine suppliers, namely, from CanSino, AstraZeneca/Oxford,
Sinopharm/Beijing, Sinovac and Sputnik V, followed by the PRC, Mongolia, and Turkmenistan from four
suppliers. In contrast, Georgia and Tajikistan currently are vaccinating their population only by
AstraZeneca/Oxford vaccines (Table 3).

Table 3. Vaccine status in the CAREC economies
         Country                                Vaccines                                        Last observation date                   Source
Afghanistan              AstraZeneca/Oxford, Pfizer/BioNTech, Sinopharm/Beijing                       2021/6/8                           WHO
Azerbaijan                       AstraZeneca/Oxford, Sinovac, Sputnik V                               2021/6/9                Government of Azerbaijan
PRC                      Sinopharm/Beijing, Sinopharm/Wuhan, Sinovac, CanSino                         2021/6/9               National Health Commission
Georgia                                    AstraZeneca/Oxford                                         2021/6/9                  Government of Georgia
Kazakhstan                       Sinopharm/HayatVax, Sputnik V, QazVac                                2021/6/9                Government of Kazakhstan
Kyrgyz Republic                       Sinopharm/Beijing, Sputnik V                                    2021/6/9                     Ministry of Health
Mongolia            AstraZeneca/Oxford, Pfizer/BioNTech, Sinopharm/Beijing, Sputnik V                 2021/6/8               Ministry of Health via ikon.mn
Pakistan            CanSino, AstraZeneca/Oxford, Sinopharm/Beijing, Sinovac, Sputnik V                2021/6/9          National Command and Operation Centre
Tajikistan                                 AstraZeneca/Oxford                                        2021/5/30                           WHO
Turkmenistan         EpiVacCorona, AstraZeneca/Oxford, Sinopharm/Beijing, Sputnik V                   2021/4/4                           WHO
Uzbekistan                      AstraZeneca/Oxford, RBD-Dimer, Sputnik V                              2021/6/1                Government of Uzbekistan
Source: Our World in Data: Coronavirus (COVID-19) Vaccines (accessed 11 June 2021)

The CAREC economies gave themselves ambitious targets for the speed of vaccination, but most have
still to catch up. Mongolia and Afghanistan aim to vaccinate at least 60% of their population by end-June
2021 and by 2022, respectively. The PRC plans to immunize 70-80% of its population by the end of 2021/
beginning of 2022 as it continues to make its vaccines available to other countries. Kazakhstan plans to
vaccinate 10 million people (over 50% of its population) free of charge by September 2021. Pakistan is
ramping up to vaccinate 70 million people by the end of 202121. Despite these solid resolves, many CAREC
economies are lagging the average world vaccination pace measured by the share of people that received
at least one dose of COVID-19 vaccine. Among them, the Kyrgyz Republic, Afghanistan, and Tajikistan had
less than 2% of their population vaccinated by at least one dose (Figure 31). By contrast, Azerbaijan and
Kazakhstan moved faster than the world average, covering 16.6% and 12.4% of their population,
respectively. Mongolia impressively performed the best in the CAREC region with almost 60% of its
population vaccinated by at least one dose.

21   https://www.imf.org/en/Topics/imf-and-covid19/Policy-Responses-to-COVID-19#P

CAREC Institute Quarterly Economic Monitor ∣ June 2021                                                                                          Page 24 of 38
Vaccine shortage is still one of the main reasons holding back vaccination campaigns currently. To fill the gap between supply and demand of COVID-19 vaccines, the CAREC economies should continue to negotiate with WHO, COVAX and other international organizations/pharmaceutical companies to acquire more vaccines. Meanwhile, to enhance production capacity and reduce transaction costs, the countries with advanced medical equipment can invest and produce their own vaccines. Pakistan, for example, recently successfully manufactured a COVID vaccine locally at the National Institute of Health (NIH) Islamabad with the help of the Chinese pharmaceutical company CanSino 22. Figure 31. Share of persons who received at least one dose of COVID-19 vaccine in the total population (as of 9 June 2021) Source: Our World in Data: Coronavirus (COVID-19) Vaccines (accessed 11 June 2021) In view of the limited provision of COVID-19 doses, most countries in the world mapped out government policies and prioritized the distribution of doses to certain groups of people. Figure 32 shows the vaccination policies adopted by Asian countries. In the CAREC region, Azerbaijan, Kazakhstan and Turkmenistan are taking a universal approach and making doses available for all groups of people. The PRC, the Kyrgyz Republic, Mongolia, Pakistan, Tajikistan, and Uzbekistan give vaccination priority to key workers, clinically vulnerable people, and elderly groups, plus some specific groups of people in case of the additional availability of doses. Afghanistan and Georgia still limit the scope only to key workers and clinically vulnerable persons. 22 https://arynews.tv/en/covid-vaccine-pakistan-manufactures-locally/ CAREC Institute Quarterly Economic Monitor ∣ June 2021 Page 25 of 38
Figure 32. COVID-19 vaccination policy: vaccine delivery for different groups (as of 9 June 2021)

Source: Our World in Data: Coronavirus (COVID-19) Vaccines (accessed 11 June 2021)

                                              CONCLUSIONS

The CAREC region has begun to recover, but challenges remain. The recovery differs for industries and
countries. Some parts of the population have remained in difficult circumstances or are highly vulnerable.
The phasing out of support measures must be careful and selective. There is some monetary and fiscal
space left, although countries must also keep sustainability in mind. Investment is still rather weak. The
investment climate should be made conducive especially now. Particularly investment that helps “build
forward better” should be encouraged. The CAREC region has big potential, but also needs related to
greening, digitalization, and other types of advanced technology. Overcoming the COVID-19 pandemic
remains key for saving lives, returning to normality, and for sustained economic recovery.

While the global infection and death rates are falling, the COVID-19 pandemic is not over unless a high
share of population globally gets vaccinated, and some herd immunity can be developed eventually.
Therefore, regional cooperation still significantly matters. Countries should continue to cooperate on the
development of vaccines, particularly in face of new strains of SARS-CoV-2. Besides, cooperation should
be enhanced for joint production of vaccines, joint establishment of medical lab, capacity building and
mutual recognition of health QR codes, and other measures to prevent and fight the pandemic.

CAREC Institute Quarterly Economic Monitor ∣ June 2021                                      Page 26 of 38
ANNEX 1: CAREC-COUNTRY POLICY RESPONSES TO COVID-19
Country Total Fiscal policy Monetary and macro- Exchange rate
package financial policy and BoPs
(USD, mln),
% of GDP
(2019)
Afghanistan 517.21 Providing free bread to the DAB postponing the IFRS 9 DAB focusing
(2.77%) poor (Apr.-Jun. 2020); implementation to Jun. 2021 on achieving
waiving electricity bills and and suspending administrative price stability
paying utility bills for penalties and fees; DAB in the context
vulnerable people in Kabul; ending the freeze on loan of a flexible
extending the tax filing classifications and exchange rate
deadline for Q1 2020 by 45 recommencing the regime; DAB
days; tax and customs enforcement of all prudential engaging
payment penalties waived requirements in Aug. 2020 money-service
with conditions. with flexible application of providers to
penalties and prudential ensure
triggers; emergency measures uninterrupted
for the nonbank sector services.
allowed to expire at end-Jul.
2020.
Azerbaijan 1,597.26 Increasing budget spending In Dec. 2020, CBA lowering Foreign
(3.75%) on public health by AzN0.37 the refinancing rate by 25 bp exchange
bln (0.5% of GDP) in 2020; to 6 ¼% and setting the floor auctions
paying allowances/benefits to of the interest rate corridor as conducted and
medical workers; one-year 5.75% and the ceiling as 6.75% all demands
exemption from land and after rounds of adjustment; for foreign
property tax to selected on 23 Apr. 2020, CBA currency
sectors; rental property tax in providing a relaxation of satisfied at the
the COVID-affected areas capital requirements and risk announced 1.7
reduced from 14% to 7%; weights on mortgage loans, a AzN/USD rate.
one-time extension of social moratorium on late fees and
assistance for vulnerable interest rate penalties,
people; 2021 budget guarantees on insurance
allocating another AzN261 premiums and suspension of
mln (0.3% of GDP) for inspections of credit
fighting the pandemic. institutions; In Jan. 2021,
inspections suspended
resumed, and additional
capital requirements for
consumer loans reinstated.
PRC 2,330,693.2 An estimated RMB4.9 trillion Liquidity injection into the Reserve
4 (or 4.7% of GDP) of banking system; expansion of requirement
(16.10%) discretionary fiscal measures re-lending/discounting on FX forward
announced; increasing facilities by RMB1.8 trillion to was reduced
spending on epidemic support businesses and to zero;
prevention and control; reduction of interest rates; restrictions on
production of medical reducing reverse repo rates, the
equipment; accelerating MLF rates and interest on investment
disbursement of excess reserves; expanding quota of
unemployment insurance and policy banks’ credit line to foreign
extension to migrant private firms and MSEs; institutional
workers; tax relief and introducing new instruments investors (QFII
waived social security to support lending to MSEs; and RQFII)
contributions; additional delay of loan payments, with removed and
CAREC Institute Quarterly Economic Monitor ∣ June 2021 Page 27 of 38You can also read