HIV in the United Kingdom: Towards Zero HIV transmissions by 2030 - 2019 report - GOV.UK
←
→
Page content transcription
If your browser does not render page correctly, please read the page content below
ri

     HIV in the United Kingdom:
     Towards Zero HIV transmissions by
     2030
     2019 report
     Data to end of December 2018

     To be read in conjunction with Appendix and National data tables
HIV in the United Kingdom: Towards Zero HIV transmissions by 2030 (2019 report – data to end 2018)
About Public Health England
Public Health England exists to protect and improve the nation’s health and wellbeing
and reduce health inequalities. We do this through world-leading science, research,
knowledge and intelligence, advocacy, partnerships and the delivery of specialist public
health services. We are an executive agency of the Department of Health and Social
Care, and a distinct delivery organisation with operational autonomy. We provide
government, local government, the NHS, Parliament, industry and the public with
evidence-based professional, scientific and delivery expertise and support.
Public Health England
Wellington House
133-155 Waterloo Road
London SE1 8UG
Tel: 020 7654 8000
www.gov.uk/phe
Twitter: @PHE_uk
Facebook: www.facebook.com/PublicHealthEngland
Prepared by: Charlotte O’Halloran, Suzy Sun, Sophie Nash, Alison Brown, Sara
Croxford, Nicky Connor, Ann K Sullivan, Valerie Delpech and O Noel Gill
For queries relating to this document, please contact: HARSQueries@phe.gov.uk
© Crown copyright 2019
You may re-use this information (excluding logos) free of charge in any format or
medium, under the terms of the Open Government Licence v3.0. To view this licence,
visit OGL. Where we have identified any third party copyright information you will need
to obtain permission from the copyright holders concerned.
Published December 2019
PHE publications PHE supports the UN
gateway number: GW-920 Sustainable Development Goals
2HIV in the United Kingdom: Towards Zero HIV transmissions by 2030 (2019 report – data to end 2018)
Acknowledgements
Contributors
Amina Addow, Adamma Aghaizu, Ryan Bennett, Paul Birrell, Gary Carpenter, Cuong
Chau, Joan Cruickshank, Beth Cullen, Maciej Czachorowski, Daniela De Angelis,
Claire Edmundson, Qudsia Enayat, Zoe Gibney, David Goldberg, Ana Harb, Ross
Harris, Ellen Heinsbroek, David Henderson, Gwenda Hughes, Georgina Ireland, Neil
Irvine, Carole Kelly, Jameel Khawam, Peter Kirwan, Linda Lazarus, Andy McAuley,
Madeleine McMahon, Hamish Mohammed, Gary Murphy, Joy Murphy, Emily Phipps,
Anne Presanis, Sonia Rafeeq, Claire Reynolds, Michael Reynolds, Kirsty Roy, John
Saunders, Ammi Shah, Ruth Simmons, Katy Sinka, Jennifer Tosswill, Jack Wardle,
Amanda Weir.
Suggested citation
O’Halloran C, Sun S, Nash S, Brown A, Croxford S, Connor N, Sullivan AK, Delpech V,
Gill ON. HIV in the United Kingdom: Towards Zero 2030. 2019 report. December 2019,
Public Health England, London.
3HIV in the United Kingdom: Towards Zero HIV transmissions by 2030 (2019 report – data to end 2018)
Contents
About Public Health England 1
Acknowledgements 3
Terminology 5
1. Summary findings 8
2. Key messages 13
3. Introduction 15
4. New HIV diagnoses, incidence and care 16
5. HIV testing 42
6. Clinical care and Treatment as Prevention (TasP) 65
7. Partner notification (PN) 72
8. Pre-exposure prophylaxis (PrEP) 74
9. Needle and syringe provision (NSP) for people who inject drugs (PWID) 78
10. Recommendations for the public 79
11. Appendix 83
References 84
This report is published alongside the online HIV data tables and the Sexual and
Reproductive Health Profiles released in September 2019i. The data tables provide
detailed breakdowns of national data for people newly diagnosed with HIV and people
accessing HIV care in the UK. The profiles include measures of HIV testing coverage,
repeat HIV testing, new HIV diagnosis, late HIV diagnosis, diagnosed HIV prevalence,
prompt antiretroviral treatment (ART) initiation and virological success.
The appendix to accompany this report can be found here:
www.gov.uk/government/publications/hiv-in-the-united-kingdom
iPlease note that new HIV diagnoses data were updated and republished on 1 October 2019 following a correction to the data
for a single locality
4HIV in the United Kingdom: Towards Zero HIV transmissions by 2030 (2019 report– data to end 2018)
Terminology
Combination HIV prevention: A mix of biomedical, behavioural and structural
interventions, prioritised to meet the current HIV prevention needs of particular
individuals and communities, so as to have the greatest sustained impact on reducing
new infections. Combination prevention programmes should be rights-based, evidence-
informed and community-owned (1).
Community HIV testing: HIV testing performed by community organisations (these are
outside the National Health Service or private clinics), which may involve different types
of specimen collection methods (for example point-of-care tests (POCTs) or specimen
collection as dried blood spot or capillary tube).
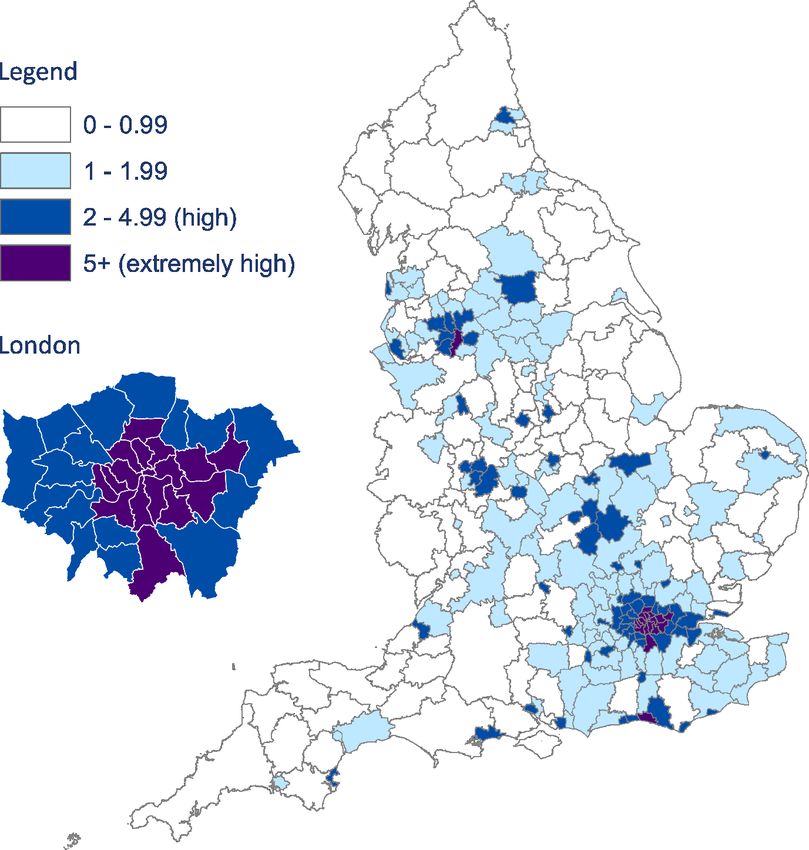
Diagnosed HIV prevalence bands are based on the number of people diagnosed with
HIV and accessing care at HIV outpatient clinics in a given year. They are expressed
per 1,000 residents aged 15 to 59 yearsii:
• low: HIV prevalence less than 2 in 1,000
• high: HIV prevalence between 2 and 5 in 1,000
• extremely high: HIV prevalence of 5 or more in 1,000
Gay and bisexual men (GBM): An inclusive term for gay, bisexual and other cis or
trans men who have sex with men.
Gender and gender identity: In this report, men and women are defined as cis and
trans adults aged 15 years and over who self-identify as a man or a woman. Due to
small numbers, persons who identify as non-binary or in another way are not shown in
binary gender breakdowns.
GUMCAD sexually transmitted infection (STI) surveillance system: A mandatory,
disaggregated, pseudo-anonymised data return submitted by all commissioned sexual
health services across England. The GUMCAD dataset includes information on all STI
diagnoses made and services provided alongside demographic characteristics for every
clinic attendance. The system enables the timely analysis and publication of routine STI
data, detailed analyses of risk groups and longitudinal analyses of clinic attendees.
Heterosexual men and women: Within the HIV testing section of this report, this refers
to people whose sexual orientation was reported as heterosexual at the time of their
HIV diagnosis/STI clinic attendance. These data come from the GUMCAD dataset
which collects sexuality and gender identity.
ii Diagnosed HIV prevalence bands for local authorities can be found at Sexual and Reproductive Health Profiles
5HIV in the United Kingdom: Towards Zero HIV transmissions by 2030 (2019 report – data to end 2018) HIV probably acquired heterosexually: Within the context of an HIV acquisition this refers to people who probably acquired their HIV infection through heterosexual sex (as opposed to how they identify sexually). This term is used in the new HIV diagnoses, incidence and people in HIV care and treatment sections of the report. HIV test coverage: The percentage of eligible sexual health service (SHS) attendees who had an HIV test. It is based on the number of attendees tested for HIV (and not the number of tests reported). Late HIV diagnosis: A person who has a CD4 cell count
HIV in the United Kingdom: Towards Zero HIV transmissions by 2030 (2019 report – data to end 2018)

Sexual health service (SHS) attendees eligible for HIV testing: These are attendees
at SHS not known to be HIV positive who should be offered HIV testing according to
current guidelines. They exclude persons for whom an HIV test was not appropriate, or
for whom the attendance was reported as being for reproductive healthcare only.

Treatment as Prevention (TasP): People with HIV are unable to pass on the infection
sexually if they are on treatment and have undetectable levels of the virus. This is also
referred to as Undetectable = Untransmittable (U=U).

Vertical transmission of HIV: Transmission of HIV from a mother to their child during
pregnancy, delivery or breastfeeding (also known as mother-to-child-transmission of
HIV).

Unprotected sex: HIV can be transmitted sexually if no protection is used and the
sexual partner with HIV has a detectable viral loadiv. Protective methods include
condom use, use of pre-exposure prophylaxis (PrEP) or use of ART to achieve an
undetectable viral load.

iv   Defined as having less than 200 copies per millilitre of blood

                                                                      7
HIV in the United Kingdom: Towards Zero HIV transmissions by 2030 (2019 report – data to end 2018)
1. Summary findings
New HIV diagnoses and incidence
After a peak of new HIV diagnoses in the United Kingdom in 2014, a rapid decline has
been observed from 6,278 in 2014 to 4,453 in 2018. This decline was particularly
marked among gay and bisexual men (GBM) in whom diagnoses fell by 35% from 3,480
in 2014 to 2,250 in 2018)v. The steepest fall was observed among GBM who are white,
born in the UK, aged 25 to 49 and residing in London.
The number of new HIV diagnoses in people who acquired HIV heterosexually has
almost halved over the past decade from 3,400 in 2009 to 1,940 in 2018v. The steepest
declines were in London residents, in those aged 25 to 34 years, in persons of black
African ethnicity and those born abroad. Nearly half of all adults diagnosed in 2018 who
acquired HIV heterosexually were born in a country of high HIV prevalence.
The fall in underlying incidence of HIV infection has continued. In GBM, the number of
incident infections has declined by 71%, from a peak of around 2,800 new infections
(95% credible interval (CrI) 2,600 to 3,000) in 2012 to 800 (CrI 500 to 1,400) in 2018.
The estimated number of newly acquired HIV infections among men who acquired HIV
heterosexually halved from 550 (CrI 400 to 650) in 2014 to 250 (CrI 150 to 350) in 2017.
Equivalent estimates for women who acquired HIV heterosexually were 450 (CrI 350 to
600) and 350 (CrI 250 to 450).
Prevalence of undiagnosed HIV infections and late diagnosis
In 2018, there were an estimated 7,500 (CrI 5,400 to 11,500) people living with an
undiagnosed HIV infection in the United Kingdom with 6,700 (CrI 4,900 to 10,100) in
England. The number of GBM living with undiagnosed HIV infection has halved since
2014 to 3,600 (CrI 2,800 to 4,800) in 2018.
Twice as many people with undiagnosed HIV infection in England lived outside of
London, 4,500 (CrI 3,000 to 7,500) compared to 2,100 (CrI 1,500 to 3,300) in London.
While credible intervals overlap, this was also the case for GBM, 1,100 (CrI 600 to
2,200) in London and 2,400 (CrI 1,100 to 5,100) outside London, and for heterosexual
men and women, 900 (CrI 700 to 1,500) in London and 2,000 (CrI 1,500 to 3,400)
outside London.
v After adjusting for missing exposure information
8HIV in the United Kingdom: Towards Zero HIV transmissions by 2030 (2019 report – data to end 2018)
The number of heterosexual black Africans in England who were unaware of their
infection continued to decline with an estimated 1,200 (CrI 900 to 1,600) in 2018, two-
thirds of whom were women, and three-quarters were outside London. An estimated
1,700 (CrI 1,100 to 3,500) heterosexual, non-black African adults in England were
unaware of their infection. One half were women (800 CrI 600 to 1,100) and two-thirds
lived in England outside of London (1,200 [CrI 800 to 2,600]).
There were an estimated 100 (CrI 30 to 400) people who inject drugs (PWID) living with
an undiagnosed HIV infection in the United Kingdom in 2018. Of those who participated
in the Unlinked Anonymous Monitoring (UAM) Survey of PWID, an estimated 1.2%
(95% confidence interval [CI] 0.8 to 1.7) were living with HIV and nearly all (96%) were
aware of their status.
The number of people diagnosed late decreased from 3,353 in 2009 to 1,883 in 2018 vi,
representing a 44% decline over the decade. Nevertheless, the proportion of late
diagnoses in 2018 remained high at 43%. There was substantial variation in sub-
populations experiencing late HIV diagnosis rates. The highest rates were among black
African men (65%), white men who acquired HIV heterosexually (59%), people aged
over 50 years (59%) and people who inject drugs (58%).
Quality of clinical care and Treatment as Prevention (TasP)
In 2018, the UK continued to exceed all of the UNAIDS 90:90:90 targets. Of the 103,800
people (CrI 101,600 to 107,800) living with HIV, 93% were diagnosed, 97% of people
diagnosed were receiving treatment and 97% of people receiving treatment were virally
suppressed.
In 2018, treatment coverage was 97% among those accessing HIV care. Excluding
those not linked to care, 78% of people newly diagnosed with HIV started treatment
within 91 days of diagnosis in 2018 compared to 53% in 2015. Younger people and
PWID were less likely to start treatment within 3 months of diagnosis.
Although retention in HIV care is high (98%), an estimated 1,800 people living with
diagnosed HIV infection were not seen for HIV care in 2018. This included 300 people
diagnosed in 2018 but not linked to HIV care and 1,500 people previously diagnosed
who were not recorded as accessing care for at least 18 months.
An estimated 13,100 to 15,600 people were living with transmittable levels of virus in
2018, equivalent to 13% to 15% of all people living with HIV. Overall 7,500 were
undiagnosed and up to 8,100 were people living with diagnosed HIV. Among those
diagnosed, 22% are either not linked or not retained in care, 34% are not treated and
43% have no evidence of viral suppression.
vi Adjusted for missing CD4 count information
9HIV in the United Kingdom: Towards Zero HIV transmissions by 2030 (2019 report – data to end 2018)
HIV Testing in specialist and non-specialist sexual health services (SHS)
Over 1.1 million attendees were tested for HIV in all SHS, an increase of 6% from 2017.
Due to the steady fall in the numbers of undiagnosed HIV infections, the number of tests
that are now needed to diagnose one new HIV infection has increased and the
proportion of tests that are positive has fallen. Overall test positivity declined from 0.2%
in 2017 to 0.1% in 2018. For heterosexual men and women, HIV test positivity remained
low at 0.1% and among black African heterosexual men and women it fell to 0.3% and
0.4% respectively. Test positivity among GBM has been steadily decreasing and is now
0.7%.
In SHS overall, HIV test coverage was 61% with 760,031 eligible attendees reported as
not tested for HIV. Although coverage was higher at specialist SHS than non-specialist
SHS, 71% (543,236) of the eligible attendees who were not tested for HIV had attended
specialist SHS, including 376,232 heterosexual women, 103,613 heterosexual men, and
15,417 GBM. Nearly half of the eligible specialist SHS attendees who were not tested
had not been offered an HIV test while the other half declined the test offer.
Specialist SHS HIV testing in rest of England compared to London
Specialist SHS outside London were less likely to offer HIV tests to eligible service
attendees than those in London (81% vs 88%) and across all exposure groups. As most
eligible attendees went to specialist SHS outside London, this meant that 80% of
specialist SHS attendees who were not offered an HIV test were seen at services
outside London. The difference was greatest for heterosexual women attendees, 88%
of whom were offered an HIV test in London compared to 79% outside London.
Coverage of HIV testing among black African and non-black African
heterosexuals
The largest group of eligible attendees who were not tested at specialist SHS were non-
black African heterosexual women attending services outside London. Over one quarter
of a million (273,562) of these women were not tested for HIV in 2018, accounting for
49% of all eligible attendees who were not tested at specialist SHS.
HIV test coverage among black African heterosexual men and women (83% and 65%)
was higher than among non-black African heterosexual men and women (77% and
56%). This was because 14% of black African heterosexuals declined a test offer
compared to 21% of non-black African heterosexuals.
10HIV in the United Kingdom: Towards Zero HIV transmissions by 2030 (2019 report – data to end 2018)
HIV testing of GBM
In 2018, 127,633 GBM were tested for HIV in SHS, a 9% increase from the previous
year. Test positivity among GBM has fallen to 0.7% from 0.9% in 2017. The proportion
of repeat testers (one or more HIV tests during the previous year at the same specialist
SHS) increased to 45% (compared to 42% in 2017). The positivity rate in repeat testers
also fell from 0.4% in 2017 to 0.3% in 2018.
In 2018, 46% of GBM testing in specialist SHS had not tested in the previous 2 years (at
the same service). These men made up 75% of HIV diagnoses made among GBM at
specialist SHS (1.3% positivity).
Less than half of GBM diagnosed with an anogenital bacterial STI in 2017, tested for
HIV at the same service in the following year. Test positivity within this group was 4.9%,
with one HIV infection diagnosed for every 21 men tested.
Other HIV testing services
Sentinel laboratory surveillance indicated that there was an increase in HIV testing in
general practices in extremely high prevalence areas from 129 tests per 10,000 in 2016
to 156 tests per 10,000 in 2018 with smaller increases in other prevalence areas. HIV
test positivity rates fell to 0.3% in extremely high prevalence areas, and 0.2% in
practices in both high and low prevalence areas. Sentinel laboratory surveillance
indicated that HIV test positivity was 0.7% in Accident and Emergency (A&E)
departments, and 0.5% in other secondary care settings.
In 2018/19, 57,635 people newly arriving into or transferring between prisons were
tested for HIV, an increase of 39% since 2017/18. Test coverage was 34% and test
positivity was 1.2%.
Over a quarter of a million HIV tests were performed, sold or distributed in community
and home settings in England. This included 138,453 eSexual Health Service and
127,083 other online or community-based tests. These comprised 24,113 self-sampling
test kits returned via the national HIV self-sampling service; 56,712 self-testing HIV kits
bought by individuals or distributed via retailers; and 46,258 HIV tests reported through
a survey of HIV testing in community settingsvii. Test reactivity was available for the
national HIV self-sampling scheme (0.5% high reactivity, 0.9% total reactivity) and for
the community HIV testing survey (0.4% overall reactivity).
vii
The Public Health England Community HIV Testing Survey is an annual national survey delivered to providers of HIV testing
in community settings, which helps to assess how well national recommendations on community HIV testing are being
implemented in England
11HIV in the United Kingdom: Towards Zero HIV transmissions by 2030 (2019 report – data to end 2018)
Partner notification (PN)
Partner notification is highly effective in diagnosing people who have HIV and
diagnosing HIV as promptly as possible (2). Of the 1,467 PN contacts who tested for
HIV in 2018, 57 new HIV diagnoses were made. This represents an overall HIV test
positivity among contacts of 3.9%, almost 24 times the overall test positivity for HIV
tests performed in specialist sexual health services (0.2%).
Pre-Exposure Prophylaxis (PrEP)
All UK countries have scaled up access to PrEP, with a national programme in
Scotland, a pilot programme in Wales, a 2-year project in Northern Ireland, and the
Impact Trial in England. By the end of 2018, it is estimated that between 13,000 and
19,500 persons, across the UK, predominantly GBM, were taking PrEP (with
approximately 13,000 on publicly funded trial/clinic PrEP and an additional 6,500 taking
PrEP through self-purchase).
Needle and Syringe Provision (NSP) for People who inject drugs (PWID)
Although the prevalence of HIV remains low, outbreaks of HIV among PWID continue to
occur, notably the ongoing incident in Glasgow. Around one in 5 PWID who injected in
the past 4 weeks reported sharing of needles or syringes, a significant source of risk for
bacterial infection and bloodborne virus (BBV) transmission. Needle and syringe
provision (NSP) in the UK is suboptimal and varies by geography; around 3 in 5 PWID
reported adequate provision in England, Wales and Northern Ireland in 2018 and
around 80% reported adequate provision in Scotland in 2017/18.
12HIV in the United Kingdom: Towards Zero HIV transmissions by 2030 (2019 report– data to end 2018)
2. Key messages
HIV prevalence, incidence and HIV care
There is evidence that combination prevention (including condom use, expanded HIV
testing, prompt ART and the availability of pre-exposure prophylaxis (PrEP)) is working
in the UK. For the third consecutive year, there have been steep declines in new
diagnoses in GBM – the group with the highest transmission rate. Further declines and
the possibility of eliminating transmission of HIV in the UK will depend upon sustained
prevention efforts and expansion to reach all.
HIV testing
As it becomes progressively more challenging to discover and care for those living with
undiagnosed HIV, it is essential that existing testing guidelines are fully implemented,
and that these policies are applied equally in all parts of the country.
Over half a million people (35% of those eligible for testing) were not tested for HIV
when they attended a specialist SHS in 2018. Specialist SHS should consider how they
can improve coverage to match the 99% achieved by antenatal screening services.
GBM who have had an anogenital bacterial STI within the last year have a high risk of
acquiring HIV. When attending specialist SHS, they and other men who are having
unprotected or casual sex with men, should be encouraged to have an HIV and STI
screen every 3 months.
GBM who have not tested within the last 2 years (at the same specialist SHS) were
more likely to test positive for HIV compared to GBM who tested more recently. Public
messaging should prompt them, and all men who have ever had sex with another man,
to test for HIV.
Full implementation of national HIV testing recommendations for areas of the country
where prevalence of diagnosed HIV infection is ‘high’ or ‘extremely high’, and among
high risk populations, is desirable. These recommendations include testing in a range of
settings such as hospitals, general practices, and the community and through online e-
services. These activities all continue to make HIV diagnoses and serve different
populations who might not access SHS.
The programme of BBV testing in prisons identifies infections among those who may
not access other testing services. The efforts to achieve the target testing threshold of
75% uptake are continuing.
13HIV in the United Kingdom: Towards Zero HIV transmissions by 2030 (2019 report – data to end 2018)
Clinical Care and Treatment as Prevention (TasP)
Providers of HIV care should encourage timely treatment initiation for people living with
HIV. The number and proportion of people who begin ART and achieve viral
suppression promptly following diagnosis is increasing. Further work is needed to
achieve equity between population sub-groups.
While HIV treatment and viral suppression rates are very high in the diagnosed
population, increased efforts are required to ensure those diagnosed are rapidly linked
to, and retained in HIV care. Services should have documented policies for managing
those who do not fully engage with care, and where possible provide arrangements to
address this.
Partner notification (PN)
As undiagnosed HIV infections become rarer, strengthening the delivery of effective PN
is essential to ending HIV transmission by 2030.
Pre-exposure Prophylaxis (PrEP)
PrEP services are in place in Scotland, Wales and Northern Ireland. The commitment to
routine commissioning of PrEP in England upon culmination of the Impact Trial in 2020
(3, 4) is critical and likely to lead to acceleration of the fall in HIV incidence, especially in
GBM. Public Health England is continuing to work closely with the Department of Health
and Social Care, NHS England and Improvement, local authorities and the Impact trial
team to plan for a seamless transition from the PrEP Trial to routine commissioning in
2020/21 (5).
Needle and Syringe Provision (NSP) for People who inject drugs (PWID)
Easily accessible harm reduction interventions for PWID, including access to sterile
injecting equipment via NSP and opioid substitution therapy (OST) needs to be provided
for all PWID, in line with national guidance (6-8).
14HIV in the United Kingdom: Towards Zero HIV transmissions by 2030 (2019 report– data to end 2018)
3. Introduction
Great progress has been made in the UK in the control and prevention of HIV. Two
years ago, the UK met the UNAIDS 90-90-90 target nationally with over 90% of people
living with HIV being diagnosed, over 90% of those diagnosed being on treatment and
over 90% of those on treatment having an undetectable viral load (9). Moreover, it is
also apparent that the underlying incidence of new HIV infections, particularly in GBM,
has been falling steadily for more than 5 years (10).
In 2016, London became the third city in the world to exceed the UNAIDS 90-90-90
target (11) and in 2018 was the first city to exceed the 95-95-95 target (12). Currently, 5
cities in the UK have joined the global fast-track cities initiative (13), where partner cities
commit to attaining the three 90 targets. Attainment of these 90-90-90 targets is the
start of the pathway towards achieving zero new HIV infections, zero HIV related deaths
and zero HIV-related stigma.
In January 2019, the Health and Social Care Secretary set the goal for England to
become one of the first countries to reach HIV elimination by 2030 (14). An Independent
HIV Commission was launched in July 2019 to develop evidence-based
recommendations to end HIV transmissions and HIV-attributed deaths within the next
10 years. The Commission’s recommendations will be reviewed by the Department of
Health and Social Care as part of its commitment to publish an action plan for
eliminating HIV transmission in England (15).
This report provides an overview of the HIV epidemic in the UK up until the end of 2018.
In advance of additional actions to get to zero HIV transmissions by 2030 (16), this
report also focuses on 5 strategies that are key to future HIV control and prevention:
• HIV testing policies
• Clinical Care and Treatment as Prevention (TasP)
• Notification of partners of persons newly diagnosed with HIV (Partner Notification)
• Pre-exposure prophylaxis (PrEP)
• HIV prevention services for people who inject drugs (PWID)
15HIV in the United Kingdom: Towards Zero HIV transmissions by 2030 (2019 report– data to end 2018)
4. New HIV diagnoses, incidence and care
4.1 New HIV diagnoses
In 2018, 4,453 people were newly diagnosed with HIV in the UK (3,266 men and 1,185
womenviii), with 21% (922) of these known to have had a previous HIV diagnosis outside
the UK. There were 225 people who were diagnosed with AIDS at HIV diagnosis and
473 people with diagnosed HIV who died from any cause in 2018 (Figure 1). Eleven
people diagnosed with HIV in 2018 identified differently to the gender they were
assigned at birth. Among new diagnoses, after adjusting for missing exposure
information and rounded, 51% (2,250/4,453) were reported among gay and bisexual
and other men who have sex with men (GBM), 19% (850/4,453) and 25% (1,090/4,453)
were among men and women respectively who reported heterosexual sex as their
probable route of infection and 2.5% (110/4,453) were among PWID. The remaining
140 new diagnoses were reported with other exposure routes and further information is
being sought.
Figure 1: Number of new HIV diagnoses, AIDS at HIV diagnosis* and deaths in people
with HIV: UK, 1998 to 2018
9,000 HIV diagnoses
8,000 AIDS at HIV diagnosis*
Deaths
7,000
6,000
5,000
4,000
3,000
2,000
1,000
0
1998 2000 2002 2004 2006 2008 2010 2012 2014 2016 2018
*AIDS defining illness within 3 months of an HIV diagnosis
viii
New HIV diagnoses totals for men and women are based on gender identity and include trans people. The overall total
includes people who identify as non-binary, in another way, and those with gender identity not reported.
16HIV in the United Kingdom: Towards Zero HIV transmissions by 2030 (2019 report – data to end 2018)
The total of 4,453 HIV new diagnoses in 2018 represents a 32% decline over the last
decade from the 6,565 diagnoses reported in 2009ix. This decline is due to a continued
sharp decrease in diagnoses in GBM from 2015, and a more gradual decline in
diagnoses in both men and women who acquired HIV heterosexually (Figure 2).
Figure 2: Number of new HIV diagnoses by exposure group*: UK, 2009 to 2018
Gay and bisexual men
Men who acquired HIV heterosexually
4,000 Women who acquired HIV heterosexually
People who inject drugs
3,500 Other exposures
3,000
2,500
2,000
1,500
1,000
500
0
2009 2010 2011 2012 2013 2014 2015 2016 2017 2018
*Adjusted for missing exposure information
Using observed data, new HIV diagnoses among residents in London continued to
account for the largest proportion of new diagnoses reported in the UK (34%,
1,504/4,453) in 2018, which is a decline from 40% (2,646/6,563) in 2009. Residents in
the Midlands and East of England region contributed to the highest number of new
diagnoses outside of London (23%; 1,004/4,453) in 2018.
Two-thirds (67%, 3,000/4,453) of persons newly diagnosed in 2018 were aged between
25 and 49 years. The number and proportion of people diagnosed aged 50 years or
over increased from 13% (829/6,565) in 2009 to 21% (936/4,453) in 2018.
4.1.1 New diagnoses among gay and bisexual men (GBM)
Using observed data, the number of new HIV diagnoses among GBM was on the rise at
the beginning of the decade, alongside simultaneous increases in testing rates and
observed increases in incidence among GBM. (Figure 2). The number of new HIV
diagnoses among GBM in 2018 (1,908) was 30% lower than the number reported in
2009 (2,709) and 40% lower than in 2014 (3,165) (Figure 2). Nearly one quarter (23%,
ixSurveillance figures are updated and revised annually for previous years due to reporting delay and additional information
received from some services, allowing us to reallocate previously past incomplete or inaccurate data.
17HIV in the United Kingdom: Towards Zero HIV transmissions by 2030 (2019 report – data to end 2018)
445/1,908) of new HIV diagnoses in GBM in 2018 were known to have been previously
diagnosed outside the UK.
London accounted for 39%x, (736/1,907) of the GBM diagnoses in 2018 compared to
almost half (48%, 1,523/3,165) in 2014 (Figure 3a). New diagnoses have also declined
since 2014 in the Midlands and East of England (36%, 464 to 296) and South of
England (21%, 395 to 311). Outside England, declines were observed in all the
devolved nations: Scotland (33%, 111 to 74), Wales (16 %, 73 to 61), and Northern
Ireland (5%, 44 to 42).
Almost three-quarters of GBM newly diagnosed in 2018 were aged 25 to 49 years
(73%, 1,393/1,908) with a median age at diagnosis of 33 years (inter-quartile range
(IQR) 27 to 43); this has not changed substantially over the past 10 years (Figure 3b).
Across age groups, between 2014 and 2018, the steepest decline in HIV diagnoses
among GBM was observed among those aged 25 to 34 years (42%, 1,318 to 796) and
35 to 49 years (42%, 1,030 to 597), followed by 15 to 24 years (40%, 446 to 269), 50 to
64 (35%, 334 to 216) and those aged 65+ (19%, 37 to 30) (Figure 3b).
In 2018, 71%xi of newly diagnosed GBM were of white ethnicity (Figure 3c), and the
number of new diagnoses among white GBM declined by 49% since 2014 (2,478 to
1,276). The overall numbers of black, Asian and minority ethnic (BAME) GBM newly
diagnosed with HIV were lower, and declines were also observed relative to 2014
among black men (34%, 154xii to 101xiii) and Asian men (30%, 194 to 136). New
diagnoses among GBM of other/mixed ethnicity have remained stable (0%, 273 to 273).
Almost three-quarters (71%, 1,276/1,807) of newly diagnosed GBM in 2018 were born
in the UKxiv or elsewhere in Europe. A decline in new HIV diagnoses has been observed
in both groups since 2014; 1,820 to 873 (52%) in UK-born men and 626 to 403 (36%)
among men born elsewhere in Europe (Figure 3d). New diagnoses among GBM born in
Northern Americaxv declined from 67 to 27 since 2014 (60%), by 37% among GBM born
in Oceania (46 to 29), by 22% among GBM born in Asia (195 to 153) and by 22%
among GBM born in Africa (99 to 77). New HIV diagnoses among GBM born in Latin
America and the Caribbean have varied between 193 and 255 diagnosed each year
since 2014 and comprised 14% (245) of diagnoses among GBM in 2018.
x Data are presented where residence is known and after imputing place of residence from place of diagnosis where not
reported. Data completeness for residence among new diagnoses was 99.6% in 2018 and 100% in 2015.
xi Data are presented where ethnicity is known. Data completeness for ethnicity among new diagnoses was 86% in 2018.
xii The 154 diagnoses among black men in 2014 included 62 men of black African ethnicity, 63 men of black Caribbean ethnicity
and 29 men of black-other ethnicity
xiii The 101 diagnoses among black men in 2018 includes 48 men of black African ethnicity, 39 men of black Caribbean ethnicity
and 14 men of black-other ethnicity.
xiv Data are presented where region of birth is known. Data completeness for region of birth among new diagnoses was 85% in
2018 and 93% in 2014.
xv Northern America includes Bermuda, Canada, Greenland, Saint Pierre and Miquelon, United States of America
18HIV in the United Kingdom: Towards Zero HIV transmissions by 2030 (2019 report– data to end 2018)
Figure 3: Number of HIV diagnoses* among GBM, by population characteristics: UK, 2009 to 2018
3,000 3,000
a) Region of residence London b) Age group 15 - 24 25 - 34 35 - 49
2,500 Outside London, England 2,500 50 - 64 65 +
Elsewhere UK
2,000 2,000
1,500 1,500
1,000 1,000
500 500
0 0
2009 2010 2011 2012 2013 2014 2015 2016 2017 2018 2009 2010 2011 2012 2013 2014 2015 2016 2017 2018
3,000 White Black 3,000 UK
c) Ethnicity d) Region of birth Other Europe
Asian Other/Mixed
2,500 2,500 Latin America and the Caribbean
Northern America
2,000 Other
2,000
1,500 1,500
1,000 1,000
500 500
0 0
2009 2010 2011 2012 2013 2014 2015 2016 2017 2018 2009 2010 2011 2012 2013 2014 2015 2016 2017 2018
*Observed data, not adjusted for missing information
19HIV in the United Kingdom: Towards Zero HIV transmissions by 2030 (2019 report– data to end 2018)
4.1.2 New diagnoses among people who acquired HIV heterosexually
In 2018, using observed data, 724 men and 826 women who were reported as having
acquired HIV through heterosexual sex were newly diagnosed in the UK, and 22%
(333/1,550) of these had been previously diagnosed outside the UK. The number of
newly diagnosed men and women who acquired HIV heterosexually peaked in 2004,
and halved between 2009 and 2018, from 3,236 to 1,550 (Figure 2).
The decline over the decade was particularly steep among residents in London (63%,
from 1,135 to 416) (Figure 4a). The number of new diagnoses among men and women
who acquired HIV heterosexually in 2018 was highest among the Midlands and East of
England residents (461), followed by London residents (416), the North of England
residents (327) and the South of England (215) residents. In Scotland, Wales and
Northern Ireland the number of new diagnoses among men and women who acquired
HIV heterosexually was lower at 65, 35, and 30 respectively
Over the last decade, the steepest decline in new HIV diagnoses among men and
women who acquired HIV heterosexually was observed in those aged 25 to 34 years
(67%, 1,089 to 355), followed by 15 to 24 year olds (66%, 278 to 94) (Figure 4b). The
median age at diagnosis in 2018 was 45 years (IQR: 36 to 53 years) among men and
39 years (IQR: 31 to 49 years) among women. In 2009, the median age at diagnosis
was 40 years (IQR: 33 to 47 years) and 34 years (IQR: 29 to 41 years) respectively.
Overall, in 2018, 34% (246/724) of men were aged 50 years or over at the time of their
diagnosis, in comparison to 23% (187/826) of women. These figures compare to 19%
(253/1,320) and 10% (184/1,916) in 2009, respectively.
Black African men and women accounted for 44%xvi (643/1,477) of new HIV diagnoses
among adults who acquired HIV heterosexually in 2018, compared to 61%
(1,961/3,219) of new diagnoses in 2009, representing a 67% decline (1,961 to 643).
However, it should be noted that the decline has levelled off since 2017 (626) and 2018
(643) (Figure 4c). Over the same time, diagnoses among black Caribbean men and
women who acquired HIV heterosexually also declined, from 141 in 2009 to 46 in 2018
(67% fall). Men and women who acquired HIV heterosexually and were of white
ethnicity accounted for 38% (555/1,477) of new diagnoses in 2018, compared to 24%
(773/3,219) in 2009.
In 2018, almost half (47%, 698/1,475) of men and women diagnosed with HIV in the UK
who acquired HIV heterosexually were born in a country of high HIV prevalencexvii and
31% (452) were born in the UK (Figure 4d). The equivalent figures for 2009 were 63%
xvi Proportions presented where ethnicity is known. Data completeness for ethnicity among new diagnoses in 2018 was 86%
and 99% in 2009
xvii Proportions presented where data on country of birth are known. Data completeness for country of birth among new
diagnoses was 85% in 2018 and 96% in 2009
20HIV in the United Kingdom: Towards Zero HIV transmissions by 2030 (2019 report – data to end 2018)
(1,989/3,137) and 23% (731) respectively. Most people diagnosed in 2018 and born in a
high prevalence country were of black African ethnicity (81%, 550/678); the majority of
those born in the UK were of white ethnicity (83%, 366/439).
21HIV in the United Kingdom: Towards Zero HIV transmissions by 2030 (2019 report– data to end 2018)
Figure 4: Number of HIV diagnoses* among men and women who acquired HIV heterosexually, by population
characteristics: UK, 2009 to 2018
*Observed data, not adjusted for missing information
3,000 a) Residence London 3,000 15-24 25-34
b) Age group
Outside London, England 35-49 50-64
2,500 Elsewhere UK 2,500 65+
2,000 2,000
1,500 1,500
1,000 1,000
500 500
0 0
2009 2010 2011 2012 2013 2014 2015 2016 2017 2018 2009 2010 2011 2012 2013 2014 2015 2016 2017 2018
3,000 3,000
c) Ethnicity White d) Region of birth UK
Black African High prevalence countries
2,500 Black Caribbean/Black Other 2,500 Other countries
Asian
2,000 Other/Mixed 2,000
1,500 1,500
1,000 1,000
500 500
0 0
2009 2010 2011 2012 2013 2014 2015 2016 2017 2018 2009 2010 2011 2012 2013 2014 2015 2016 2017 2018
22HIV in the United Kingdom: Towards Zero HIV transmissions by 2030 (2019 report– data to end 2018)
4.1.2.1 Probable country of infection among men and women who acquired HIV
heterosexually
By assigning probable country of infection based upon information on CD4 decline and
year of UK arrival, the number of people who acquired HIV heterosexually and who are
likely to have acquired HIV after arrival to the UK can be estimated (17). The probable
country of infection model estimated a decline in infections acquired after arrival to the
UK among those born abroad from 777 (uncertainty range: 364 to 1,155) in 2009 to 332
(uncertainty range: 242 to 417) in 2018. The model also estimated a decline of infection
acquired before UK arrival from 1,000 (uncertainty range: 622 to 1,413) to 489
(uncertainty range: 404 to 579) over the same period (Figure 5a). Among UK-born men
and women, infections acquired abroad remained low and stable while a decline was
observed from 550 in 2009 to 330 in 2018 for UK-acquired infections (Figure 5b).
Figure 5: Estimated number of new diagnoses among men and women who acquired HIV
heterosexually, by place of acquisition (UK or abroad) and by country of birth: UK, 2009
to 2018
1,600 a) Born abroad Acquired after UK arrival
1,400
Acquired before UK arrival
1,200
1,000
800
600
400
200
0
2009 2010 2011 2012 2013 2014 2015 2016 2017 2018
1,600 b) UK born
UK acquired
1,400
1,200 Acquired abroad
1,000
800
600
400
200
0
2009 2010 2011 2012 2013 2014 2015 2016 2017 2018
23HIV in the United Kingdom: Towards Zero HIV transmissions by 2030 (2019 report – data to end 2018)
4.1.3 New diagnoses among pregnant women
In 2018, 119 women were newly diagnosed with HIV whilst pregnant (Table 1), with
70% (83/119) of these diagnoses made in antenatal settings. The majority of these
pregnant women newly diagnosed in 2018 were born outside the UK (78%; 88/113) xviii
and just over half of those born abroad (56%; 49/88) were of black African ethnicity.
Table 1: HIV diagnoses among pregnant women by region of birth and ethnicity: UK,
2015 to 2018
Region of birth Ethnicity 2015 2016 2017 2018
White 18 15 20 16
UK Black African 4 5 2 2
Other/Not stated 3 3 3 7
White 22 16 14 24
Outside UK Black African 65 38 47 49
Other/Not stated 15 13 21 15
Total 130 90 109 119
(including where region of birth is not stated)
4.1.4 Trans people
Since the availability of information on gender identity and trans status in 2015, 67 new
diagnoses have been recorded among transxix people; 11 diagnoses in 2018, 16 in
2017, 16 in 2016 and 24 in 2015. Six trans people diagnosed in 2018 were aged 35 to
49 years, 6 were white and 7 were diagnosed late.
4.1.5 People who inject drugs (PWID)
The number of people who probably acquired HIV through injecting drug use has fallen
by a third since 2009 (140 to 94), and comprised 2% of all new HIV diagnoses in 2018
(94/4,453). Of these 94 individuals, 80% (75/94) were men, 85% (80/94) were aged
between 25 to 49 years, 89% (84/94) were of white ethnicity. Just over one third (36%;
34/94) were Midlands and East of England residents, 19% (18/94) were London
xviii
Data are presented where region of birth is known. Data completeness for region of birth among new HIV diagnosis was
85% complete in 2018
xix Trans is an umbrella term that refers to all people whose gender identity is different to the gender given at birth, this includes
trans men, trans women, non-binary, and other gender identities
24HIV in the United Kingdom: Towards Zero HIV transmissions by 2030 (2019 report – data to end 2018)
residents, 19% (18/94) were South of England residents, 13% (13/94) were residents of
Scotland and 12% (11/94) North of England residents.
Box A: Ongoing HIV outbreak in Glasgow
First recognised in early 2015, an outbreak of HIV among PWID in Glasgow continued
in 2018. Since it began, over 150 individuals have been diagnosed with HIV, with
injecting drug use or sexual contact with someone known to inject drugs, being the
main risk factors for HIV acquisition. The outbreak is related to transmission among
those who inject drugs within Glasgow city centre, mainly heroin with or without
cocaine. Many of those affected are homeless, and are in contact with the criminal
justice system.
Phylogenetic analysis has demonstrated an outbreak strain of subtype C virus with
identical primary non-nucleoside reverse transcriptase inhibitor (NNRTI) mutations
(E138A and V179E) uncommon elsewhere in the UK*. HIV prevalence in PWID in
Glasgow city centre has increased from 1.1% in 2011 to 10.8% in 2018†.
This outbreak is being managed through increasing awareness of the risks of HIV
among the at-risk population and specialist drug treatment services, increasing
provision of needle and syringe programmes (eg greater evening availability),
improving the frequency of HIV testing and its accessibility and proactively supporting
the early treatment of those newly diagnosed. An intervention model was developed
that supported a clinical nurse specialist and an HIV consultant-led service within
health services for the homeless. A new model of ART delivery within community
pharmacy services allows ART to be dispensed with opioid substitution therapy (OST).
The Glasgow outbreak occurred despite widespread availability of core HIV prevention
services including NSP, OST and ART, and highlights the complex control measures
and multidisciplinary response required.
* Ragonnet-Cronin M, Jackson C, Bradley-Stewart A, Aitken C, McAuley A, Palmateer N, et al. Recent and Rapid
Transmission of HIV Among People Who Inject Drugs in Scotland Revealed Through Phylogenetic Analysis. J Infect Dis.
2018;217(12):1875-82.
† McAuley A, Palmateer NE, Goldberg DJ, Trayner KM, Shepherd SJ, Gunson RN, Metcalfe R, Milosevic C, Taylor A, Munro
A, Hutchinson SJ. Re-emergence of HIV related to injecting drug use despite a comprehensive harm reduction environment: a
cross-sectional analysis. The Lancet HIV. 2019 May 1;6(5):e315-24.
25HIV in the United Kingdom: Towards Zero HIV transmissions by 2030 (2019 report – data to end 2018) 4.1.6 Late HIV diagnosis For surveillance purposes, a late HIV diagnosis is defined as having a CD4 cell count of less than 350 cells/mm3 within 91 days of HIV diagnosisxx. Late HIV diagnosis is the most important predictor of morbidity and premature mortality among people with HIV infection (18). Furthermore, people diagnosed late are likely to have been living with an undiagnosed HIV infection for at least 3 to 5 years (19) and may have been at risk of passing on HIV to partners if having unprotected sex. Overall, the adjustedxxi number of late HIV diagnoses decreased from 3,353 in 2009 to 1,883 in 2018, representing 52% and 43% of all new diagnoses in 2009 and 2018 respectively and a 44% decline over the decade. One quarter (24%, 825/3,465) of all adults diagnosed in 2018 were severely immunocompromised (with a CD4 count
HIV in the United Kingdom: Towards Zero HIV transmissions by 2030 (2019 report – data to end 2018)

Figure 6: Adjusted* number of people diagnosed late by exposure group: UK, 2009 to
2018
                                                   Gay and bisexual men
                                                   Black African men who acquired HIV heterosexually
1,400                                              Black African women who acquired HIV heterosexually
                                                   White men who acquired HIV heterosexually
1,200
                                                   White women who acquired HIV heterosexually

1,000

  800

  600

  400

  200

    0
          2009      2010      2011     2012      2013      2014      2015     2016      2017         2018

 *Adjusted for missing CD4 count at diagnosis.

Throughout this report, the term late diagnosis is used to refer to the late stage of HIV
infection at an adult’s first positive HIV test in the UK. However, many people living with
HIV were first diagnosed abroad before their arrival in the UK. In 2018, a total of 921
adults (21% of all adult new reports of HIV diagnoses) had been previously diagnosed
abroad. The number of late diagnoses in this group accounted for, on average 13% of
all late diagnoses made between 2015 and 2018 (ranging from 11 to 14%). It is
important that as soon as possible after arrival this population is linked to HIV care and
treatment is continued or initiated rapidly. In 2018, almost one quarter (23%; 208/921)xxi
of adults first diagnosed abroad had a CD4 count
HIV in the United Kingdom: Towards Zero HIV transmissions by 2030 (2019 report – data to end 2018)
Where illness data were reportedxxii, pneumocystis pneumonia remained the most
commonly diagnosed AIDS-defining illness, accounting for 37% (87/225) of AIDS
diagnoses in 2018, followed by candidiasisxxiii (22%; 50/225), tuberculosisxxiv (8%,
19/225) and Kaposi’s sarcoma (8%, 18/225).
4.1.8 Setting of diagnosis
The setting of first positive test was reported for 91% (4,019/4,409) of adults (aged ≥ 15
years) newly diagnosed with HIV in the UK in 2018. Most adults (66%, 2,641/4,019)xxv in
the UK continue to have their first positive HIV test in sexual health services (SHS),
followed by hospital wards/accident and emergency (A&E) (10%, 415/4,019), general
practice (7%, 294/4,019) and outpatient services (8%, 303/4,019 (Figure 7). Key groups
most likely to have been diagnosed outside of SHS include: women (42%, 432/1,030),
people of black Caribbean ethnicity (45%, 38/84), PWID (58%, 52/89), people aged 50
years and above (47%, 376/807) and people diagnosed late with HIV (46%, 658/1,411).
The proportion of HIV diagnoses made outside SHS has increased over the past
decade in line with the evolving HIV epidemic and changes to testing recommendations
(Appendix 3) (20).
xxii Data are presented where AIDS-defining illness information is known. Data completeness for AIDS-defining illnesses among
was 93% complete in 2018. Please note breakdowns in this paragraph present the absolute number of AIDS-defining illnesses
reported within numerators; there were 41 people who had more than one AIDS-defining illness reported in 2018
xxiii Includes oesophageal candidiasis and candidiasis of bronchi, trachea or lung
xxiv Includes extrapulmonary and pulmonary tuberculosis
xxv
Through previous data triangulation, the proportion of people diagnosed in sexual health services is likely to be an overestimate (20.
Croxford S, Yin Z, Kall M, Burns F, Simmons R, Copas A, et al. Where do we diagnose HIV infection? Monitoring new diagnoses
made in nontraditional settings in England, Wales and Northern Ireland. HIV Med. 2018.)
28HIV in the United Kingdom: Towards Zero HIV transmissions by 2030 (2019 report – data to end 2018)
Figure 7: Setting of first positive test among adults newly diagnosed with HIV by
population group1: UK, 2018
Sexual health services Antenatal clinic General Practice
Hospital wards/A&E Outpatient Other²
100% 3% 4% 4% 4%
6% 6% 5% 6% 6% 6% 5% 7% 5%
90% 8% 11% 8% 13% 10% 7% 13% 8% 12% 7% 9%
14% 26% 14%
7% 8% 5%
80% 10% 7% 10%
Proportion of new diagnoses
11% 12%
11% 5% 6%
6% 15% 7% 18% 2%
7% 7% 18% 2% 18% 7%
70% 8%
12%
3%
1% 11% 2%
8% 11% 9%
60% 5% 6% 10%
2% 5% 15% 2%
50%
4%
1%
40%
75% 73%
68% 66% 70% 69% 66%
30% 58% 57% 55% 52% 53% 54%
20% 42%
10%
0%
Female
White
Sex between men
15-49
Black African
Male
Heterosexual contact
Injected Drug use
≥50HIV in the United Kingdom: Towards Zero HIV transmissions by 2030 (2019 report – data to end 2018)
among people diagnosed with HIV who injected drugs was much higher, at 23.61 per
1,000.
In 2018, the crude mortality rate among people aged 15 to 59 years who were
diagnosed promptly was 1.19 per 1,000, in line with the general population of the same
age group (1.61 per 1,000)xxvi. Among men aged 15-59 years, equivalent figures were
1.40 per 1,000 among those diagnosed promptly and 1.97 per 1,000 among men in the
general population aged 15 to 59 years respectively; among women aged 15 to 59
years, these figures were 0.73 and 1.24 per 1,000.
People diagnosed late are at increased risk of developing an AIDS-defining illness and
continue to have a more than 10-fold increased risk of death in the year following their
diagnosis (24). One-year mortality among people diagnosed late in 2017 was 23.62 per
1,000, compared to 2.01 per 1,000 among people diagnosed promptly (Figure 8). One-
year mortality was particularly marked among people aged 65 years and over, at 89.29
per 1,000 (5 deaths among 56 people diagnosed late in 2017).
Figure 8: One year mortality rates among adults newly diagnosed with HIV by CD4
cells/mm3 at diagnosis: UK, 2017
100 CD4HIV in the United Kingdom: Towards Zero HIV transmissions by 2030 (2019 report– data to end 2018)
4.3 Incidence and estimates of the total number of people living with HIV
4.3.1 Recent infection testing algorithm (RITA)
In 2018, 38% of people who were newly diagnosed with HIV were tested for recent
infection using a recent infection testing algorithm (RITA) (25); this proportion was
similar among GBM and people who acquired HIV heterosexually, at 41%. Based on
the 789 new HIV diagnoses among GBM with RITA results in 2018, just over a quarter
(26%) were likely diagnosed at a recent stage of infection (infection probably acquired
within 4 months of the date of the first confirmed antibody positive specimen) (Appendix
1). The proportion of GBM diagnosed with recent infection initially increased from 23%
(343/1,515) in 2011 to 35% in 2014 (617/1,761), after which a decline was observed,
however the number of centres submitting specimens has changed over time therefore
the make-up of the populations tested for recent infection may also have changed. In
mid-2013 the original HIV recency assay (Abbott AxSYM) used within Public Health
Engand’s RITA was withdrawn by the manufacturer and testing was moved to the Sedia
Limiting Antigen Assay. Internal verification showed these assays had similar
performance characteristics. Of people who acquired HIV heterosexually, the proportion
with a RITA result showing diagnosis at a recent stage of infection increased from 7%
(51/689) in 2009 to 10% (66/634) in 2018.
4.3.2 Estimated incidence and undiagnosed HIV infection
A CD4 back-calculation model is used to estimate HIV incidence among GBM living in
England (26); the model has now been extended to account for the increased
probability of diagnosis after acquiring infection. The estimated number of new
infections acquired per year rose from around 2,400 infections (95% credible interval
(CrI) 2,200 to 2,600) in 2009, to a peak of 2,800 (CrI 2,600 to 3,000) in 2012, before
falling by 71% to 800 (CrI 500 to 1,400) in 2018 (Figure 9). Over the past 5 years the
number of incident infections has declined by 65% from an estimated 2,300 in 2014.
31HIV in the United Kingdom: Towards Zero HIV transmissions by 2030 (2019 report – data to end 2018)
Figure 9: Estimates of HIV incidence in GBM: England, 2009 to 2018
Estimated incidence 95% credible interval (CrI)
3,500
3,000
2,500
2,000
1,500
1,000
500
0
2009 2010 2011 2012 2013 2014 2015 2016 2017 2018
The CD4 back-calculation model is also used to estimate undiagnosed HIV infections
among GBM. The model has been refined to exclude men who probably acquired HIV
abroad and were first diagnosed prior to arrival in the UK. Following this adjustment, the
number of GBM estimated to be living with an undiagnosed HIV infection in England
was 3,600 (CrI 2,800 to 4,800) (Figure 10). This is a 50% decline from the 7,000 (CrI
6,700 to 7,300) in 2014.
Figure 10: Estimates of undiagnosed HIV infection in GBM using the CD4 back
calculation method: England, 2009 to 2018
10,000
9,000
8,000
7,000
6,000
5,000
4,000
3,000
2,000
1,000
0
2009 2010 2011 2012 2013 2014 2015 2016 2017 2018
32HIV in the United Kingdom: Towards Zero HIV transmissions by 2030 (2019 report – data to end 2018)
Using a modelling approach that combines new HIV diagnoses, RITA data and HIV
testing history (27), the estimated number of newly acquired HIV infections among
heterosexual men halved from 550 (CrI 400 to 650) in 2014 to 250 (CrI 150 to 350) in
2017 (Figure 11). Equivalent estimates for women were 450 (350 to 600) and 350 (CrI
250 to 450) (Figure 12).
Figure 11: Estimated new HIV infections in heterosexual men, England 2014 to 2017
700
600 543
500 470 466
400
300 253
200
100
0
2014 2015 2016 2017
95% credible interval of estimated incidence Estimated incidence RITA
Figure 12: Estimated new HIV infections in heterosexual women, England 2014 to 2017
700
600
498
500 454 478
400 335
300
200
100
0
2014 2015 2016 2017
95% credible interval of estimated incidence Estimated incidence RITA
33HIV in the United Kingdom: Towards Zero HIV transmissions by 2030 (2019 report – data to end 2018)
4.3.3 Multi-Parameter Evidence Synthesis (MPES) modelxxvii: estimating the total
number of people living with HIV including those undiagnosed
In 2018, an estimated 103,800 (CrI 101,600 to 107,800) people were living with HIV
infection in the UK (Figure 13, Table 2 and Table 3). The overall prevalence of HIV in
England in 2018 was 2.3 per 1,000 (CrI 2.2 to 2.4) among people aged 15 to 74 years.
Figure 13: Estimated number of people living with HIV (diagnosed and undiagnosed), all
ages: UK, 2018
50,000
45,800 Total living with HIV = 103,800 (101,600 - 107,800)
Diagnosed
Total diagnosed = 96,300 (95,700 - 96,900)
45,000 Undiagnosed
Total undiagnosed = 7,500 (5,400 - 11,500)
40,000
35,000
People living with HIV
30,000
25,000
20,000 17,700
15,000
9,200 10,200
10,000 4,000 8,400
5,000 900 2,200
500 800 900
100
0
Gay and Black African Black African Non black- Non black- People who
bisexual men men women African men African women inject drugs
xxvii The Multi-Parameter Evidence Synthesis (MPES) model is described in more detail in Appendix 24.
34HIV in the United Kingdom: Towards Zero HIV transmissions by 2030 (2019 report– data to end 2018)
Table 2: Estimated number of people living with HIV and estimated number undiagnosed by exposure group: UK and
England, 2018*
UK England
Number % Number %
Number of people Number of people
undiagnosed Undiagnosed undiagnosed Undiagnosed
living with HIV living with HIV
Exposure category
(95% Credible (95% Credible (95% Credible (95% Credible
(95% Credible Interval) (95% Credible Interval)
Interval) Interval) Interval) Interval)
49,800 4,000 8% 45,200 3,600 8%
Gay and bisexual men
(48,000, 53,400) (2,300, 7,600) (5, 14%) (43,600, 48,200) (2,000, 6,700) (5, 14%)
8,900 500 6% 8,500 500 6%
Black African men
(8,700, 9,200) (300, 800) (4, 9%) (8,200, 8,800) (300, 700) (4, 8%)
10,200 900 9% 9,000 800 9%
Heterosexuals
Men excluding black
Africans (9,600, 12,200) (500, 3,000) (5, 24%) (8,600, 10,800) (400, 2,600) (5, 24%)
18,400 800 4% 17,600 700 4%
Black African women
(18,200, 18,800) (600, 900) (3, 5%) (17,300, 17,900) (600, 900) (3, 5%)
Women excluding 11,100 900 8% 10,000 800 8%
black Africans (10,700, 11,500) (700, 1,300) (6, 11%) (9,800, 10,400) (600, 1,100) (6, 11%)
48,600 3,200 7% 45,200 2,900 6%
All heterosexuals
(47,800, 50,800) (2,400, 5,200) (5, 10%) (44,400, 47,100) (2,200, 4,700) (5, 10%)
2,300 100 6% 1,800 100 5%
People who inject drugs
(2,200, 2,600) (30, 400) (1, 15%) (1,600, 2,000) (20, 300) (1, 14%)
103,800 7,500 7% 94,900 6,700 7%
Total
(101,600, 107,800) (5,400, 11,500) (5, 11%) (92,900, 98,300) (4,900, 10,100) (5, 10%)
* Numbers may not add to total due to rounding to the nearest 100 and exclusion of data relating to HIV acquired through vertical transmission and blood/blood-related products
35You can also read