Genetic perspectives on ''Lion Conservation Units'' in Eastern and Southern Africa
←
→
Page content transcription
If your browser does not render page correctly, please read the page content below
Conserv Genet
DOI 10.1007/s10592-013-0453-3

 RESEARCH ARTICLE

Genetic perspectives on ‘‘Lion Conservation Units’’ in Eastern
and Southern Africa
J. M. Dubach • M. B. Briggs • P. A. White            •

B. A. Ament • B. D. Patterson

Received: 22 November 2012 / Accepted: 22 January 2013
Ó Springer Science+Business Media Dordrecht 2013

Abstract Current understanding of genetic variation in           Namibia and South Africa and the other more widespread
lions (Panthera leo) is inadequate to guide many man-            across the region. However, these analyses are equivocal
agement decisions necessary for conservation of the spe-         on which of these is closest to the ancestor of modern lions.
cies. We studied sequence variation in the mitochondrial         Microsatellite analyses showed high levels of variation
cytochrome-b (cyt-b) gene of 75 lions and nuclear variation      within and among populations, subdivision among most
at 11 microsatellite loci of 480 lions across 8 range states     LCUs, and evidence of isolation by distance. While rates of
(Cameroon, Uganda, Kenya, Zambia, Zimbabwe, South                gene flow are generally low, admixture among lions in
Africa, Botswana, and Namibia) and 13 Lion Conservation          northern Botswana, Caprivi Strip (Namibia) and Zambia is
Units (LCUs) plus two other unassigned sites (Cameroon           apparent from STRUCTURE analyses. Conservation
and Zimbabwe). A total of 11 cyt-b haplotypes were found,        management plans should incorporate information on
whose variation follows an isolation-by-distance model. In       genetic variability and gene flow in delimiting management
combination with previously known sequences, the haplo-          units and in guiding translocations of lions to minimize
types document the close relationship, derived position,         inbreeding and to control problem animals.
and limited variability of Asian and West and Central
African lions relative to other extant lions. Both phyloge-      Keywords Panthera leo  Lion  Cytochrome-b
netic analyses and substitution networks identify two            Haplotype  Microsatellite  Gene flow
clades in Eastern and Southern Africa—one restricted to          Isolation-by-distance

Electronic supplementary material The online version of this     Introduction
article (doi:10.1007/s10592-013-0453-3) contains supplementary
material, which is available to authorized users.
                                                                 Historically, the lion (Panthera leo) was distributed over
J. M. Dubach                                                     much of Africa, the Middle East, and southwest Asia. Its
Department of Comparative Medicine, Loyola University            range extended from the Cape of Good Hope to the Med-
Medical School, 2160 S. First Ave., Maywood, IL 60153, USA
                                                                 iterranean, from Senegal to Somalia, and from Greece and
M. B. Briggs  B. A. Ament                                       Yemen to central India (Barnett et al. 2009). Range col-
APCRO, Inc., 289 Butte View Drive, Bolingbrook,                  lapse from persecution by humans has been rapid and
IL 60490, USA                                                    continual. Lions were extirpated from the Cape Region of
                                                                 South Africa in the mid-19th century, from Turkey, Syria,
P. A. White
Center for Tropical Research, University of California,          Tunisia, and Algeria by the end of the 19th century, and
Los Angeles, CA 90095-1496, USA                                  from Morocco, Pakistan, and Iran between 1922 and 1942
                                                                 (Guggisberg 1961). Today, only a single population
B. D. Patterson (&)
                                                                 remains in Asia, in the Gir Forest of Gujarat, India. In
Science & Education, Field Museum of Natural History,
Chicago, IL 60605-2496, USA                                      Africa, lions are mainly restricted to larger parks, reserves,
e-mail: bpatterson@fieldmuseum.org                               and the remaining wilderness areas in savannas, covering

                                                                                                                    123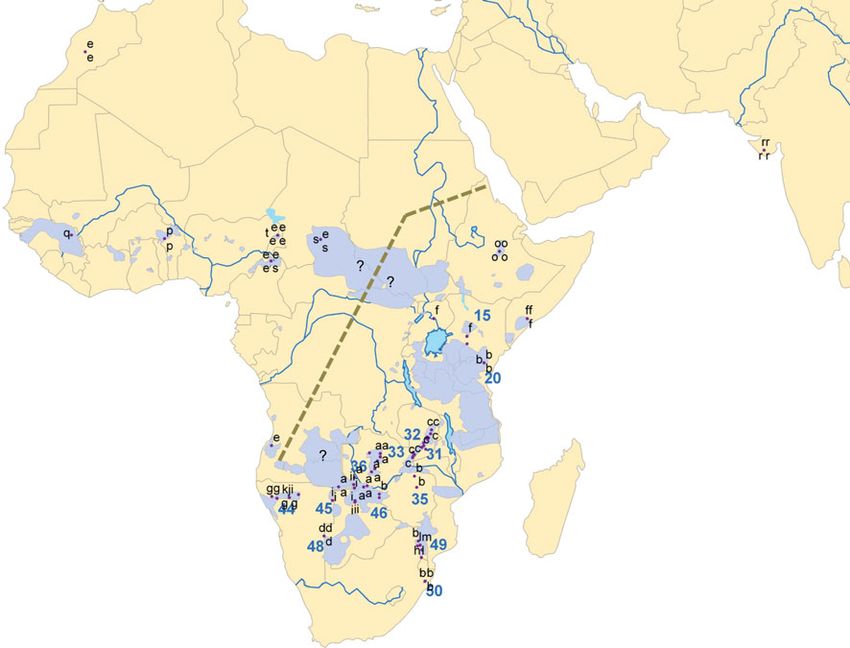
Conserv Genet

no more than 20–25 % of their historic range (IUCN SSC          often produces small population size and, despite the lion’s
Cat Specialist Group 2006b; Riggio et al. 2012).                impressive capacity for dispersal, a loss of genetic vari-
   Range collapse has been accompanied by plummeting            ability (O’Brien et al. 1987). Moreover, fencing parks and
lion numbers. Reliable population estimates for elusive,        reserves to mitigate animal-human conflict interrupts nat-
often nocturnal predators are notoriously difficult, but a      ural patterns of migration and gene flow (Wildt et al. 1987;
variety of estimates converge at roughly 32,000 (Riggio         Hayward and Kerley 2009; Trinkel et al. 2011), which also
et al. 2012). Rates of decline are alarming, as the number of   reduces variability. Reduced genetic variation can have
African lions has fallen 30 % over the past two decades         reproductive and other fitness consequences in lions and
(three lion generations) and perhaps by 48.5 % since 1980       other large mammals. To safeguard species, it is critical to
(IUCN 2012). The lion is considered regionally endangered       understand natural corridors to dispersal and gene flow and
in West Africa, with 480–525 individuals remaining in the       to identify instances where genetic continuity has been
entire region (Riggio et al. 2012). Only 7 range states—        interrupted. Infectious diseases are also likely to move
three in Eastern Africa and four in Southern Africa—are         along these corridors.
thought to support as many as 1,000 lions each: Ethiopia,
Kenya, Tanzania, Zambia, Zimbabwe, Botswana, and                Genetics and population structure of lions
South Africa (IUCN SSC Cat Specialist Group 2006b).
   Conflicts with people are overwhelmingly responsible         Although lions are frequently thought to have ranged
for the range and population collapse of lions. Retaliatory     across Africa, Eurasia, and Beringia during the late Pleis-
killing in response to attacks on livestock and people          tocene, studies by Burger et al. (2004) on mitochondrial
(Patterson et al. 2004; Packer et al. 2005), native prey        cyt-b sequences showed that Pleistocene lions belong to a
depletion through overgrazing and bushmeat harvest              different lineage than extant populations (see also Hemmer
(Burton et al. 2011), and loss and fragmentation of habitat     1974). Corrected genetic distances for cyt-b of 5–6 %
(Hunter et al. 2007; Kiffner et al. 2009; Riggio et al. 2012)   separate Pleistocene lions from modern samples, while the
are the most widely acknowledged causes of lion endan-          latter typically differ by ca. 1 %. Based on variation in
germent (IUCN SSC Cat Specialist Group 2006b; pers.             *358 bp of mt-DNA (hypervariable region 1 and ATPase
obs.).                                                          subunit 8), Barnett et al. (2009) found evidence for three
                                                                species of lions: modern (African plus Asian) lions, the
Lion conservation units (LCU)                                   cave lion of Pleistocene Eurasia and Beringia (both Asia
                                                                and North America), and the American lion (from late-
Conserving large predators with extensive, multinational        Pleistocene samples collected in unglaciated regions of
ranges is an international enterprise requiring assessment,     southern North America). That study also identified a
coordination, and prioritization. The Cat Specialist group      major dichotomy among modern lions, between samples
of the World Conservation Union examined lion distribu-         collected over the lion’s historic range in Asia (India, Iran)
tion and status in both West and Central Africa (2006a) and     and North, West, and Central Africa (Barbary, Senegal and
in Eastern and Southern Africa (2006b), modeling their          Sudan) from those collected in Eastern and Southern Africa
approach on the successful hemispheric strategy for con-        (see also Barnett et al. 2006a, 2006b). The genetic dis-
serving jaguars, Panthera onca (Sanderson et al. 2002).         tinction of lions in Eastern and Southern Africa from those
They identified 66 areas in Eastern and Southern Africa         elsewhere in the species’ range was confirmed by studies of
that cover 61 % of the lion’s known and possible range in       Antunes et al. (2008) on mt-DNA (12S and 16S mt-rRNA)
the region. LCUs were not restricted to or based on pro-        and nuclear (Sry) sequence and microsatellite variation.
tected areas, but many are associated with parks and            Bertola et al. (2011) corroborated that lions in Eastern and
reserves. Experts assessed viability, limiting factors, and     Southern Africa were more variable in cyt-b and control
threats for each of the LCUs, which are seen as manage-         region haplotypes and were genetically distinct. Regional
ment units for preserving lions in situ (IUCN SSC Cat           differences in mt-DNA (cyt-b and NADH-5) between lions
Specialist Group 2006b). This region of Africa is thought       in Eastern and Southwestern Africa had been previously
to support the vast majority of extant lions (Bauer and Van     noted by Dubach et al. (2005).
Der Merwe 2004), including all 10 ‘‘lion strongholds’’              To date, there has been no systematic attempt to char-
(Riggio et al. 2012).                                           acterize genetically the lions remaining in Africa’s reserve
   Endangerment in African lions is typically direct, via       systems. Prior appraisals of regional differentiation offer
survivorship, but theoretically there are genetic risks too     little guidance to various management decisions made
(Björklund 2003), best exemplified by lions of the Ngo-        continually in lion range states: where should problem
rongoro Crater (Packer et al. 1991) and Hluhluwe-Umfo-          animals be translocated? What is the proper source for
lozi (Anderson 1981; Maddock et al. 1996). Range collapse       restocking wild areas or for animals being introduced to

123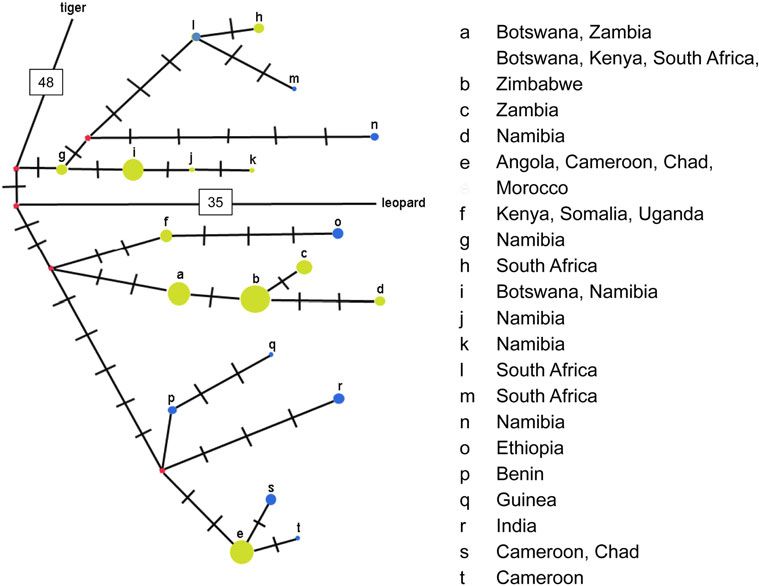
Conserv Genet
fenced reserves? There is also theoretical interest in the Genetic samples utilized 3.0 ml whole blood in either
degree to which a large, widespread predator shows EDTA or heparin mixed 1:1 with LTSB. To increase yield
regional differentiation and evidence of local adaptation. of nucleated cells, we centrifuged 8.0 mls of whole blood at
Although historical interest in this topic has focused on 8,000 rpm for 12 min and then, using sterile plastic, dis-
morphological and taxonomic differentiation, current posable pipettes, harvested the buffy coat and placed it 1:1
interest extends to the susceptibility and connectedness of in cryovials with LTSB.
these populations to various zoonoses. Accordingly, our Biopsy darts were custom-built for African lions by Pneu-
goals were to characterize the genetic underpinnings of lion Dart (Williamsport, PA, USA). Biopsy darts were based on a
populations in Eastern and Southern Africa, in the heart of 3 cc drug dart body and were 0.50 caliber, 400 in length and
their remaining range and over many of Africa’s most incorporated a 1/800 wide 9 3/800 long cutting ferrule tip
iconic parks and reserves. which housed a barbed pin. Darts were propelled via a Pneu-
Dart Model 389 projector powered by green 0.22 caliber CCI
charges. Lions were darted in the shoulder or thigh muscle at
Materials and methods distances from 15 to 45 meters. On impact, the biopsy dart’s
ferrule tip cut and extracted a tiny (ca. 1/800 9 3/1600 - 5/1500 )
Sample collection core of tissue before falling off the animal. Once the dart was
recovered, the cutting ferrule was unscrewed from the dart
Samples (blood, biopsy dart, or dried tissue) were collected body to reveal the barbed pin containing the tissue sample that
from as many sites as possible in Eastern and Southern was subsequently transferred into a cryovial containing either
Africa; access to samples and permitting regulations made 95 % EtOH or Tris buffer.
for a very uneven distribution of sampling effort (See We assembled samples from 480 individual lions
Supplemental Table 1 for site locations). Each lion was residing in eight countries (Cameroon, Uganda, Kenya,
sampled by one of the following methods: (1) blood Zambia, Zimbabwe, South Africa, Botswana, and Nami-
obtained during live-capture, (2) fresh tissue collected via bia), including 13 LCUs: 15, 20, 31, 32, 33, 36, 38, 44, 45,
biopsy darting, or (3) a 1 9 1 cm snip of salted and air- 46, 48, 49, 50 (sensu IUCN SSC Cat Specialist Group
dried skin obtained from sport-hunted trophies and lions 2006b; see Table 1). In most cases, samples were assigned
killed by the wildlife authorities as ‘‘problem’’ animals. to the encompassing or a nearby LCU, however a few
Fresh samples were either frozen in liquid nitrogen or samples known only as having originated in Botswana and
placed in an equal volume of long-term storage buffer Uganda could not be assigned to LCUs, nor could captives
(LTSB: 100 mM Tris, 100 mM EDTA, 2 %SDS, pH 8.0) or geo-referenced samples from undesignated areas in
for storage and shipment. Zimbabwe. The Cameroon samples came from an LCU
Obtaining blood samples from lions was done by first (Bénoué complex-Gashaka-Gumti) identified in the West
anesthetizing them utilizing a variety of techniques to and Central Africa strategy (IUCN SSC Cat Specialist
allow for safe and efficient use of immobilization darts Group 2006a).
using a Pneudart Projector model 389. Lions were located
by tracking, using ‘‘call-up’’ vocalizations, at kills, and DNA extraction and amplification
using local knowledge of wildlife guides. Once located and
a focal animal selected, lions were approached to within 50 DNA extraction and amplification of mitochondrial cyt-b,
meters in a 4WD vehicle. A 2.0 ml aluminum Pneu-Dart primer sequences, and PCR conditions followed descrip-
projectile with a 100 barbed needle was filled using a tions in Dubach et al. (2005). We amplified 11 microsat-
combination of teletamine/zolazepam (Telazol) and xyla- ellite loci that map to different chromosomes in the
zine (250/200 mg, respectively for males and 167/133 mg, domestic cat (Felis catus; lions share the same diploid
respectively for females) and shot into the deep muscle number, 2n = 38): FCA14, FCA26, FCA30, FCA45,
layers of the shoulder or rump, depending on the animal’s FCA77, FCA94, FCA96, FCA126, FCA132, FCA187, and
orientation. After immobilization and stabilizing anesthe- FCA191 (Menotti-Raymond et al. 1999). Amplification
sia, animals were examined and biological samples col- was carried out using 40–90 ng genomic DNA in a 12.5 ul
lected. Blood was taken from one of two venapuncture reaction volume containing 0.5 U TAQ polymerase (Pro-
sites: males were bled from the medial femoral vein using mega, Madison, WI), 0.2 mM dNTPs, 1X reaction buffer,
the BD Vaccutainer System with 100 18 ga. needles, a 4 pmol each primer, and 1.5 mM MgCl2 (1.1 mM MgCl2
plastic collection sleeve and the BD vaccutainer tubes. was used for FCA30 and FCA191). The following PCR
Females were collected utilizing the same method and conditions were used for all loci: initial denaturation at
equipment, but preferentially from the jugular vein. Blood 94 °C for 5 min, 35 cycles (94 °C for 30 s; 48.0–65.0 °C
was drawn into multiple tubes for a variety of testing. for 45 s; 72 °C for 45 s), followed by a 10 min dwell at
123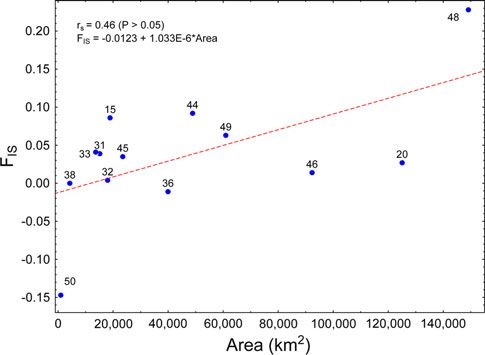
Conserv Genet

Table 1 Lion Conservation Units (LCUs) evaluated in this study
LCU           Name                          Area (km2)           Category           Percent gazetted          Population size          Trend

15            Laikipia-Samburu               18,910              I                 \25                        350                      Stable
20            Maasai Steppe                 125,050              I                  25–50                    [1,000                    Declining
31            North Luangwa                  15,166              I                 [50                        100–250                  Stable
32            South Luangwa                  18,012              I                 [50                        250–500                  Stable
33            Petauke Corridor               13,681              III               [50                       \50                       Stable
36            Kafue                          39,964              I                 [50                        250–500                  Stable
38            Sioma Ngwezi                    4,249              III               [50                       \50                       Uncertain
44            Etosha-Kunene                  48,889              I                 [50                        315–595                  Increasing
45            Khaudum-Caprivi                23,522              II                 25–50                     100–200                  Stable
46            Okavango-Hwange                92,323              I                 [50                        2,300                    Stable
48            Kgalagadi                     149,121              I                 [50                       500–1,000                 Stable
49            Greater Limpopo                60,957              I                 [50                       [2,000                    Increasing
50            Hluhluwe-Umfolozi                 989              II                [50                        80                       Stable
Data mainly from IUCN SSC Cat Specialist Group (2006b). LCU categories are: I, viable; II, potentially viable; or III, significant but of doubtful
viability. ‘Percent gazetted’ refers to the proportion under any form of legal protection (national park or reserve, hunting concession, or
conservancy). Areal measurements obtained from metadata used in preparing the maps (www.panthera.org)
LCU number (local populations sampled) 15 (Aberdares), 20 (Tsavo West, Tsavo East), 31, 32, 33, 36 (various), 38 (Sioma Ngwezi), 44 (Etosha,
Kunene), 45 (Botswana Gate, Kwando, Bushmanland, Caprivi Strip) 46 (various), 48 (Kgalagadi), 49 (Fannie Roberts, Sabi Sands), 50
(Umfolozi)

72 °C in a Bio-rad iCycler (Bio-rad Laboratories, Hercules,                 instead (Yamaguchi and Haddane 2002; Barnett et al.
CA). Annealing temperature was 48 °C for FCA132; 53 °C                      2006a). The subroutine CLUSTALW was implemented
for FCA26 and FCA45; 58 °C for FCA14 and FCA30;                             using default parameters to insure correct alignment; no
65 °C for FCA187; and 50 °C for the remaining five loci.                    gaps, insertions or deletions were encountered. Neighbor-
Gradient analysis on the iCycler was used to determine the                  joining (NJ), maximum parsimony (MP) and maximum
optimal annealing temperature and magnesium concentra-                      likelihood (ML) approaches were used to recover hierar-
tion for each primer. All forward primers were labeled with                 chical relationships among the 20 unique lion sequences;
Well-Red dyes for electrophoresis on a Beckman/Coulter                      transitions and transversions at all three codon positions
CEQTM8000XL DNA Analysis Genotyping System                                  were examined as were amino acid substitutions. Because
(Beckman Coulter, Fullerton, CA) and fragments were                         ML offers better performance in the face of substitution
sized using System Software version 8.0.                                    bias, only those results are presented below. MEGA 5.0
                                                                            and the Akaike Information Criterion statistics it generated
Mitochondrial data analysis                                                 were used to assess models of nucleotide substitution for
                                                                            use in the ML analysis. The stability of the resulting tree
Complete cytochrome-b sequences for 75 lions and two                        was assessed with 10,000 bootstrap replicates.
outgroups (GenBank accession numbers P. tigris KC495059                        A haplotype substitution network was constructed using
and P. pardus EF551002) were obtained and aligned by eye                    the median-joining option of Network 4.6.1.0 (Bandelt
using MacDNASIS v3.2 (Hitachi Software Engineering                          et al. 1999). All 117 lions (75 from our analyses, 42 from
America, Ltd.), then submitted to Mega 5.0 (Tamura et al.                   GenBank) and two outgroups were used in the network
2011). The lions exhibited 11 different haplotypes                          analyses. Following convention, network nodes are either
(KC495048-KC495058; see Supplemental Table 1).                              sequences from the dataset or median vectors, and the links
   We obtained 42 additional cyt-b sequences for Recent                     are nucleotide differences. A median vector is a hypo-
Panthera leo from GenBank (GU131164-GU131185,                               thetical sequence required by maximum parsimony to
AY781195-AY781210, DQ018993-DQ018996), repre-                               connect existing sequences within the network.
senting nine additional haplotypes, many of them produced                      Coordinates for all localities were determined with the
by Bertola et al. (2011). Samples obtained in Morocco,                      Geographic Names Server (http://geonames.nga.mil/ggmagaz/)
from the Rabat Zoo and supposedly descended from Bar-                       and plotted using ArcMap 9.2 (www.esri.com). The layer for
bary lions, have a complicated history that includes the                    Lion Conservation Units was developed and kindly pro-
possibility that they originated in West or Central Africa                  vided by Panthera (www.panthera.org).

123
Conserv Genet
Microsatellite data analysis haplotype groups and geographic distances between group
centroids was analyzed. Half-matrices of microsatellite
Genotype accuracy was verified by random reamplification FST/(1-FST) values for LCU groups and geographic dis-
of approximately 10 % of each population for each locus tances between centroids as ln(distance) were also ana-
and sizing several of the same PCR reactions at each lyzed. Both sets of data were tested using a Mantel
capillary change. In addition, allele size and consistency of Nonparametric Test Calculator Shareware V. 2.0 with
allele binning over time was monitored graphically by 1,000 permutations implemented in the program, Mante-
entering the fragment size for each reaction into a Micro- lese (Liedloff 1999) without transformation. Samples from
soft Excel spreadsheet for each locus. Uganda and LCU 38 were not used in the microsatellite
To measure within-population differentiation, we used analysis because an FST value cannot be calculated for a
Microsatellite Toolkit v 3.1 (Park 2001) to calculate allele single sample and the provenance of the former was
frequency, observed and expected heterozygosity and to uncertain.
convert data files for other applications. Observed and Spearman rank correlations and simple linear regres-
expected heterozygosity over all loci per population were sions were used to assess relationships between pairs of
also calculated using GENEPOP version 4.0.10 (Raymond demographic, geographic, and genetic variables across the
and Rousset 1995). Analyses were conducted on popula- LCUs. A P \ 0.05 value was deemed significant. Analyses
tions organized by haplotype groups, in the case of mito- were implemented in STATISTICA v. 7.1 (StatSoft Inc
chondrial sequences, and by Lion Conservation Units for 2005).
both sequence and microsatellite data. STRUCTURE version 2.2 (Pritchard et al. 2000, 2003)
Fisher’s exact tests of Hardy–Weinberg Equilibrium was used to determine the number of incipient subpopu-
(HWE) were run across all loci within each population lations (K) using the data organized by haplotype groups
using the Markov chain method (Guo and Thompson 1992) (K = 10; haplotypes j and k were combined because each
using GENEPOP version 4.0.10 (Raymond and Rousset was represented by a single individual) and by LCU and
1995). Linkage disequilibrium was assessed using GENE- other regional groups (K = 15). This clustering analysis
POP (1,000 dememorizations, 100 batches, and 1,000 assigns probabilities of each individual’s genotype to pre-
iterations per batch) with Bonferroni correction (a = 0.05; determined numbers of subpopulations; ten repetitions for
P = 0.00454; Rice 1989) to determine if alleles at different each value of K = 1 to 15 for the LCU arrangements were
loci were randomly assorting (Frankham et al. 2002). explored. K was estimated using Markov Chain Monte
FSTAT (Goudet 2001) was used to calculate allelic rich- Carlo (MCMC) with a burn-in of 100,000 repetitions
ness per locus and over all loci per sample via a rarefaction followed by 500,000 iterations. As significant gene flow
method and to estimate FIS for each population. was expected, the admixture model was used. The true
To measure genetic differentiation among populations, number of clusters was determined by calculating the
FSTAT was used to calculate FST, and the g-test (Goudet change in K (DK) as described in Evanno et al. (2005).
2001) was used to determine the significance of FST No prior information regarding clustering was used for
deviations from zero. Significance was adjusted for mul- this test.
tiple comparisons using Bonferroni correction (Rice 1989;
Sokal and Rohlf 1995). ARLEQUIN version 3.1 (Excoffier
et al. 2005) was used to determine significance of genetic Results
variation between populations and geographic groups of
neighboring populations using a hierarchical Analysis of Mitochondrial sequences
Molecular Variation (AMOVA) with 1,000 permutations.
Data for both analyses were grouped by mitochondrial Complete cytochrome-b sequence (1,140 bp) was obtained
clades (three [two arrangements] and five groups) and by for 77 individuals, including 75 lions and two Panthera
LCU (four, six, and eight groups [two arrangements]) to species used to root the tree. Overall, we identified 11
determine if mitochondrial haplotype variation and nuclear haplotypes (a–k, Fig. 2), 15 amino acid substitutions, and 9
microsatellite variation followed similar patterns. parsimony-informative substitutions within these sequen-
The number of migrants between all pairs of sample ces. One cluster of haplotypes (a–d, f) is widespread, found
sites (Nm) was estimated using the private allele method from Kenya and Uganda south to Namibia, while the other
(Barton and Slatkin 1986) in GENEPOP (Raymond and (haplotypes g–k) is restricted to Southern Africa. When
Rousset 1995). Isolation by distance was analyzed using these haplotypes are combined in analyses with previously
the program ISOLDE in GENEPOP (Raymond and Rous- documented ones (l–t), they represent much of the mito-
set 1995) with 1,000 permutations. For these Mantel tests, chondrial diversity identified within extant lions. The
half-matrices of uncorrected ‘‘P’’ values for mitochondrial maximum-likelihood phylogeny (Fig. 1) recovers lions as
123Conserv Genet
Fig. 1 Maximum-likelihood
bootstrap consensus tree (based
on 10,000 replicates) for 20 lion
haplotypes (a–t), using tiger and
leopard as outgroups. Branches
corresponding to partitions
represented in less than half the
bootstraps are collapsed, and the
percentage of replicate trees in
which the associated taxa
clustered together is shown next
to the branches. The tree is
drawn to scale, with branch
lengths measured in the number
of substitutions per site. There
were a total of 453 positions in
the final dataset
monophyletic in a sister-group relationship to leopard. vector representing their hypothetical common ancestor
Lions are grouped into two well-supported (bootstrap (Fig. 2).
[50 %) clusters: (1) lions from North, West and Central Pairwise genetic distances among haplotypes, assessed
Africa plus India (6 haplotypes), and (2) lions from Eastern as uncorrected P-values, were highest overall for West
and Southern Africa (14 haplotypes). The former group is African e, which differed most from South African h (LCU
clearly (bootstrap [50 %) subdivided into three clusters: 49, Sabi Sands; P = 0.123) and least from East African
the Gir Forest sample (r), North and Central Africa (e–s–t), f (Uganda, central Kenya, and Somalia; P = 0.079). The
and West Africa (p–q). Lions from Eastern and Southern h haplotype also differs greatly (P = 0.088) from the
Africa are more diverse but more weakly clustered. There b haplotype also found in LCU 49 and 50 and is closest
is a weak partition between Eastern and Southwestern lion (P = 0.044) to g in northern Namibia (LCU 44). In similar
populations, with lions from Botswana appearing in both fashion, lions with d (LCU 48, Kalahari) were distant from
clusters. other southwestern populations (P = 0.09–0.10 with j and
Historical relationships of the mitochondrial haplotypes k in neighboring LCU 44) and much closer genetically
are more clearly evident in the substitution network (P = 0.026) to b samples, despite their distribution in
(Fig. 2). The network is rooted by leopard and tiger, lying Kenya, Zimbabwe, and South Africa.
35 and 48 substitutions distant, respectively; each connects
to the lion network via a different median vector, and each Microsatellite genotypes
lies adjacent to a different cluster of lion haplotypes.
Haplotypes g–n stem from the median vector with tiger, A total of 480 lions were genotyped for 11 microsatellite
and represent lion populations from Southern Africa loci. Deviation from Hardy-Weinburg equilibrium showed
(Namibia, Botswana and South Africa). Haplotypes a–d, f, no heterozygote excess in any population or locus. After
and o lie adjacent to the leopard vector and span popula- Bonferroni correction, a significant heterozygote deficit
tions throughout Eastern and much of Southern Africa was found for two LCUs, 44 and 45, over four loci. Known
(from Ethiopia and Somalia to Botswana and South first-order family groups in Etosha were included in the
Africa). The cluster of haplotypes from India and North, analysis, which likely bias these results (Marshall et al.
West and Central Africa is recovered as highly derived; e, 1998; Lyke 2008). When known offspring were removed,
s, t, p, q and r all lie within 5 substitutions from the median only FCA14 showed a significant heterozygote deficit.
123Conserv Genet
Fig. 2 A substitution network
for 120 cyt-b gene sequences
produced by NETWORK
4.6.1.0. Node color corresponds
to haplotype source (yellow,
generated by this study; blue,
obtained by others; red, median
vectors or hypothetical states
inferred by maximum
parsimony), and node size
corresponds to haplotype
frequency. Each hatch mark
represents a unique base-pair
substitution. Separate nodes
connecting this network with
leopard and tiger represent
unresolved uncertainties at the
root of this evolutionary
network. See text for discussion.
(Color figure online)
There were no deficiencies observed for any locus across Table 2 Analyses of 11 cyt-b haplotypes and 11 microsatellite loci
all populations. data for 13 LCUs plus three other sampling areas (U, Uganda; W,
Significant linkage disequilibrium was observed for Cameroon; Z, Zimbabwe)
several pairs of loci in 9 of 15 groups. However, no pair of LCU H N A Ar Ap Ho He Signif FIS
loci was significantly linked over all groups, and all loci
used here map to different chromosomes in the domestic 15 1 4 3.27 1.64 2 0.614 0.636 ns 0.041
cat, Felis catus (Menotti-Raymond et al. 1999). Conse- 20 1 17 6 1.73 2 0.709 0.728 ns 0.027
quently, we retained all loci in subsequent analyses. 31 1 18 5.3 1.73 1 0.702 0.73 ns 0.039
Genetic variation within LCUs: Heterozygosity levels 32 1 9 4.7 1.7 1 0.697 0.699 ns 0.004
range from 33 % for lions in LCU 48 (Kgalagadi) to 71 % 33 1 6 4.1 1.72 0 0.694 0.721 ns 0.041
for lions in LCU 20 (Maasai Steppe; Table 2). Observed 36 2 28 5.6 1.68 0 0.685 0.677 ns -0.011
and expected heterozygosity levels differed significantly in 38 1 1 1.5 1.55 0 0.545 0.545 ns 0
LCUs 44 and 45. When sampling areas within each 44 4 190 6 1.64 14 0.583 0.641 *** 0.092
(Kunene and Etosha in LCU 44 and Chobe Gate, Kwando, 45 2 76 6.4 1.7 9 0.679 0.704 *** 0.035
Caprivi Strip, and Bushmanland in LCU 45) were analyzed 46 1 24 4.8 1.63 1 0.617 0.626 ns 0.014
separately, only the Etosha population showed significant 48 1 3 2 1.41 6 0.333 0.412 ns 0.228
differences. LCU 44 and 45 also had the largest sample 49 2 12 5 1.73 2 0.682 0.725 ns 0.063
sizes (Table 2) and the highest number of alleles and pri- 50 1 32 3.1 1.39 1 0.443 0.388 ns -0.147
vate alleles before adjusting for sample size. After adjust- U 1 1 1.82 1.64 0 0.818 0.818 ns 0
ment for sample size, the average number of alleles is W 1 5 2.8 1.58 4 0.632 0.582 ns -0.099
similar across LCUs, with LCU 50 (Hluhluwe-Umfolozi) Z 54 5.1 1.66 3 0.633 0.661 ns 0.042
showing the lowest value. Private alleles were observed in
Tabulations include the number of H haplotypes observed, N sample
all units except LCUs 33, 36 and 38 (Petauke, Kafue, and size, A average number of alleles, Ar allelic richness, Ap number of
Sioma Ngwezi, all in Zambia). private alleles, Ho observed heterozygosity , He expected heterozy-
Correlating genetic variability with attributes of the gosity, Signif significance level for deviation from Hardy–Weinberg
Equilibrium, FIS inbreeding coefficient
LCUs yields few predictable relationships (Table 3). In
Significance: ns = P [ 0.05, ***P B 0.001
fact, there is an unexpected positive relationship between
123Conserv Genet
Table 3 Spearman rank-correlation matrix among physical and genetic attributes of 13 LCUs in Eastern and Southern Africa
LCU Population Population Area Number Number Hapotypes N A Ar Ap Ho He
category size trend (in of of per
(I, II, III) km2) sequences haplotypes sequence
Population size -0.764
Trend -0.157 0.266
Area -0.637 0.887 0.219
(in km2)
Number of -0.077 0.352 0.193 0.432
sequences
Number of -0.058 0.21 0.439 0.271 0.803
haplotypes
Haplotypes -0.012 -0.299 0.217 -0.368 -0.705 -0.178
per sample
N 0.121 0.138 0.01 0.071 0.788 0.609 -0.513
A -0.215 0.338 0.187 0.386 0.855 0.651 -0.642 0.725
Ar -0.29 0.083 0.108 0.077 0.22 0.054 -0.368 -0.033 0.512
Ap -0.199 0.434 0.276 0.566 0.383 0.416 -0.121 0.302 0.424 0.054
Ho -0.29 0.069 -0.061 0.005 0.195 -0.041 -0.407 0.049 0.526 0.863 -0.214
He -0.29 0.083 0.108 0.077 0.22 0.054 -0.368 -0.033 0.512 1 0.054 0.863
FIS -0.377 0.287 0.208 0.462 0.084 0.189 0.134 -0.203 0.077 0.275 0.654 -0.104 0.275
Boldfaced entries indicate coefficients are significant at the P \ 0.05 level
(i.e., Eastern vs. Southwestern populations). Lions from
LCU 48 (Kgalagadi) differed significantly from lions in
LCUs 44, 45 and 46 (Namibia, Botswana and Zimbabwe),
but not from LCUs 31, 32, 33, 36, 20, and W lying much
farther away (in Zambia, Kenya, and Cameroon). Finally,
LCU 33 (Petauke Corridor in Zambia) only differed sig-
nificantly from LCUs 44, 46, 50, and Z (in Namibia,
Botswana, South Africa, and Zimbabwe), suggesting that a
major genetic division crosses Zambia.
AMOVA partitions genetic variance among the micro-
satellites into three categories: within populations, among
populations within groups, and among groups. Table 5
shows the variances for each level, grouping samples either
by haplotype or by the geographic proximity of LCUs.
Fig. 3 Relationship between the inbreeding coefficient FIS and LCU
Several different arrangements were assessed to identify
area. Points are labeled with LCU numbers. The points are loosely groupings that minimized the among-population/within-
fitted by a line of the form FIS = -0.0123 ? 1.033E - 6*area group variance and maximized the among-group variation.
Only partitions with the highest among-group percent
LCU area and FIS (rs = 0.65; P \ 0.05). As shown by the variation for each classification are included. All levels of
scatter plot (Fig. 3), this relationship depends importantly variation for both cladistic and geographic groupings were
on genetic estimates for two LCUs, Kgalagadi (48) and significant. When populations are combined into three
Hluhluwe-Umfolozi (50). The former was represented by regional haplotype groupings, the among-group variance
only three individuals, while the latter was founded by explained was high (FCT = 6.02; Table 5). However, when
introduced females and bottlenecked by management the three groupings followed haplotype clades as indicated
(Maddock et al. 1996). in Fig. 2 (Haplotype clades: 1 = a, b, c, d, f; 2 = g, h, i, j,
Genetic variation among LCUs: We found significant k; 3 = e), among-groups variance was lower (FCT = 4.45;
genetic differentiation among all LCUs tested (Table 4). not shown). Grouping populations by LCUs yielded the
Virtually all pairwise comparisons were significant, espe- highest among-group genetic variance (FCT = 12.14). For
cially for pairs belonging to different haplotype groups the LCU arrangements, the higher the number of groups,
123Conserv Genet
Table 4 Genetic differentiation among 12 lion conservation units (LCUs) and two other areas located throughout Africa
LCU 15 20 31 32 33 36 44 45 46 48 49 50 W
20 00.103*
31 00.118* 0.050***
32 00.154 0.072** -0.005
33 00.133 0.029 0.027 0.033
36 00.147** 0.089*** 0.044*** 0.050 0.052
44 00.210*** 0.169*** 0.164*** 0.160*** 0.160*** 0.149***
45 00.145*** 0.091*** 0.049*** 0.064*** 0.033 0.029*** 0.132***
46 00.225** 0.142*** 0.100*** 0.117*** 0.077** 0.043*** 0.180*** 0.030***
48 00.359 0.245 0.248 0.298 0.258 0.263* 0.268** 0.285* 0.285*
49 00.131 0.077*** 0.075*** 0.079** 0.037 0.065*** 0.180*** 0.060*** 0.072*** 0.237
50 00.391** 0.239*** 0.296*** 0.309*** 0.206** 0.224*** 0.312*** 0.215*** 0.265*** 0.482* 0.221***
W 00.272 0.189* 0.190* 0.190 0.170 0.201** 0.251*** 0.191*** 0.241** 0.435 0.191 0.397**
Z 00.185*** 0.128*** 0.130*** 0.111*** 0.104*** 0.109*** 0.165*** 0.119*** 0.157*** 0.318** 0.117*** 0.186*** 0.137***
FST values and level of significance are given for all pairwise comparisons. LCU38 and Uganda were each represented by a single lion and could not be included in
comparisons
Significance: *P B 0.05, **P B 0.01, ***P B 0.001
Table 5 Hierarchical analysis of molecular variation (AMOVA) in microsatellite loci among three clades of mitochondrial haplotypes and
among 13 lion conservation units, combined arbitrarily into eight geographic cluster
Source of Variation Haplotypes LCUs
3 groups 8 clusters
Fixation Percentage Fixation Percentage
Index Variance Index Variance
Within LCUs: FST 0.177 83.23*** 0.164 83.58***
Among LCUs within groups: FSC 0.114 10.75*** 0.049 4.29***
Among groups: FCT 0.06 6.02* 0.121 12.14***
The fixation index and percent variation is given for three partitions: within populations (Vc and FST), among populations within groups (Vb and
FSC), and among groups (Va and FCT). Haplotype regions: 1 = a, c, h, i; 2 = b, e, f; 3 = g, k, j
LCU geographic clusters: 1 = 15, 20; 2 = 31, 32, 33, 36; 3 = 38, 45, 46, 49; 4 = 44; 5 = 48; 6 = 50; 7 = W; 8 = Z
Significance: *P B 0.05, **P B 0.01, ***P B 0.001
the more among-group variance was explained, suggesting microsatellite loci separate them from Eastern lions and
that there isn’t widespread movement of lions and they are ally them in a central area with high levels of admixture
structured by unit. The different results obtained for hap- (e.g., Chobe Gate in LCU 45). Admixture characterizes
lotype and microsatellite groupings may be due to the most lions in LCU 45, including those from northern
different time frames, ancient or more recent, that each Botswana and Khaudum-Caprivi, but lions from Bush-
represents. manland form a distinctive cluster (Fig. 5).
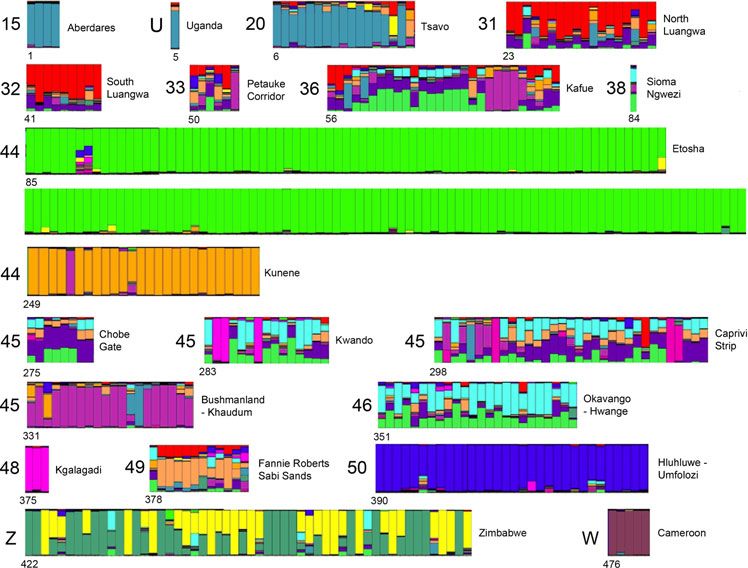
STRUCTURE diagrams drawn to reflect groupings by Evidence of translocation is apparent in STRUCTURE
haplotype and by LCU depict genetically distinct popula- results for LCU 49 (Greater Limpopo), specifically lions
tions for each set of partitions, but the plot of DK suggests from Sabi Sands (the last six bars). Whereas the mito-
that there are only two groups of lions: lions from Etosha chondrial haplotype h groups these lions with the South-
National Park and all other lions (Fig. 5). Regardless of the western clade, their microsatellites place them with LCU
number of populations or how they are grouped, Etosha 45 (Khaudum-Caprivi). One lion from LCU 49 (first bar in
lions remain genetically distinct from all others. The the group) entered a captive breeding program from the
highest levels of genetic heterogeneity or admixture can be Transvaal region but appears to group instead with Zam-
seen in northern Botswana and eastern Namibia through bian lions. LCU 48 (Kgalagadi) lions, which group with the
eastern Zambia (LCUs 33, 36, 38, 45, and 46). Lions in Eastern clade in terms of haplotypes, have a unique
Botswana and Zambia possess the a haplotype, grouping STRUCTURE assignment; without additional samples
with the Eastern clade and haplotypes network, but their from this region and areas to the east, it is impossible to
123Conserv Genet
determine the geographic affinities of this population. African lions currently encompass more genetic variation,
Finally, the STRUCTURE diagram indicates long-distance which favors an Africa-to-Asia polarity, but Indian lions
movements by lions in Namibia. A lion branded in Etosha endured a severe late-19th century bottleneck, offering a
National Park (#253, purple bar) moved west to Kunene ready explanation for their reduced variation. The existing
(also LCU 44), but its microsatellites are shared with LCU variation in West and Central Africa may all have arisen
45 (Bushmanland), still farther to the east. More generally, subsequent to back-colonization, which Bertola et al.
LCU 44 is clearly comprised of two genetically distinctive (2011) hypothesized as late Pleistocene in age. Although
populations: the Kunene region and Etosha National Park. Schnitzler (2011) stated that the earliest records for Pan-
Movement among regions: The prevalence of private thera leo in India date to the late Holocene, lions are
alleles, the number of migrants (Nm = 0.25 individual/ recorded from the late Pleistocene in Sri Lanka (Dera-
generation), and the isolation-by-distance analyses all niyagala 1939; Manamendra-Arahchi et al. 2005).
suggest that there is little movement among major geo-
graphic regions. Isolation-by-distance analyses were sig- Taxonomy
nificant for both mitochondrial haplotypes (rs = 0.512;
P \ 0.005) and microsatellite loci (rs = 0.528; P \ 0.01). Patterns of mitochondrial variation also have implications
for lion taxonomy. Two subspecies are currently recog-
nized by IUCN as management units within Panthera leo:
Discussion P. l. leo for all extant African populations and P. l. persica
for extant Asian lions. In conflict with this view, phylo-
Phylogeography genetic reconstructions robustly recover a major dichotomy
within lions that separates lions in Asia and North, West
A haplotype substitution network constructed by Barnett and Central Africa from those in Eastern and Southern
et al. (2009) from the mt-DNA hypervariable region HVR1 Africa. Haplotype substitution networks also confirm the
identified haplotype X (from Tanzania) at the root of their intimate connections among Asian and North, West and
network for modern lions. Our cyt-b network, rooted with Central African lions. Because the name Panthera leo
both leopard and tiger, is equivocal concerning the ances- (Linnaeus 1758) is based on the Barbary lion, a North
tral lion haplotype: either the Southwestern clade (haplo- African member of this group, the names leo and persica
types g–n) or the Eastern and Southern clade (a–d, f, o) is both apply to the same branch of this dichotomy. The
recovered as basal, depending on whether tiger or leopard oldest name available for the other branch of this dichot-
is used to root the network. However, both rootings omy is P. l. melanochaita (Smith, 1858), originally pro-
underscore the highly derived position of Asian lions, posed for the now-extinct Cape lion. Barnett et al. (2006a)
which are nestled far from the root within a cluster of showed that Cape lions were likely indistinguishable from
North, West, and Central African haplotypes. Barnett et al. other Southern African lions, their extensive manes merely
(2009) used Pleistocene lion sequences in their analysis, a developmental consequence of temperate climates
which provide a closer outgroup to modern lions and better (Patterson et al. 2006).
insights on the polarity of change than more distantly Despite recent shared ancestry, Asian lions tend to differ
related species of Panthera. Although complete cyt-b morphologically from those in North, West, and Central
sequences for Panthera spelaea have been analyzed Africa. Characteristically, Asian lions have a longitudinal
(Burger et al. 2004), those sequences are not publicly belly fold, less inflated auditory bullae, and more fre-
accessible. quently divided infraorbital foramina (Pocock 1931),
Other studies (Barnett et al. 2006a, 2006b; Bertola et al. although these are not qualitative differences (Yamaguchi
2011) have also recovered Asian lions amidst North, West, et al. 2009). These differences may result from relatively
and Central African forms. Bertola et al. (2011) argued that recent interruptions to gene flow and effects of small
such proximity was attributable to the Pleistocene extinc- population size in the remaining Asian lions (Todd 1966).
tion and subsequent recolonization of North and West Nevertheless, limited population size (\400 individuals)
Africa from Asian or Middle Eastern refugia. Both out- and its unique claim to being Asia’s only surviving lion
group rooting and the limited genetic diversity of that clade population make it unreasonable to deny taxonomic rec-
suggest that it is younger and derived from lions in Eastern ognition to P. l. persica. Instead, members of this clade
or Southern Africa. But genetic variation offers no more from North, West and Central Africa deserve equal rec-
evidence that North and West African lions were derived ognition as P. l. leo, which itself is in desperate need of
from Asian ancestors than for the reverse, i.e., that the concerted conservation attention (Bertola et al. 2011).
Asian range was colonized (or re-colonized) by a lion At present, it is difficult to resolve the taxonomy of lions
dispersing from North or West Africa. West and Central in Eastern and Southern Africa, which are all regarded here
123Conserv Genet
Fig. 4 Map of 20 cyt-b haplotypes (a–t) for Panthera leo across the Southern Africa. The dotted line follows the principal genetic
lion’s historic range. The map also shows the positions of 13 Lion subdivision in extant lions. Question marks identify lion conservation
Conservation Units (LCUs) across the lion’s range in Eastern and areas with unknown affinities
as P. l. melanochaita. Despite their greater genetic vari- network (Fig. 2), but falls near its base of the maximum-
ability (presenting at least 14 cyt-b haplotypes versus 6 for likelihood phylogeny (Fig. 1). Our single sample from
all other lions sampled; Fig. 4), the phylogenetic analysis Uganda could not be localized, but shared both mito-
does not reliably identify clades (low bootstrap values in chondrial haplotype and microsatellite loci with lions from
Fig. 1). On the other hand, the haplotype substitution net- the Aberdares in Kenya (LCU 15). Contact between East-
work (Fig. 2) clearly separates haplotypes from east of the ern and Central lineages probably occurs in South Sudan
Great Rift system (haplotypes a–d, f, and o) from those in and the Central African Republic, and if multiple geno-
Southern and Southwestern Africa (g, h–m), in keeping types are present there, equivocal relationships would be
with earlier phylogeographic appraisals (Dubach et al. expected. Our single sample from Angola also shared the
2005). Until additional genetic sampling and accompany- Central African haplotype e with lions from Cameroon,
ing morphological analyses can provide clearer evidence of Chad and, perplexingly, the zoo lions from Morocco (cf.
clades within this group, recognizing additional subspecies Barnett et al. 2006a). Relatively dense sampling in northern
in the range of P. l. melanochaita seems unwarranted. Namibia and the Caprivi Strip suggests that the boundary
Our conclusions regarding the distributions of both P. l. between the Central clade and both Eastern and South-
leo and P. l. melanochaita are ultimately limited by western lineages occurs somewhere in southern Angola and
restricted geographic sampling, especially in Central western Zambia.
Africa. Barnett et al. (2006a, 2006b) recovered a distinct
regional cluster of lions from Democratic Republic of Management considerations
Congo, Central African Republic, Sudan and Ethiopia in
their analysis of short (130 bp) control region sequences. These results bear on three areas of particular interest to
The cyt-b haplotype (o) recovered from Ethiopian lions lion conservation. First, genetic variation can be lost in
clearly falls within the Eastern-Southern clade in our small populations that are managed as isolated entities
123Conserv Genet Fig. 5 STRUCTURE classification of 13 LCUs and two other areas (K = 15) based on variation of 11 microsatellites among 480 lions. Individual samples are blocked by LCU (large numbers) and numbered sequentially within each named sequence (see Supplemental Table 1); sub- populations within these are identified in finer text. The plot reveals relatively homogeneous units (LCUs 15, 50 and W) and highly heterogeneous units (36, 45, and 46) indicative of admixture, as well as obvious composites (LCU 44) without natural immigration or gene flow, as seen in LCU The presence of private alleles in most LCUs indicates a 50 (Hluhluwe-Umfolozi). For managed populations threa- general lack of gene flow. The significant pattern of iso- tened by inbreeding where natural dispersal cannot be lation-by-distance for both mt-DNA and microsatellite data restored, relocations from surrounding areas that simulate corroborate this conclusion. However, some notable gene flow should be considered (Newman and Tallmon exceptions exist. Two sampled LCUs (44 and 45) con- 2002). The Hluhluwe-Umfolozi samples used in this study tained lions with heterogenous genetic characteristics. In were taken in 1992–1994, prior to a translocation, so that LCU 44, the size and range of the western (Kunene) pop- the current status of this population is not represented here. ulation has recently grown substantially, leading to gene Comparing our baseline with the current genetic status of flow with the eastern (Etosha) population. Moreover, a Hluhluwe-Umfolozi lions would gauge the measurable male lion with the genetic attributes of LCU 45 (Bush- effects of management-simulated gene flow on the genetics manland) was sampled in Kunene and known to breed of this population. there; this record appears in the STRUCTURE diagram Second, some historic lion translocations have clearly (Fig. 5) as the purple bar among the orange bars of LCU brought together different lineages, as is evident in LCU 44. In the second case, LCU 45 includes the Kwando area 49. Both the mt-DNA haplotype (h) and microsatellite data in Botswana, Caprivi Strip in Namibia, and Bushmanland (Fig. 5) of Sabi Sands lions suggest they originated in the in Namibia. Although these areas are in close geographic Southwestern region, possibly Botswana. These lions live proximity, lions in all three areas differ genetically. The near typical Eastern lions (the b haplotype extends from STRUCTURE chart indicates that lions from Bushmanland Hluhluwe-Umfolozi to eastern Kenya), setting up the are genetically the most distinctive (purple bars in LCU 45; possibility of human-caused hybridization between lin- Fig. 5); this genotype also appears present in LCU 36 in eages. Conceivably, this could lead to erosion of local Zambia. Conversely, lions from LCUs 31, 32, and 33 in adaptations and reproductive failures (Storfer 1999; Burke Zambia are not distinguished from one another; all lions we and Arnold 2001), although the capacity of lions for long- sampled possess the c haplotype and similar admixed distance dispersal must frequently test and/or disrupt such microsatellite complements. These three reserves lie in local adaptations. Future restoration efforts that rely on close proximity to one another and thus might be amal- translocations should utilize populations that are most gamated in future management as they would appear to similar genetically, effectively simulating gene flow by constitute a single LCU. Likewise, lions from Kwando and introducing compatible genotypes. Caprivi Strip (LCU 45) share the same haplotypes (a and 123
Conserv Genet

i) and microsatellites with populations in northeastern          Acknowledgments We thank Luke Hunter and Lisanne Petracca
Botswana (LCU 46). Genetic distinctions should be con-           for providing the GIS layer for the LCUs and Steve Judd for help
                                                                 editing the STRUCTURE diagram. JMD received partial funding
sidered alongside political, economic, and geographic ones       through a grant from the Conservation Medicine Center of Chicago,
in delimiting and managing LCUs.                                 from N. Alberts, and from Drs. Kalina. MBB thanks the Namibian
   Third, both haplotypes and microsatellites show a high        Ministry of Environment and Tourism for its support of fieldwork in
level of admixture along the border of Botswana, Namibia,        Etosha, Bushmanland, and the Caprivi Strip. He also thanks the
                                                                 Botswana Department of Wildlife and National Parks for its support
and Zambia (Fig. 5). Individuals from the Caprivi Strip,         of fieldwork in collection of all samples originating in Botswana.
northern Botswana, and southwestern Zambia possess               PAW thanks the Zambia Wildlife Authority for permission to conduct
either the a or b haplotypes characteristic of the Eastern       this research, the Professional Hunters Association of Zambia for
lineage or the i haplotype typical of the Southwestern           their kind assistance with all aspects of the field work, and the Safari
                                                                 Club International Foundation, Dallas Safari Club, Shikar Safari Club
lineage (Fig. 4). These same individuals are also uncer-         and several individual donors for their generous support. BDP thanks
tainly classified to LCU by the STRUCTURE analysis               the Earthwatch Institute (#5123, 2002–2009), Field Museum of Nat-
(Fig. 5), in sharp contrast to lions elsewhere (cf. LCU 15,      ural History (Barbara E. Brown and Marshall Field Funds), and Dr.
44, or 50). Both patterns suggest substantial lion move-         S. Kasiki of the Kenya Wildlife Service for support and facilitation in
                                                                 the field. We gratefully acknowledge two anonymous reviewers
ments throughout this area–polymorphism of haplotypes            whose comments improved the value of this contribution.
and substantial genetic exchange in the case of nuclear
elements. This region appears to be an area of naturally
high genetic diversity among adjoining lion populations          References
and one of the few documented contact zones between the
Eastern and Southwestern clades. Genetic indications of          Anderson J (1981) The re-establishment and management of a lion
lion movements across this area are corroborated by direct            Panthera leo population in Zululand, South Africa. Biol Conserv
                                                                      19:107–117
observations. Radio-and satellite-telemetry studies docu-        Antunes A, Troyer JL, Roelke ME, Pecon-Slattery J, Packer C,
ment trans-boundary movements of lions in this region (L.             Winterbach C, Winterbach H, Hemson G, Frank L, Stander P,
Hanssen, pers. comm.), sometimes even crossing sub-                   Siefert L, Driciru M, Funston PJ, Alexander KA, Prager KC,
stantial rivers. We have also documented movements of                 Mills G, Wildt D, Bush M, O’Brien SJ, Johnson WE (2008) The
                                                                      evolutionary dynamics of the lion Panthera leo revealed by host
individual lions or prides between Hwange (Zimbabwe) to               and viral population genomics. PLoS Genet 4:1–11
Livingstone (Zambia); Mana Pools (Zimbabwe) to the               Bandelt HJ, Forster P, Röhl A (1999) Median-joining networks for
Lower Zambezi (Zambia); Victoria Falls (Zimbabwe) to                  inferring intraspecific phylogenies. Mol Biol Evol 16:37–48
Livingstone (Zambia); Caprivi (Namibia) to Sioma Ngwezi          Barnett R, Yamaguchi N, Barnes I, Cooper A (2006a) Lost populations
                                                                      and preserving genetic diversity in the lion Panthera leo:
(Zambia; P. White, pers. comm.), and from Kwando,                     implications for its ex situ conservation. Conserv Genet 7:507–514
Botswana into Namibia (M. Briggs, pers. comm.). Given            Barnett R, Yamaguchi N, Barnes I, Cooper A (2006b) The origin,
the extent and frequency of these movements, maintaining              current diversity and future conservation of the modern lion
habitat connectivity in this region should be a conservation          (Panthera leo). Proc R Soc Lond B 273:2119–2125
                                                                 Barnett R, Shapiro B, Barnes I, Ho SYW, Burger J, Yamaguchi N,
priority.                                                             Higham TFG, Wheeler HT, Rosendahl W, Sher AV (2009)
   Individual lions can be very wide-ranging, with lions in           Phylogeography of lions (Panthera leo ssp.) reveals three
Waza National Park, Cameroon, having a mean home-                     distinct taxa and a late Pleistocene reduction in genetic diversity.
range size of 630 km2 (Bauer and de Iongh 2005) and lions             Mol Ecol 18:1668–1677
                                                                 Barton N, Slatkin M (1986) A quasi-equilibrium theory of the
in Kgalagadi Transfrontier Park regularly ranging over as             distribution of rare alleles in a subdivided population. Hered
much as 1,450 km2 (Funston 2011). Despite such move-                  56:409–416
ments, both haplotypes and microsatellites show significant      Bauer H, de Iongh HH (2005) Lion (Panthera leo) home ranges and
isolation-by-distance effects. Contemporary range collapse            livestock conflicts in Waza National Park, Cameroon. Afr J Ecol
                                                                      43:208–214
and fragmentation of lion populations has been too recent        Bauer H, Van Der Merwe S (2004) Inventory of free-ranging lions
to account for this pattern, which is probably a product of           Panthera leo in Africa. Oryx 38:26–31
the lion’s catholic habitat tolerances and its great potential   Bertola LD, van Hooft WF, Vrieling K, Uit de Weerd DR, York DS,
for dispersal.                                                        Bauer H, Prins HHT, Funston PJ, Udo de Haes HA, Leirs H
                                                                      (2011) Genetic diversity, evolutionary history and implications
   In summary, regional lion conservation and manage-                 for conservation of the lion (Panthera leo) in West and Central
ment plans should consider historic records that document             Africa. J Biogeogr 38:1356–1367
lion range and movement patterns, emphasizing the pro-           Björklund M (2003) The risk of inbreeding due to habitat loss in the
tection or restoration of landscape connectivity between              lion (Panthera leo). Conserv Genet 4:515–523
                                                                 Burger J, Rosendahl W, Loreille O, Hemmer H, Eriksson T,
LCUs. Results from this study may serve as guidelines in              Gotherstrom A, Hiller J, Collins MJ, Wess T, Alt KW (2004)
identifying and prioritizing potential movement corridors             Molecular phylogeny of the extinct cave lion Panthera leo
thereby maintaining naturally occurring genetic diversity.            spelaea. Mol Phylogen Evol 30:841–849

                                                                                                                             123
Conserv Genet
Burke JM, Arnold ML (2001) Genetics and the fitness of hybrids. Menotti-Raymond M, David VA, Lyons LA, Schäffer AA, Tomlin JF,
Annu Rev Genet 35:31–52 Hutton MK, O’Brien SJ (1999) A genetic linkage map of
Burton AC, Buedi EB, Balangtaa C, Kpelle DG, Sam MK, Brashares microsatellites in the domestic cat (Felis catus). Genomics
JS (2011) The decline of lions in Ghana’s Mole National Park. 57:9–23
Afr J Ecol 49:122–126 Newman D, Tallmon DA (2002) Experimental evidence for beneficial
Deraniyagala PEP (1939) Some fossil animals from Ceylon Part II. fitness effects of gene flow in recently isolated populations.
J R Asiatic Soc (Ceylon Br) 34:231–239 Conserv Biol 15:1054–1063
Dubach JM, Patterson BD, Briggs MB, Venzke K, Flammand J, O’Brien SJ, Martenson JS, Packer C, Herbst L, de Vos V, Joslin P,
Stander P, Scheepers L, Kays RW (2005) Molecular genetic Ott-Joslin J, Wildt DE, Bush M (1987) Biochemical genetic
variation across the southern and eastern geographic ranges of variation in geographic isolates of African and Asiatic lions. Nat
the African lion, Panthera leo. Conserv Genet 7:15–24 Geogr Res 3:114–124
Evanno G, Regnaut S, Goudet J (2005) Detecting the number of Packer C, Pusey AE, Rowley H, Gilbert DA, Martenson J, O’Brien SJ
clusters of individuals using the software structure: a simulation (1991) Case study of a population bottleneck: lions of the
study. Mol Ecol 14:2611–2620 Ngorogoro Crater. Conserv Biol 5:219–230
Excoffier L, Laval G, Schneider S (2005) Arlequin (version 3.0): an Packer C, Ikanda D, Kissui B, Kushnir H (2005) Lion attacks on
integrated software package for population genetics data anal- humans in Tanzania. Nature 436:927–928
ysis. Evol Bioinform Online 1:47–50 Park SJ (2001) Microsatellite Toolkit for Excel, v.3.1. Trinity
Frankham R, Briscoe DA, Ballou JD (2002) Introduction to conser- College. University of Dublin, Dublin
vation genetics. Cambridge University Press, Cambridge Patterson BD, Kasiki SM, Selempo E, Kays RW (2004) Livestock
Funston PJ (2011) Population characteristics of lions (Panthera leo) predation by lions (Panthera leo) and other carnivores on
in the Kgalagadi Transfrontier Park. S Afr J Wildl Res 41:1–10 ranches neighboring Tsavo National Parks, Kenya. Biol Conserv
Goudet J (2001) FSTAT, a program to estimate and test gene 119:507–516
diversities and fixation indices (version 2.9.3). Accessed on Patterson BD, Kays RW, Kasiki SM, Sebestyen VM (2006) Devel-
http://www.unil.ch./izea/softwares/fstat.html opmental effects of climate on the lion’s mane (Panthera leo).
Guggisberg CAW (1961) Simba, the life of the lion. Howard J Mamm 87:193–200
Timmins, Capetown Pocock RI (1931) The lions of Asia. J Bombay Nat Hist Soc
Guo SW, Thompson EA (1992) Performing the exact test of Hardy- 34:638–665
Weinberg proportion for multiple alleles. Biometrics 48:361–372 Pritchard JK, Stephens M, Donnelly P (2000) Inference of population
Hayward MW, Kerley GIH (2009) Fencing for conservation: structure using multilocus genotype data. Genetics 155:945–959
restriction of evolutionary potential or a riposte to threatening Pritchard JK, Wen W, Falush D (2003) Documentation for structure
processes? Biol Conserv 142:1–13 software: version 2. Department of Human Genetics, University
Hemmer H (1974) Zur Artgeschichte des Löwen Panthera (Panthera) leo of Chicago, Chicago, IL, pp 1–38
(Linnaeus, 1758). Veroff Zool Staatssamml München 17:167–280 Raymond M, Rousset F (1995) GENEPOP (version 1.2): population
Hunter LTB, Pretorius K, Carlisle LC, Rickelton M, Walker C, genetics software for exact tests and ecumenicism. J Hered
Slotow R, Skinner JD (2007) Restoring lions Panthera leo to 86:248–249
northern KwaZulu-Natal, South Africa: short-term biological Rice WR (1989) Analyzing tables of statistical tests. Evolution
and technical success but equivocal long-term conservation. 43:223–225
Oryx 41:196–204 Riggio J, Jacobson A, Dollar L, Bauer H, Becker M, Dickman A,
IUCN (2012) IUCN Red List of Threatened Species. Version 2011.2 Funston P, Groom R, Henschel P, Iongh Hd, Lichtenfeld L,
IUCN SSC Cat Specialist Group (2006a) Conservation strategy for Pimm S (2012) The size of savannah Africa: a lion’s (Panthera
the lion in West and Central Africa. IUCN, Gland, pp 1–60 leo) view. Biodiv Conserv. doi:10.1007/s10531-10012-10381-
IUCN SSC Cat Specialist Group (2006b) Regional conservation 10534
strategy for the lion Panthera leo in Eastern and Southern Africa. Sanderson EW, Redford KH, Chetkiewicz CLB, Medellin RA,
IUCN, Gland, pp 1–60 Rabinowitz AR, Robinson JG, Taber AB (2002) Planning to
Kiffner C, Meyer B, Mühlenberg M, Waltert M (2009) Plenty of prey, save a species: the jaguar as a model. Conserv Biol 16:58–72
few predators: what limits lions Panthera leo in Katavi National Schnitzler AE (2011) Past and present distribution of the North
Park, western Tanzania? Oryx 43:52–59 African–Asian lion subgroup: a review. Mamm Rev 41:220–243
Liedloff AC (1999) Mantel Nonparametric Test Calculator. Version Smith H (1858) Introduction to mammalia. Jardine’s naturalist’s
2.0. School of Natural Resource Sciences, Queensland Univer- library 35:177
sity of Technology, Brisbane Sokal RR, Rohlf FJ (1995) Biometry: the principles and practice of
Linnaeus C (1758) Systema naturae per regna tria naturae, secundum statistics in biological research. WH Freeman, New York
classes, ordines, genera, species, cum charateribus, differentiis, StatSoft Inc (2005) Statistica (data analysis software system), version
synonymis, locis. 10th edn. Imprint Holmiae, Impensis L. Salvii 7.1. www.statsoft.com. Accessed 12 Apr 2006
Lyke MMK (2008) Molecular genetic analysis of African lion Storfer A (1999) Gene flow and endangered species translocations: a
(Panthera leo) population structure in Etosha National Park. topic revisited. Biol Conserv 87:173–180
Northeastern Illinois University Tamura K, Peterson D, Peterson N, Stecher G, Nei M, Kumar S
Maddock A, Anderson A, Carlisle F, Galli N, James A, Verster A, (2011) MEGA5: molecular evolutionary genetics analysis using
Whitfield W (1996) Changes in lion numbers in Hluhluwe- maximum likelihood, evolutionary distance, and maximum
Umfolozi Park. Lammergeyer 44:6–18 parsimony methods. Mol Biol Evol 28:2731–2739
Manamendra-Arahchi K, Pethiyagoda R, Dissanayake R, Meegas- Todd NB (1966) Metrical and non-metrical variation in the skulls of
kumbura M (2005) A second big cat from the late Quaternary of Gir lions. J Bombay Nat Hist Soc 62:507–520
Sri Lanka. Raffles Bull Zool 12:423–434 Trinkel M, Cooper D, Packer C, Slotow R (2011) Inbreeding
Marshall T, Slate J, Kruuk L, Pemberton J (1998) Statistical depression increases susceptibility to bovine tuberculosis in
confidence for likelihood-based paternity inference in natural lions: an experimental test using an inbred–outbred contrast
populations. Mol Ecol 7:639–655 through translocation. J Wildl Dis 47:494–500
123You can also read