Genetic worth of multiple sets of cowpea breeding lines destined for advanced yield testing
←
→
Page content transcription
If your browser does not render page correctly, please read the page content below
Euphytica (2021) 217:30
https://doi.org/10.1007/s10681-020-02763-y   (0123456789().,-volV)
                                                                 ( 01234567
                                                                         89().,-volV)

Genetic worth of multiple sets of cowpea breeding lines
destined for advanced yield testing
Patrick Obia Ongom . Christian Fatokun . Abou Togola . Oluwaseye Gideon Oyebode .
Mansur Sani Ahmad . Ishaya Daniel Jockson . Garba Bala . Ousmane Boukar

Received: 29 April 2020 / Accepted: 30 December 2020 / Published online: 29 January 2021
Ó The Author(s) 2021

Abstract The objective of this study was to deter-                                      significantly different, although genotype-by-location
mine genetic potentials in eight sets of cowpea lines                                   and set-by-location interaction effects were also
for grain yield (GY), hundred seed weight (HSDWT)                                       prominent. Genetic variance (d2G) and GCV were
and days to 50% flowering (DT50FL). A total of 614                                      high for GY in Prelim2 (d2G = 45,897; GCV =
F6 genotypes constituting the sets, grouped by matu-                                     19.58%), HSDWT in Prelim11 (d2G = 7.137; GCV =
rity, were evaluated across two locations in Northern                                    17.07%) and DT50F in Prelim5 (d2G = 4.54; GCV =
Nigeria, in an alpha lattice design, two replications                                    4.4%). Heritability varied among sets for GY
each. Data were recorded on GY, HSDWT and                                               (H = 0.21 to 0.57), HSDWT (H = 0.76 to 0.93) and
DT50FL.Variance components, genotypic coefficient                                       DT50FL (H = 0.20 to 0.81). GA and percentage GA
of variation (GCV), and genetic advance (GA) were                                       (GAPM) were high for GY in Prelim2 (GAPM =
used to decode the magnitude of genetic variance                                        24.59%; GA = 269.05Kg/ha), HSDWT in Prelim11
within and among sets. Genetic usefulness (Up) which                                    (GAPM = 28.54%; GA = 4.47 g), and DT50F in Pre-
depends on mean and variance to score the genetic                                       lim10 (GAPM = 6.49%; GA = 3.01 days). These sets
merits in historically bi-parental populations was                                      also registered high values of genetic usefulness,
applied to groups of breeding lines with mixed                                          suggesting potential application in non-full sib popu-
parentage. Principal component analysis (PCA) was                                       lations. These approaches can be used during prelim-
used to depict contribution of traits to observed                                       inary performance tests to reinforce decisions in
variations. GY and DT50FL explained the variance                                        extracting promising lines and choose among defined
within and between sets respectively. Genotypes were                                    groups of lines.

                                                                                        Keywords Cowpea [vigna unguiculata (l.) walp.]
Supplementary Information The online version contains
supplementary material available at (https://doi.org/10.1007/                           Genetic advance  Genetic potential  PCA clustering
s10681-020-02763-y)                                                                     Usefulness criterion  Multiple populations

P. O. Ongom (&)  A. Togola  O. G. Oyebode
M. S. Ahmad  I. D. Jockson  G. Bala  O. Boukar
International Institute of Tropical Agriculture (IITA),
IITA Kano Station, PMB 3112, Kano, Nigeria                                              Introduction
e-mail: P.Ongom@cgiar.org
                                                                                        Cowpea [Vigna unguiculata (L.) Walp.] is a key
C. Fatokun
International Institute of Tropical Agriculture (IITA),                                 legume in the semi-arid regions of Sub-Saharan Africa
Ibadan, Nigeria                                                                         (SSA) because of its significant contribution to food

                                                                                                                                    123
30 Page 2 of 18 Euphytica (2021) 217:30 and nutritional security in the region. The crop revolutionized breeding, now requiring breeding for provides a cheap source of quality protein and clearly defined product targets and profiles (Ragot minerals to both rural and urban communities in et al. 2018). Grain yield, fodder potential and maturity Africa (Ajeigbe et al. 2012; Dube and Fanadzo 2013). duration are key components of each product target The grains and leaves are both good sources of protein among other traits. Consequently, breeders may have ranging from 21 to 33% and from 27 to 43%, to create and parallelly manage multiple populations respectively (Ahenkora et al. 1998; Boukar et al. of genetic materials in the breeding programs to suit 2011; Ddamulira et al. 2015). Cowpea predominance specific product targets. Breeding lines emerging from in the dry zones of Africa is attributable to its inherent several crosses may be fragmented based on maturity drought tolerance and capability to grow in marginal- groups or other traits. In cases where multiple breeding ized soils where other crops fail (Ehlers and Hall 1997; sets are created, it is important to understand the Ewansiha and Singh 2006; Agbicodo et al. 2009; Hall genetic potentials of each set of materials or popula- et al. 2010; Fatokun et al. 2012). In the dry savannas of tions in terms of genetic variability and expected West Africa, cowpea is regarded as a dual purpose genetic advance for key product traits like grain yield crop providing both human food and animal fodder to warrant continued investment in advanced testing (Singh et al. 2003; Kamara et al. 2012). Additional across the target environments (Allier et al. 2019). The attractiveness of cowpea is seen in its ability to fix approach to define the usefulness or the genetic worth nitrogen in the soil, making it a key component of the of a set of genetic materials or a cross has been traditional intercropping systems (Kyei-Boahen et al. described (Bernado 2010; Allier et al. 2019) and the 2017). A recent report also revealed cowpea’s medic- concept has been largely applied in maize breeding to inal properties, particularly anti-cancer, anti-hyper- identify the best populations for extraction of superior lipidemic, anti-inflammatory and anti-hypertensive inbred lines (Tabanao and Bernardo 2005). In this properties (Jayathilake et al. 2018). These unique approach, the genetic usefulness (U) of a population properties make cowpea a focus crop with potential to for a given quantitative trait is determined by its mean curb both the dynamic climate and malnutrition (l) and expected genetic gain (iHrp) as follows: challenges in SSA. U = l ? i*H*rp where i is the selection intensity Cowpea is largely produced and consumed in west which depends on the selection pressure, rp is the and central Africa, with Nigeria leading the production phenotypic standard deviation, and H is the broad at a rate of 2.14 million metric tonnes annually sense heritability (Tabanao and Bernardo 2005; Ber- (FAOSTAT 2017; Boukar et al. 2018). However, nado 2010). For instance, mean and genetic variance farmers in west Africa have not been able to exploit components of grain yield and other traits were the crops’ yield potential, given that the average grain deployed to dissect the usefulness of nine (6 synthetic yield is about 492 kg/ha compared to a possible yield and 3 F2) maize populations (Fountain and Hallauer of between 2,000 and 3,000 kg/ha demonstrated on 1996). In cowpea and soybean, Meenatchi et al. (2019) experimental station (Carsky et al. 2001; Agbicodo and Johnson (1955) exploited the genetic variability et al. 2009; Ahmad et al. 2010; Boukar et al. parameters: phenotypic coefficient of variation (PCV), 2013, 2018). The production and consumption of genotypic coefficient of variation (GCV), broad sense cowpea is challenged by numerous biotic and abiotic heritability (H) and genetic advance as a percentage of factors including insects, diseases, parasitic weeds, mean (GAPM) for grain yield and component traits to extreme and intermittent water and heat stresses understand the extent of genetic variability using F2 (Agbicodo et al. 2009; Boukar et al. 2013, 2018; populations, although the usefulness criterion was not Togola et al. 2017). used. Two early generation populations of cowpea Concerted efforts are being placed on cowpea to were examined based on genetic variance, heritability boost its productivity including deployment of modern and genetic advance expressed as a percentage of quantitative genetics and genomic tools (Ehlers et al. mean to gauge the degree of genetic variability for 2012; Boukar et al. 2016, 2018). These are expected to grain yield and fodder traits (Kumar et al. 2017; accelerate the rate of genetic gain, allowing farmers to Dinakar et al. 2018). However, when dealing with benefit from the full genetic potentials of the crop. multiple populations, a combination of the means and Additionally, the need to meet consumers’ demand has genetic advance becomes handy to ease decisions in 123
Euphytica (2021) 217:30                                                                                             Page 3 of 18      30

choosing the best sets of materials to advance in the                   temperature range of 26–32 °C. Shika (11° 150 N, 7°
breeding program (Schnell and Utz 1975; Tabanao                         320 E) is in the Northern Guinea Savanna agroecology,
and Bernardo 2005; Bernado 2010). The use of these                      in the sub-humid zone of Nigeria. The zone has a
genetic parameters is key in predicting the genetic                     unimodal wet season which begins in April/May and
worth of different sets of breeding populations and                     finishes by mid-October, with average annual rainfall
therefore reinforcing the decisions to focus resources                  of 1050 mm. Maximum temperature in Shika during
for advanced testing on lines from populations with                     the cropping season varied between 27 and 35 °C.
high genetic value. The objective of the present study                  Fertilizer was applied in both fields at a rate of 100 kg
was to decode the genetic potential of eight sets of                    of NPK (15–15–15) per ha.
cowpea breeding materials evaluated in preliminary
yield trials to ascertain effective extraction of the best              Plant genetic materials
lines for further testing in advanced yield trials and/or
for recycling as parents in the hybridization nursery.                  Sets of lines belonging to eight cowpea populations
The study exemplified an effective use of quantitative                  intended for preliminary yield tests (PYT), derived
genetic concepts to make selection decisions in a                       from multiple crosses in the breeding program and
breeding program.                                                       targeting different product profiles were used in this
                                                                        study. The crossing structure, pedigrees and agro-
                                                                        nomic features of parental lines are presented in
Materials and methods                                                   Supplemental File 1. The creation of the multiple sets
                                                                        of test lines was based on maturity duration meant to
Site description                                                        suit different agro-ecolozies in cowpea growing
                                                                        corridors of Northern Nigeria. Consequently, the sets
Field experiments were conducted during the 2019                        were categorized as: extra early and early maturity
cropping season in 2 locations at IITA experimental                     targeting the short duration production in the Sahelian
farms in Minjibir, Kano State, Nigeria, and at the                      and Sudan Savanna zones of West Africa, Medium
National Animal Production Research Institute                           and late maturity groups meant for the Medium and
(NAPRI), Shika, Kaduna State, Nigeria (Table 1).                        late duration product profiles suitable for the Guinea
Minjibir (12° 08.997 0 N, 8° 39.7330 E) is in the Sudan                 Savanna zone of West Africa. These maturity groups
savanna agroecology. The area has one wet season                        in addition to striga resistance status of the lines gave
which commences in May/June, ending in October,                         rise to the eight sets used in the present study.
with mean annual rainfall of about 674 mm and annual                    Smarmily, the sets were created by making several bi-

Table 1 Descriptions of experiements and sites used for evaluation of 614 cowpea lines, grouped into 8 sets, in year 2019 across two
location in Northern Nigeria
                                          a                                                 b
Set        Size    Design                  Rep   Sowing date                                An.Temp Range (oc)        c
                                                                                                                      An.Rainf (mm)
                                                                   th
Prelim1    80      8 9 10 Alpha lattice   2      Minjibir: June 29        Shika: Aug 20th

Prelim2    78      6 9 13 Alpha lattice   2      Minjibir: June 29th      Shika: Aug 20th
Prelim3    72      8 9 9 Alpha lattice    2      Minjibir: June 30th      Shika: Aug 21st   Minjibir: 26 to 32        Minjibir: 674
Prelim5    80      8 9 10 Alpha lattice   2      Minjibir: June 29th      Shika: Aug 20th
Prelim7    78      6 9 13 Alpha lattice   2      Minjibir: June 29th      Shika: Aug 21st
Prelim8    72      8 9 9 Alpha lattice    2      Minjibir: June 29th      Shika: Aug 21st   Sheika:                   Sheika: 1050
                                                                                            27 to 35
Prelim10   64      8 9 8 Alpha lattice    2      Minjibir: Aug 2nd        Shika: Aug 21st
Prelim11   90      9 9 10 Alpha lattice   2      Minjibir: Aug 2nd        Shika: Aug 20th
a
number of replications; bmean annual temperature range measured in degrees celcious (oc);         c
                                                                                                      mean annual rainfal measured in
millimeters (mm); Minjibir and Shika are the names of loctions or sites

                                                                                                                          123
30 Page 4 of 18 Euphytica (2021) 217:30
parental crosses using specific elite parents per Data collection
maturity group; that is, two sets for short duration
group: Prelim7 and 10, two sets of medium duration Plant stand was determined two weeks after seedling
group: Prelim2 and 5, and three sets of late duration emergence and at harvest. Date to 50% flowering
group: Prelim2, 3 and 8. The crosses generated F1s that (DT50FL) was recorded when 50% of plants in the
were self-pollinated and between 200 -300 F2 derived middle two rows in a plot had flowered and the number
lines per set were advanced by single seed descent of days were computed with reference to the planting
(SSD) until F5 generation. At this stage lines were date. At maturity, the middle two rows in a plot were
planted in a striga infested observation plot and harvested, threshed and weighed to obtain grain yield
susceptible lines within each set were dropped and (GY) in grams per plot. The grain yield per plot was
resultant sets of F6 genotypes belonging to the then converted to kilograms per hectare (kg/ha),
different maturity groups were then used in the present considering the spacing and the plot length. Seed
study (Supplemental File 1). Included in the study is samples were taken from each plot and used to
an extra early duration set of F6 lines referred to as generate the one hundred seed weight (HSDWT) data,
Prelim11 that came from the inter-mating of eight measured in grams.
parents. The sets had variable population sizes ranging
from 60 to 90 and totaling to 614 genotypes (Table 1).
Additionally, the crosses producing the eight sets of Data analysis
genetic materials involved parental lines capturing key
traits of focus in the breeding program: High grain Traits distribution
yield potential, large seed size, varying maturity
(extra-early, early, medium and late), striga resistance, The R statistical software, version 3.5.2 (R Core Team
bacterial blight resistance and aphid resistance. The 2018) was used to generate and summarize a graphical
populations were developed by the cowpea breeding visualization using box plots and histograms of traits
program over a period at the International Institute of distribution within and between populations. The
Tropical Agriculture (IITA), Kano Station, Nigeria. means from two locations were used to generate the
box plots for the sets while the histograms were
generated using individual plot data for the two
Experimental layout locations. Scripts used have been provided in Supple-
mental File 2.
At both Minjibir and Shika experimental sites, the
eight populations were laid out as separate experi- Mean squares
ments in one mega experimental field per location.
Materials were planted on ridges spaced at 0.75 m Analyses of variances (ANOVA) were performed in
apart, with 0.2 m hill spacing within row. All exper- two steps; first with merged data of all sets, across two
iments consisted of four rows per plot, each measuring locations to assess differences between sets, and
4 m long, arranged as an alpha lattice design, with two second for each population independently to assess
replications per experiment and the number of variances within the sets. The following models were
incomplete blocks within a replication varied depend- implemented in R using agricolae and lme4 packages
ing on the number of lines within each of the eight (Bates et al. 2015; Mendiburu 2020) to obtain mean
populations (Table 1). The experiments at both squares (MS), coefficient of variations (CV) and
locations were planted at varying dates in between standard errors of means for the traits:
June and August 2019 depending on suitable cropping
(a) Between set Model Pijkh ¼ l þ seti þ lj þ
period of the location (Table 1).
ðset lÞij þ setðgÞik þ ðsetðgÞ lÞijk þ poolederror
Where Pijkh is the observed value of the ith genotype
in the jth location, l is the general mean,-
,gi ,lj ,ðg lÞij , setðgÞik and ðsetðgÞ lÞijk represent
the effects of the genotype, location, the interaction
123Euphytica (2021) 217:30 Page 5 of 18 30
between genotype and location, the effect of geno- Variance components
types nested within sets and the interaction between
genotypes within set by location effect respectively. To obtain variance components within each set, a
The between sets ANOVA was performed on a cell linear mixed model (lmer) function in R was imple-
mean basis and later converted on a plot basis by mented using lme4 package (Bates et al. 2015).
multiplying the MS by a common fac- Variance components for the major sources of vari-
P
torn ¼ p= ð1=r i Þ, and the pooled error inserted ation were estimated as;
in the ANOVA was estimated from the experimen-
Error variance r2e ¼ MSe :
tal error mean squares (EMS) of the individual trials
P P Genotype 9 location variance component
as: ðr EMSÞ= r (Cochran and Cox 1957). In 2
both expressions mentioned above, r i is the number rGL ¼ ðMSGL MSe Þ=r:
of replications in each trial and p is the number of Genotypic variance component ðr2G Þ ¼ ½ðMSG
trials. The approximate degree of freedom for the r r2GL Þ=ðr lÞ:
poled error term was obtained following the Welch– Phenotypic variance r2p ¼ r2G þ r2GL =l þ
Satterthwaite equation: 2
P P re =r l:
ðdf ð ki EMSi Þ2 = ððki EMSi Þ2 =vi Þ
whereki ¼ 1=ðvi þ 1Þ, vi is the error degree of
Where, MSG, MSG 9 L and MSe are the respective
freedom of individual trials and EMSi is the error
mean squares for genotypes, genotype 9 location
mean square of individual trials (Satterthwaite
interaction and the error, while r is the number of
1946). When conducting F-tests, the denominator
replications and l is the number of locations.
term for Set was Set*Loc, while setðgÞ lÞ was used
as a denominator term for the following factors:
Genotypic and phenotypic variability
Loc, Set*Loc and Set(Geno). The pooled error MS
was used as a denominator F-test for the Set(Gen-
The extent of dispersion or the degree of variability
o)*Loc term.
within each breeding set was estimated using the
(b) Within set Model Psijkh ¼ l þ gi þ lj þ
formula proposed by (Johnson 1955) as;
lðr Þjk þðlðr ðbÞÞjkh þðg lÞij þeijkh Where Pijkh is the
Genetic coefficient of variation ðGCV Þ ¼ ½ r2G =
observed value of the ith genotype in the jth l 100:
location, l is the general mean, gi , lj , Phenotypic coefficient of variationðPCV Þ ¼
lðrÞjk ; ðlðr ðbÞÞjkh and ðg lÞij represent the effects
½ r2P =lÞ 100; Where; l is the grand mean.
of the genotype, location, replication nested within Broad sense heritability (H2), was computed from
location, block and replication nested within loca- the variance components, expressed on an entry mean
tion, and the interaction between genotype and basis as:
location respectively;; and eijkh is the residual effect.
The denominator F-test for Loc, Loc(Rep) and H 2 ¼ r2G =½ðr2G þ ðr2G L Þ=l þ ðr2e Þ=r l
Loc(Rep (Block) were lðrÞ, lðr ðbÞ and EMS respec-
where r2G, r2G 9 L and r2e are variance components
tively while lattice effective error (LEE) was used as
for genotype, genotype x location interaction and the
a denominator test for Geno and Geno*Loc. The
error respectively while r and l are number of
LEE was obtained from the standard error of the
replications and locations respectively.
mean (SEM) estimates of the Geno*Loc term as:
LEE ¼ n SEM 2gl where n is the number of values Genetic advance and usefulness
used to estimate the Geno*Loc means which is
equal to the number of replications in this case. The Expected genetic advance (GA) and genetic advance
R scripts used for these analyses are provided in expressed as a percentage of the mean (GAPM) for each
Supplemental File 2. trait was computed according to (Allard 1960) as;
GA ¼ ki x H 2 xrP ; GAPM ¼ ðGA =Þ 100
12330 Page 6 of 18 Euphytica (2021) 217:30
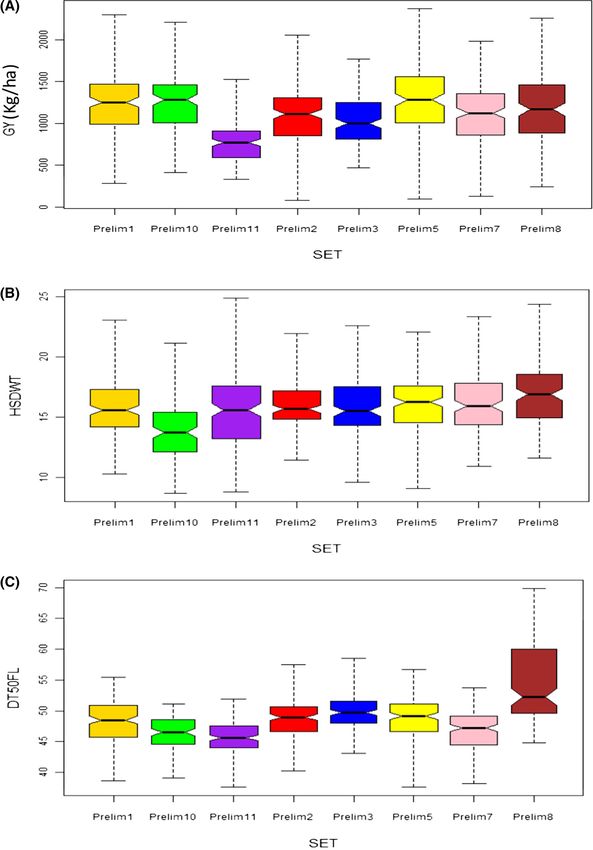
Fig. 1 Phenotypic distributions: Box plots showing the c
where, ki is a standardized selection differential dispersion quartiles within each of the eight sets of advanced
(assuming 10% selection intensity for prediction of breeding materials. a Grain yield (GY). b 100 seed weight
genetic advance, H2 is the broad sense heritability, rP (HSDWT). c Days to 50% flowering (DT50FL), generated using
is the phenotypic standard deviation, and l is the grand means from two locations. Histograms reflecting the distribu-
tions within each breeding set and boxplots for individual
mean. location dispersions are presented in Supplemental Fig. 1
The genetic worth or usefulness (U) of each
population was then estimated based on the mean
and genetic advances according to (Schnell and Utz
1975; Tabanao and Bernardo 2005; Bernado 2010) as: of breeding materials thus portraying continuous
U = l ? G A. distributions typical of quantitative traits (Supplemen-
Where, U is the genetic usefulness of a population, tal Fig. 1). The eight breeding sets responded uniquely
l is the mean of the population and GA is the expected to the environments based on their performances for
genetic advance. GY, HSDWT and DT50FL, with each breeding set
showing differential performances (high or low)
Principle component analysis (PCA) between the two locations as depicted in the individual
location boxplots presented in Supplemental Fig. 1.
Three parameters namely, yield, seed weight and days
to 50% flowering were used to conduct PCA on the Classification of breeding sets
sets of breeding lines in R using vqv/ggbiplot package
developed by Vincent (2011). PCA scores of the three Results of PCA conducted among and within breeding
variables namely GY, HSDWT and DT50F were sets are presented in Fig. 2 and Supplemental Fig. 2.
generated and used to determine the contribution of In general, PCA has showed diversity both within and
each variable to the total variations within and among between breeding sets based on GY, HSDWT and
the sets. PCA plots were then generated to visualize DT50FL, with PC1 and PC2 between sets accounting
the scatter pattern of sets and genotypes within sets for 91.2% of total variation in the data. PCA showed
along the X and Y axes. the three traits (GY, HSDWT and DT50FL) to be
distinct enough and provided good discrimination
among and within the breeding sets. For variation
Results among sets, PC1 was strongly associated with
HSDWT (PC1 = 0.65) and DT50FL (PC1 = 0.73)
Traits distribution and therefore, Prelim sets with high positive scores for
PC1 were promising for these two traits, while PC2
The frequency distributions of lines in each population was correlated with GY (PC2 = -0.90) hence, sets
according to traits are presented in Fig. 1 and Supple- with high negative scores for PC2 were good for GY.
mental Fig. 1. The box plots revealed different levels When the data was grouped sequentially by each trait,
of dispersion within each breeding set with Prelim5 clusters of breeding sets with potential for GY,
being the most variable set with high median GY, HSDWT and DT50FL became apparent. Prelim1, 5
followed by Prelim10 and Prelim1, while Prelim11 and 10 clustered in a group with GY above 1,200 kg/
had the least dispersion and the lowest median GY ha while Prelim11 was alone in the low yielding
(Fig. 1a). The median seed weights (HSDWT) were category (\ 1000 kg/ha), the rest being intermediate
within close ranges for most of the breeding sets, (Fig. 2a). For HSDWT, Prelim7, 2, and 8 were
although Prelim8 stood out with the highest values categorized as having seed weights above 15.9 g,
while Prelim11 had the lowest (Fig. 1b). Prelim11 was other sets being between 15.0 and 15.9 g, while
earlier than other sets with median DT50FL of about Prelim10 had a mean HSDWT of less than 15 g
45 days while Prelim8 took more than 50 days on (Fig. 2b). PCA for DT50FL revealed two groups with
average to flower (Fig. 1c). The depictions from the Prelim7,10 and 11 falling in the early flowering
histograms showed variations for grain yield, 100 seed category with less than 48 days while the rest of the
weight and days to 50% flowering within the eight sets
123Euphytica (2021) 217:30 Page 7 of 18 30
12330 Page 8 of 18 Euphytica (2021) 217:30
PC1 PC2 PC3 PC1 PC2 PC3
(A) PCA grouped by grain yield GY 0.22 -0.90 0.39 (B) PCA grouped by seed weight GY 0.22 -0.90 0.39
HSDWT 0.65 0.43 0.63 HSDWT 0.65 0.43 0.63
DT50FL 0.73 -0.11 -0.68 DT50FL 0.73 -0.11 -0.68
PC1 PC2 PC3 PC1 PC2 PC3
GY 0.22 -0.90 0.39 GY 0.70 -0.17 0.69
(C) HSDWT 0.65 0.43 0.63 (D) HSDWT 0.71 0.05 -0.70
Prelim1; grouped by grain yield DT50FL 0.09 0.98 0.16
PCA grouped by DT50FL DT50FL 0.73 -0.11 -0.68
Fig. 2 Principal component anaysis showing the diversity set and highligting genotypes that are high, intermediate and low
between and within eight sets of cowpea lines clustered based on yielding within the population. The arrows pointing to the
grain yield (GY), 100 seed weight (HSDWT) and days to 50% variables (GY, HDSWT and DT50FL) indicate the direction of
flowering (DT50FL). a PCA cluster grouped by grain yield and traits contribution to variation explained by PC1 and PC2. At the
highlighting sets with the highest (GY [ 1,200 kg/ha), inter- top right corner of each PCA plot, are PC scores for the three
mediate (1,000 \ GY \ 1,200 kg/ha) and the lowest (GY \ variables, reflecting the magnitude of contribution of each trait
1,000 kg/ha). b PCA cluster grouped by seed weight and to the variations explained by PC axes. In plots a, b and c the
highligting sets with the highest (HSDWT [ 15 g), intermedi- DT50FL accounted for most of the variation explained by PC1
ate (HSDWT = 15 g) and the lowest (HSDWT \ 15 g). c PCA while GY explained a greater proportion of variance on the PC2
cluster grouped by days to 50% flowering and highlighting sets axis. In plot d, GY and HSDWT accounted for most of the
with early (DT50FL \ 48 days) and late DT50FL [ 48 days) variance on the PC1 axis while DT50FL was associated with
maturing durations. d PCA cluster for one of the breeding sets variation on the PC2 axis
(Prelim1) grouped by grain yield showing diversity within the
sets were categorized as flowering later than 48 days weight and earliness could be extracted from these
after planting (Fig. 2c). populations (Fig. 2d and Supplemental Fig. 2). Except
When we performed PCA within each of the eight for Prelim7 and 10, GY was strongly correlated with
sets, it was clear that potentially high yielding PC1 and accounted for most of the variation among
genotypes ([ 1500 k/ha) that overlap with high seed genotypes within sets, therefore, genotypes with high
123Euphytica (2021) 217:30 Page 9 of 18 30
positive scores on PC1 axis were good for GY. For than 45 DT50F were frequent in Prelim11 while all the
Prelim7 and 10, HSDWT and DT50FL contributed genotypes in Prelim3 flowered later than 45 days
most to the variations explained by PC1. The PCA (Fig. 3c). When the three traits were considered
results further revealed that despite the genotypes together, more genotypes combining GY [ 1,200
being clustered as the best performers for a particular kg/ha, HSDWT [ 15 g and DT50FL \ 45 days
trait, there were still enough diversity among geno- could be extracted from Prelim 5 than in other sets
types within each cluster (Fig. 2d and Supplemental (Fig. 3d).
Fig. 2). A summary chart for the proportion of best
genotypes that could be extracted from each set for Variance between and within breeding sets
GY, HSDWT and DT50F is presented in Fig. 3. It was
evident that no genotype with GY above 1500 kg/ha Analysis of variance depicted the eight breeding sets
could be obtained from Prelim11 while Prelim5 had not to be statistically different for GY, HSDWT and
the highest number of high yielding genotypes DT50FL, indicated by non-significant mean square
(Fig. 3a). For HSDWT, Prelim7 had a higher number values for sets (Table 2). However, numerically,
of genotypes with seed weight above 20 g compared Prelim5 and 8 had higher GY and HSDWT respec-
to other breeding sets (Fig. 3b). Genotypes with less tively than others. The mean values showing
Fig. 3 Proportion of best (A) 25 GY > 1500Kg/ha
performing genotypes 21/80
No. of genotypes
within breeding sets. Bar 20 16/80
chats show the number of 15
10/72
genotypes out of the 10
9/64
6/78
population size of each set 3/72 3/78
5
with; a Grain yield (GY) 0/90
above 1,500 kg/ha. 0
b Hundred seed weight Prelim1 Prelim2 Prelim3 Prelim5 Prelim7 Prelim8 Prelim10 Prelim11
Sets
(HSDWT) above 20 g.
c Days to 50% flowering (B) 15 HSDWT > 20g
(DT50F) less than 45 days.
No. of genotypes
10/78
d combination of the three 10 7/78 7/90
traits (GY C 1,200 kg/ha,
HSDWT C 15 g and 5 3/80
2/72 2/80
3/72
2/64
DT50FL B 45 days)
0
Prelim1 Prelim2 Prelim3 Prelim5 Prelim7 Prelim8 Prelim10 Prelim11
Sets
(C) 50 DT50F < 45days 45/90
No. of genotypes
40
30 25/78 23/64
19/80 18/80
20
10 4/78
0/72 1/72
0
Prelim1 Prelim2 Prelim3 Prelim5 Prelim7 Prelim8 Prelim10 Prelim11
Sets
(D) 8 Combinaon
7/80
No. of genotypes
6
4/78
4 3/80
2 1/78 1/72
0/72 0/64 0/90
0
Prelim1 Prelim2 Prelim3 Prelim5 Prelim7 Prelim8 Prelim10 Prelim11
Sets
12330 Page 10 of 18 Euphytica (2021) 217:30
Table 2 Mean squares among eight sets of advanced breeding materials for grain yield (GY), hundred seed weight (HSDWT) and
days to 50% flowering (DT50FL), evaluated across two locations in Northern Nigeria during the rainy season of year 2019
#
GY HSDWT DT50FL Denominator F-test
SOURCE DF MS DF MS DF MS
ns ns ns
Set 7 7543948 7 179.92 7 179.92 Set*Loc
Loc 1 2,365,698*** 1 689.32*** 1 689.32*** Set(Geno)*Loc
Set*Loc 7 4,654,466*** 7 121.24*** 7 121.24*** Set(Geno)*Loc
Set(Geno) 596 293,674*** 595 22.08*** 596 22.08*** Set(Geno)*Loc
Set(Geno)*Loc 584 158,036*** 595 2.98*** 596 2.98*** Pooled error
Pooled error 831 67,023 942 1.93 841 4.30
Grand mean 1118.57 15.77 48.52
SEM 129.44 0.69 1.04
CV% 23.14 8.80 4.27
Geno Genotype; Loc Location; SEM Standard error of the mean; CV Coefficient of variation; DF Degrees of freedom; MS Mean
square; GY Grain yield; HSDWT Hundred seed weight; DT50FL Days to 50% flowering. ANOVA was conducted using genotype
means obtained from individual location analysis. The symbols; *, **, and *** represents the probability at 0.05, 0.01 and 0.001,
respectively. # Refers to the source of variation whose degree of freedom was used as denominator for the F-test
numerical performance of the breeding sets in each of eight breeding sets for all the three traits (Table 3 and
the two locations have been presented in Supplemental Supplemental Table 2).
Table 1. When we considered genotypes nested within
sets, the genotypic differences were highly significant Partitioning of variance within breeding sets
(P \ 0.001) for all the three traits (Table 2). In
addition, the effect of location was highly significant When variance components were computed for GY,
for all the three traits (P \ 0.001) and consequently, Prelim2 (d2G*L = 25,658; d2G = 45,897) and Prelim10
the overall responses of the breeding sets were highly (d2G*L = 6,231; d2G = 15,848) displayed low magni-
influenced by environment as portrayed by significant tude of variance due to genotype-by-Location inter-
Set-by-Location interaction effects for all the three action relative to the genetic variance component
traits (Table 2). The effects of genotypes nested within (Table 4). Consequently, Prelim2 recorded the highest
breeding sets were also statistically significant at genotypic coefficient of variations (GCV = 19.58%)
P \ 0.001) for all the three traits, signaling the for GY, followed by Prelim7 (GCV = 17.94%),
apparent difference among genotypes within the sets Prelim5 (GCV = 17.38%), Prelim8 (GCV = 17.36%)
(Table 2). However, the interaction between nested and Prelim1 (GCV = 14.37%). However, Prelim; 3,
effect of genotype within set and location was highly 10 and 11 had low genotypic and phenotypic coeffi-
significant suggesting the presence of genotype-by- cient of variations (Table 4).
environment interaction. For 100 seed weight, all the breeding sets showed a
When mean squares for variation within breeding generally lower magnitudes of variance attributed to
sets were compared, significant genotype effects were Genotype-by-Location interaction (d2G*L) relative to
observed for GY, HSDWT and DT50F with at least a the respective genotypic variances (d2G), with Prelim
probability value of P B 0.05 for all the eight breeding 11 (d2G = 7.137 vs d2G*L = 0.39) having the highest
sets (Table 3 and Supplemental Table 2). Location genetic variance component (Table 4). Breeding sets
effects were significant, with at least P B 0.05 for with high genotypic variability for seed weight
most of the traits with exceptions in some breeding included Prelim11 (GCV = 16.33%; PCV = 17.97%),
sets which shown no statistical significance (Supple- Prelim10 (CGV = 15.32%; PCV = 16.37%), and Pre-
mental Table 2). The interactions between genotypes lim2 (GCV = 14.72%; PCV = 14.72%). The rest of
and location were also highly significant in all the the breeding sets were intermediate while Prelim8 had
123Euphytica (2021) 217:30 Page 11 of 18 30
Table 3 Mean squares within eight sets of advanced breeding materials for grain yield (GY), hundred seed weight (HSDWT) and
days to 50% flowering (DT50FL), evaluated across two locations in Northern Nigeria during the rainy season of year 2019
Traits Geno Geno*Loc EMS LEE Mean Min Max SEM CV%
Prelim1
DF 79 79 130 130
MS GY 213,765*** 135,067*** 48,836 36,234 1,2378 514 1,819 135 15.4
HSDWT 20.8*** 2.71*** 2.2 1.2 15.7 7.3 21.4 0.8 7.0
DT50F 31.1*** 13.1*** 4.4 3.3 47.9 41.3 52.5 1.3 3.8
Prelim2
DF 77 77 134 134
MS GY 213,744*** 89,578*** 53,071 31,752 1,094 1667 1,791 126 16.3
HSDWT 24.3*** 1.88*** 1.6 0.8 16.0 6.5 22.4 0.6 5.6
DT50F 22.0*** 7.7*** 4.6 2.7 48.8 41.8 53.8 1.2 3.4
Prelim3
DF 71 71 114 114
MS GY 143,356*** 109,007*** 55,156 33,748 1,027.0 553 1,611 129.9 17.8
HSDWT 18.2*** 2.8*** 1.2 0.9 15.9 12.0 22.0 0.7 5.9
DT50F 11.9*** 15.2*** 2.9 2.5 49.9 46.3 54.0 1.1 3.2
Prelim5
DF 79 79 130 130
MS GY 397,585*** 292,284*** 97,108 71,972 1,271 128 2,028 189.7 21.1
HSDWT 20.3*** 4.3*** 3.1 1.8 15.9 8.3 21.3 0.9 8.4
DT50F 36.3*** 18.7*** 5.7 4.5 48.5 41.8 58.3 1.5 4.4
Prelim7
DF 77 77 134 134
MS GY 309,134*** 155,992*** 61,853 45,481 1,098 338 1,862 150.8 19.4
HSDWT 23.1*** 3.4*** 2.1 1.4 16.2 7.1 21.3 0.8 7.1
DT50F 17.4*** 12.4*** 4.5 3.1 46.8 41.3 52.0 1.3 3.8
Prelim8
DF 71 71 114 114
MS GY 286,337*** 179,715*** 101,088 55,511 1,179 369 1,695 166.6 19.9
HSDWT 17.0*** 3.70*** 1.9 1.4 16.8 13.7 24.0 0.8 7.0
DT50F 40.0*** 32.00*** 7.0 5.6 54.2 45.0 60.5 1.7 4.4
Prelim10
DF 63 63 98 98
MS GY 167,201*** 115,089*** 73,121 27,707 1,237 798 1,715 117.7 13.5
HSDWT 21.3*** 2.6*** 1.1 0.9 13.9 9.5 22.1 0.7 6.9
DT50F 18.1*** 3.3*** 3.5 1.4 46.5 41.5 50.0 0.8 2.6
Prelim11
DF 89 89 146 146
MS GY 184,667*** 126,074*** 45,953 32,513 804 418 1,404 127.5 22.4
HSDWT 31.2*** 3.4*** 2.2 1.4 15.7 9.9 23.4 0.8 7.6
DT50F 14.6*** 4.6*** 1.8 1.4 45.5 39.8 51.0 0.8 2.5
Geno Genotype; Loc Location; Rep Replication; EMS Error mean square; LEE Lattice effective error; Min Minimum; Max
Maximum; SEM Standard error of the mean; CV Coefficient of variation; Df Degrees of freedom; MS Mean square; GY Grain yield;
HSDWT Hundred seed weight; DT50F Days to 50% flowering; the symbols; *, **, and *** represents the probability at 0.05,0.01 and
0.001 respectively
12330 Page 12 of 18 Euphytica (2021) 217:30
Table 4 Variance component estimates and proportion of within eight sets of advanced breeding materials evaluated in
genetic and phenotypic variability for grain yield (GY), 100 2019 at two locations in Northern Nigeria
seed weight (HSDWT) and days to 50% flowering (D50FL)
Traits Parameter Prelim1 Prelim2 Prelim3 Prelim5 Prelim7 Prelim8 Prelim10 Prelim11
GY l 1238 1094 1027 1271 1099 1179 1237 804
d2G 31,622 45,897 11,883 48,798 38,835 41,848 15,848 6849
d2G*L 78,461 25,658 41,734 85,533 49,826 42,487 6231 19,585
d2e 50,568 57,831 68,026 101,064 69,665 115,114 81,641 52,634
d2P 83,495 73,184 49,757 116,831 81,164 91,870 39,374 29,800
GCV(%) 14.37 19.58 10.61 17.38 17.94 17.36 10.18 10.29
PCV(%) 23.35 24.72 21.72 26.89 25.93 25.72 16.04 21.46
HSDWT l 15.72 16.04 15.86 15.98 16.19 16.8 13.95 15.65
d2G 4.43 5.57 4.02 4.11 4.94 3.04 4.57 7.137
d2G*L 0.36 0.07 0.57 0.70 0.63 0.66 0.60 0.39
d2e 2.05 1.61 1.24 3.00 2.06 2.42 1.38 2.30
d2P 5.13 6.01 4.62 5.21 5.77 3.97 5.22 7.91
GCV(%) 13.39 14.72 12.64 12.69 13.73 10.38 15.32 17.07
PCV(%) 14.40 15.29 13.54 14.29 14.84 11.87 16.37 17.97
DT50F l 47.96 48.76 49.99 48.53 46.76 54.23 46.45 45.52
d2G 4.52 2.31 4.40 4.54 1.02 2.07 3.6 2.38
d2G*L 3.79 5.52 2.16 6.56 3.97 12.55 0.02 1.53
d2e 4.80 5.08 4.50 5.70 4.60 7.00 3.30 1.36
d2P 7.62 5.21 6.34 9.24 4.16 10.09 4.43 3.49
GCV(%) 4.43 3.67 4.20 4.39 2.16 2.65 4.08 3.39
PCV(%) 5.75 4.68 5.04 6.27 4.36 5.86 4.53 4.10
l overall mean of the breeding set; d2G Genetic variance component; d2G*L Genotype-by-Location variance component; d2e Error
variance component; d2P Phenotypic variance; GCV Genetic coefficient of variation; PCV Phenotypic coefficient of variation; GY
Grain yield; HSDWT Hundred seed weight; DT50FL Days to 50% flowering; the labels: Prelim1, Prelim2, Prelim3, Prelim5, Prelim7,
Prelim8, Prelim10 and Prelim11 are the breeding sets or populations
the lowest variability for seed weight with GCV and breeding sets, the differences between the two param-
PCV of 10.38% and 11.87% respectively (Table 4). eters (PCV and GCV) were minimal, yet by judging
The partitioning of variance within sets for from the standard deviation of genetic variance
DT50FL revealed variable magnitudes of variances components, these differences are significant.
attributed to genetic components, with Prelim1
(d2G = 4.52 vs d2G*L = 3.79) and Prelim5 Genetic advance and usefulness of breeding sets
(d2G = 4.54 vs d2G*L = 6.56) having high values of
genetic variance components relative to the Genotype- Results for expected genetic advance within the eight
by-Location interaction terms (Table 4). Breeding sets breeding sets computed based on broad sense heri-
that showed high genotypic and phenotypic variability tability and assuming 10% selection intensity are
for days to 50% flowering included Prelim1 (GCV = present in Table 5. Heritability for grain yield
4.43%; PCV = 5.75%), Prelim5 (GCV = 4.39%; computed on an entry mean basis ranged from 0.21
PCV = 6.27%), Prelim3 (GCV = 4.20%; PCV = for Prelim3 to 0.57 for Prelim2. Overall, the expected
5.04%) and Prelim10 (GCV = 4.08%; PCV = genetic advance (GA) for GY was more dependent on
4.53%). Breeding set with the lowest genotypic heritability than on genetic variance. When GA for
variability for HSDWT was Prelim7 which had a grain yield was expressed as a percentage of popula-
GCV of 2.16% (Table 4). For all the traits and tion means (GAPM), Prelim2 emerged with the highest
123Euphytica (2021) 217:30 Page 13 of 18 30
Table 5 Predicted genetic advance and genetic usefulness of eight sets of advanced breeding materials evaluated in 2019 at two
locations based on grain yield (GY), hundred seed weight (HSDWT) and days to 50% flowering (DT50F)
Traits Parameter Prelim1 Prelim2 Prelim3 Prelim5 Prelim7 Prelim8 Prelim10 Prelim11
GY l 1238 1094 1027 1271 1099 1179 1237 804
2
H 0.35 0.57 0.21 0.42 0.48 0.40 0.40 0.23
GA 175.83 269.05 83.93 251.27 239.91 211.12 140.57 69.83
GAPM (%) 14.21 24.59 8.17 19.77 21.84 17.91 11.36 8.68
Usefulness (Up) 1413.54 1363.27 1110.93 1522.33 1338.48 1389.75 1377.63 874.13
HSDWT l 15.72 16.04 15.86 15.98 16.19 16.8 13.95 15.65
H2 0.86 0.93 0.87 0.79 0.86 0.76 0.80 0.90
GA 3.45 4.00 3.29 3.17 3.62 2.68 3.23 4.47
GAPM (%) 21.92 24.94 20.77 19.84 22.35 15.97 23.12 28.54
Usefulness (Up) 19.17 20.04 19.16 19.16 19.81 19.48 17.18 20.12
DT50F l 47.96 48.76 49.99 48.53 46.76 54.23 46.45 45.52
H2 0.59 0.61 0.67 0.49 0.25 0.20 0.81 0.59
GA 2.88 2.46 1.60 2.63 0.88 1.14 3.01 1.92
GAPM (%) 6.01 5.05 3.19 5.41 1.89 2.11 6.49 4.22
Usefulness (Up) 45.08 46.29 48.39 45.90 45.87 53.09 43.44 43.59
2
l overall mean of the breeding set; H Broad sense heritability; GA Genetic advance; GAPM Genetic advance expressed as a
percentage of mean; Up Usefulness of a population computed as Up l ? GA; GY Grain yield; HSDWT Hundred seed weight; DT50F
Days to 50% flowering
percentage of expected genetic advance (GAPM = (GAPM = 15.97%; 2.68 g) registered the lowest per-
24.59%; GA = 269.05Kg/ha). This was followed by centage value of expected genetic advance (Table 5).
Prelim7 (GAPM = 21.84%; GA = 239.91Kg/ha) and Usefulness criterion revealed Prelim11 and Prelim2 as
Prelim5 (GAPM = 19.77%; GA = 251.27Kg/ha). Other the most useful breeding sets for HSDWT with Up
intermediate breeding sets were Prelim8 (GAPM = values of 20.12 g and 20.04 g respectively, while
17.91%; GA = 211.12Kg/ha) and Prelim1 with GAPM prelim10 had the lowest usefulness value even though
and GA of 14.21% and 175.83Kg/ha respectively it had moderate percentage value of expected genetic
while Prelim3 had the lowest GAPM (Table 5). advance. When it came to DT50F, the heritability
Consequently, when usefulness criterion was used values were variable between the breeding sets
to compare breeding sets based on grain yield, most of ranging from low (0.20 for Prelim8) to intermediate
the sets that had high percentage of genetic advance (0.49 for Prelim5) and high (0.81 for Prelim10).
also recorded high usefulness (Up) values (Table 5). Consequently, breeding sets that showed high pre-
For instance, Prelim5 had the highest Up of dicted genetic advance were Prelim10 (GAPM =
1522.33 kg/ha, flowed by Prelim1 (Up = 1413.54 6.49%; GA = 3.01 days), Prelim1 (GAPM = 6.01%;
kg/ha), while Prelim11 (Up = 874.13Kg/ha) and Pre- GA = 2.88 days) and Prelim5 (GAP = 5.41%; GA =
lim3 (Up = 1110.93Kg/ha) were the least useful sets 2.63 days). Prelim2 and Prelim11 had intermediate
for grain yield (Table 5). For HSDWT, the heritability proportion of expected genetic advance while Prelim8
values were relatively high across all breeding sets in and 3 had the lowest prediction of genetic advance for
the range of 0.76 for Prelim8 to 0.93 for Prelim2 DT50F (Table 5). To make sense of usefulness
(Table 5). It was observed that breeding sets with high criterion for DT50F, the expected genetic advance
heritability values also showed relatively high predic- was deducted from the mean DT50F, thereby, reveal-
tion values of genetic advance, the best sets being ing Prelim10 (Up = 43.44 days), Prelim11 (Up =
Prelim11 (GAPM = 28.54%; GA = 4.47 g) and Pre- 43.59 days) and Prelim1 (Up = 45.08 days) with
lim2 (GAPM = 24.94%; GA = 4.00 g), while Prelim8 high genetic potential for early flowering (Table 5).
12330 Page 14 of 18 Euphytica (2021) 217:30
Discussion overlap for the three traits. Grouping the breeding
sets by their means in respect to the traits allowed the
Decisions in plant breeding are continuously becom- PCA to highlight the potential sets for GY, HSDWT
ing more complex given the dynamic consumer and DT50FL (Fig. 3). When PCA was examined
demands and preferences, and the current issues of within each breeding set, the structure reflected
climate change. As the human population continues to diversity among genotypes, but some genotypes were
surge, breeders are constantly under pressure to highly associated with GY reflecting their yield
release improved varieties with high yields and other potentials while others were more correlated with
preferred traits. Consequently, a typical active breed- HSDWT and DT50FL, implying those genotypes
ing program often handles multiple populations performed well for the traits in question (Supplemen-
intended for varied purposes or product targets tary Fig. 2). PCA was able to identify the top
(Witcombe and Virk 2001). This introduces complex performing genotypes within each breeding set for
deliberations and challenges relating to handling large the three traits, with clear categorizations of those
sizes of genetic materials, resource allocations and having GY above 1500 kg/ha, seed HSDWT above
selection decisions at every breeding stage (Witcombe 20 g and DT50FL less than 45 days.
and Virk 2001; Sun et al. 2011). Therefore, Sun et al. A summary of the proportion of high performing
(2011) noted that, careful choice of genotypes at each genotypes that could be extracted from each breeding
step in a breeding program is key in determining the set was derived from the PCA and presented in Fig. 3.
ultimate success in the next selection stages for genetic This chart portrayed Prelim5, Prelim7 and Prelim11 as
advancement. The present study elucidated the genetic sets having high frequencies of genotypes with GY
worth of eight sets of cowpea breeding materials above1500kg/ha, seed HSDWT above 20 g and
evaluated in preliminary yield trials across two DT50F less than 45 days, while Prelim5 had the
locations in Northern Nigeria, deploying the concepts highest number of genotypes with good combination
of genetic variance, heritability, genetic advance and of desired values of the three traits. PCA is a powerful
usefulness criterion to aid in making selection deci- data reduction tool that has been used in cowpea
sions for advancement of materials. conventional breeding for morphological characteri-
We began by examining the distributions of the zation and defining key determinants of grain yield
three traits; GY, HSDWT and DT50FL, within each of (Oladejo et al. 2016). A study by (Vural and Karasu
the eight breeding sets. The traits variation approxi- 2007) deployed PCA using multiple yield component
mated continuous distributions within the sets, sug- traits to understand which of the factors explained
gestive of quantitative inheritance. Sinnott (1937) most of the total variance in the data, and found seed
argued that, when phenotypic variation is presumably weight and pod size to contribute most of the
environmental and or conditioned by multiple genes variations. In the present study, the traits distributions
with minor effects, the distribution is essentially and PCA provided an overall picture of total variabil-
symmetrical. In cowpea, grain yield, seed weight ity and structure in the data among and within the
and flowering time are complex traits that exhibits breeding sets. Differences among sets were mostly
quantitative variations in nature (Lopes et al. 2003; explained by DT50FL as indicated by higher PC1
Ishiyaku et al. 2005; Boukar et al. 2016). The present score for this trait than others. This observation is
study depicted different levels of total dispersions consistent with the fact that the sets were created based
within the breeding sets, with some sets such as on maturity and therefore, it is expected that the
Prelim5, Prelim8 and Prelim11 showing slight shifts groups would be distinct in terms of DT50FL. On the
towards high GY, HSDWT and less DT50FL respec- other hand, variation among genotypes within sets
tively. The observed dispersions suggested involve- were mostly explained by GY and HSDWT as
ment of genetic factors governing the traits tested and reflected by high PC1 scores for these traits. Given
that recovering promising lines from these sets is the information on the contributions of the traits to
highly probable. variation on the PC1 and PC2 axes it was possible to
When the breeding sets were analyzed using PCA, identify promising sets and genotypes within sets for
it became apparent that the eight breeding sets were higher GY. The fact that variability among genotypes
distinct from each other although some of them within each set was mostly explained by GY and
123Euphytica (2021) 217:30 Page 15 of 18 30
HSDWT implies that selection within the sets for these locations data, and considering that further testing in
two traits would be more beneficial than for DT50FL. more locations is expected, selection based on means
However, since the phenotypic variability generally and with a relatively relaxed selection intensity would
was only slightly greater than the genetic variability in be suggested to avoid elimination of potentially
these traits, the total dispersion does not reflect wholly stable genotypes for GY at this stage.
the magnitude of genetic variance since it is a To further decode the genetic potential of the eight
combination of genetic and environmental variations breeding sets, total variance within each set was
and hence, an accurate assessment would require partitioned to reflect variances attributed to genotype,
partitioning of total variance into its different compo- location and the interaction thereof (Table 4). This
nents (Bernado 2010). allowed further dissection of the breeding sets in terms
To unravel the variability between and within the of genetic coefficient variability, heritability, genetic
sets, we conducted a two-step classical ANOVA, first advance and overall genetic usefulness of the sets.
between the sets and then for individual breeding sets. Breeding sets that had high relative magnitude of
Sets did not show significant mean differences for all genetic variance had moderate to high heritability and
the three traits considered although numerically some further depicted relatively high expected genetic
sets had higher mean values than others. However, the advance and genetic usefulness This observation
effect of genotypes nested within location was signif- suggested that the sets with high values of genetic
icant, an indication that sets are likely different, but its variance, genotypic coefficient of variation, heritabil-
significance could have been masked by environment. ity, expected genetic advance and genetic usefulness
Indeed, the analysis revealed significant interactions for the traits in question, would respond well to future
between sets and location and that of genotypes nested selection, and superior lines for the traits are
in set by location. This outcome suggested that extractable from these sets. This finding was consis-
meaningful selections among sets and genotypes tent with the past studies in cowpea which used similar
within sets would require testing the materials in genetic parameters to evaluate the effectiveness of
multiple locations to eliminate the confounding effect population response to selection (Damarany 1994;
of the environment. In addition, it’s important to Omoigui et al. 2006; Manggoel 2012; Nwosu et al.
understand the amount of variation within the popu- 2013). The observed minimal differences between
lation in addition to the mean in order to make a more GCV and PCV for all the traits studied implied that the
informed selection decision (Tabanao and Bernardo traits are mostly governed by genetic factors with little
2005; Bernado 2010). The present study tested geno- role of environment in the phenotypic expression of
typic variation in the eight sets and found the genotype these characters (Manggoel 2012). Therefore, selec-
effects within each set to be significantly different for tion for these traits based on phenotypic value may be
all the traits except for GY in Prelim11. This suggested effective. Manggoel (2012) alluded to the fact that
that there was enough genetic variability within the heritability estimates coupled with genetic advance
sets to warrant selection and recovery of good are useful in predicting the resultant effect for the
performing lines. However, the observed significant selection of the best individuals from a population.
effects of genotype-by-location interaction for traits in Moderate to high broad sense heritability values
most of the sets suggested presence of variation in observed in the present study suggested that selection
relative performance of genotypes between the loca- within each Prelim set for GY, HSDWT and DT50FL
tions, creating an alert to proceed with caution when would be beneficial, given the moderate magnitude of
merging means from the two locations to make environmental influence. The results of usefulness
selection within the sets (Mohammadi et al. 2015). criteria were consistent with that from variance
Genotypic variation for grain yield, seed weight and components and genetic advance. This suggested that
flowering time in cowpea are known to be influenced the concept of genetic usefulness may be used to
by environments (Adewale et al. 2010; Odeseye et al. evaluate the genetic merit of specifically defined
2018). This complicates the selection of superior groups of breeding materials that are not necessarily
genotypes, thereby reducing genetic progress (Allard derived from a two-parent cross. Usefulness criteria
and Bradshaw 1964; Mohammadi et al. 2015). In the have historically been applied to bi-parental popula-
present case, decision would be made based on two tions with full sib progeny to predict population
12330 Page 16 of 18 Euphytica (2021) 217:30
performance in early generations (Tabanao and decision for advancement in a conventional breeding
Bernardo 2005; Bernado 2010; Allier et al. 2019). program.
The advantage of genetic usefulness is that is captures
the overall value of a population in terms of its mean Acknowledgement The authors appreciate funding support
from Bill and Melinda Gates Foundation (BMGF) through
performance and total variance (Tabanao and Ber-
Accelerated Varietal Improvement and Seed Delivery of
nardo 2005; Bernado 2010; Allier et al. 2019). With Legumes and Cereals in Africa (AVISA) project and CRP
homozygous lines and the opportunity for replicated funds from International Institute of Tropical Agriculture
testing at later generations as it is the case in the (IITA). We thank all the field coordinators who aided
experimental set up and data capture at the two experimental
present study, there is improved prediction accuracy of
sites, Minjibir and Shika stations.
genetic usefulness. The information may still be
helpful at early performance testing phase, especially Author contributions POO: corresponding author, wrote the
when there is need to prioritize among several groups paper, conducted the statistical analysis. CF & AT: Coordinated
of breeding materials. Indeed, our study has demon- trials and revised the paper. OGO: organized and curated data.
AM, IDJ & GB: performed the field measurements, generated
strated that there are some sets like Prelim11 (UP- phenotypes and organized the data. BO: Developed the
= 874 kg/ha) and Prelim3 (UP = 1110 kg/ha) with populations and designed the study.
relatively low GY scores that would be dropped at this
stage and lines taken back in the crossing nursery for Funding This research was funded by Bill and Melinda Gates
yield improvement. Foundation (BMGF) through Accelerated Varietal
Improvement and Seed Delivery of Legumes and Cereals in
The present study elucidated the structure and Africa (AVISA) project and CRP funds from International
properties of eight sets of cowpea breeding materials Institute of Tropical Agriculture (IITA).
that are destined for further testing, revealing the
uniqueness of each set and the magnitude of expected Data availability Data generated during this study are
included in this published article and its supplemental files.
gain from selection within each set and the genetic
Requests for additional information regarding the elite genetic
usefulness of each set. The variance component materials in this study can be made to the authors and will be
analysis allowed estimation of genetic and phenotypic considered without undue reservation.
coefficient of variation, heritability and expected
genetic advance. These parameters exposed the Compliance with ethical standards
genetic potential of eight sets of cowpea breeding Conflict of interest The authors declare that they have no
lines for GY, HSDWT and DT50FL, revealing sets conflict of interest.
with high genetic variance and from which superior
lines could be extracted to recommend for advanced Open Access This article is licensed under a Creative Com-
mons Attribution 4.0 International License, which permits use,
testing. Estimates of genetic usefulness were generally sharing, adaptation, distribution and reproduction in any med-
consistent with results from variance components ium or format, as long as you give appropriate credit to the
which provided additional layer of information on the original author(s) and the source, provide a link to the Creative
score for genetic merits of the sets. The current study Commons licence, and indicate if changes were made. The
images or other third party material in this article are included in
highlights a novel application of usefulness criteria in the article’s Creative Commons licence, unless indicated
non-biparental populations with populations defined otherwise in a credit line to the material. If material is not
based on maturity groups. However, comparisons of included in the article’s Creative Commons licence and your
performance among populations may be limited by the intended use is not permitted by statutory regulation or exceeds
the permitted use, you will need to obtain permission directly
nature of traits used for grouping as in the present case from the copyright holder. To view a copy of this licence, visit
where maturity may be correlated with other traits http://creativecommons.org/licenses/by/4.0/.
used for assessing performance. Principal component
analysis depicted the relative contributions of the three
traits to the variability between and within sets,
revealing that more benefit would be obtained by References
selecting among genotypes within sets based on GY
and HSDWT than on DT50FL. These approaches Adewale BD, Okonji C, Oyekanmi AA et al (2010) Genotypic
variability and stability of some grain yield components of
generated relevant information required in making
Cowpea. African J Agric Res 5:874–880
123You can also read