Global invasion history of the tropical fire ant: a stowaway on the first global trade routes - University of ...
←
→
Page content transcription
If your browser does not render page correctly, please read the page content below
Molecular Ecology (2015) 24, 374–388                                                                   doi: 10.1111/mec.13040

Global invasion history of the tropical fire ant: a
stowaway on the first global trade routes
DIETRICH GOTZEK,*†1 HEATHER J. AXEN,‡1 ANDREW V. SUAREZ,* SARA HELMS CAHAN‡
and D E W A Y N E S H O E M A K E R §
*Department of Animal Biology and Department of Entomology, University of Illinois at Urbana-Champaign, Urbana, IL 61801,
USA, †Department of Entomology, National Museum of Natural History, Smithsonian Institution, Washington, DC 20013,
USA, ‡Department of Biology, University of Vermont, Burlington, VT 05405, USA, §CMAVE, USDA-ARS, Gainesville, FL
32608, USA

            Abstract
            Biological invasions are largely thought to be contemporary, having recently increased
            sharply in the wake of globalization. However, human commerce had already become
            global by the mid-16th century when the Spanish connected the New World with Eur-
            ope and Asia via their Manila galleon and West Indies trade routes. We use genetic
            data to trace the global invasion of one of the world’s most widespread and invasive
            pest ants, the tropical fire ant, Solenopsis geminata. Our results reveal a pattern of
            introduction of Old World populations that is highly consistent with historical trading
            routes suggesting that Spanish trade introduced the tropical fire ant to Asia in the 16th
            century. We identify southwestern Mexico as the most likely source for the invasive
            populations, which is consistent with the use of Acapulco as the major Spanish port
            on the Pacific Ocean. From there, the Spanish galleons brought silver to Manila, which
            served as a hub for trade with China. The genetic data document a corresponding
            spread of S. geminata from Mexico via Manila to Taiwan and from there, throughout
            the Old World. Our descriptions of the worldwide spread of S. geminata represent a
            rare documented case of a biological invasion of a highly invasive and globally dis-
            tributed pest species due to the earliest stages of global commerce.
            Keywords: biogeography, fire ant, global trade, invasion biology, Solenopsis geminata
            Received 20 September 2014; revision received 24 November 2014; accepted 6 December 2014

                                                               mensals. Indeed, Darwin (1859) had already recognized
Introduction
                                                               the transformation of ecosystems by invasions during
Human-mediated changes to the environment and glob-            his 19th century travels. Some of the earliest docu-
alization of trade have brought biological invasions into      mented cases of dispersal via human migration are the
the public, political and scientific limelight (Vitousek       spread of a skink and gecko during the colonization of
et al. 1997; Bright 1999; Pysek & Richardson 2010;            Polynesia starting from 1500 BCE (Fisher 1997; Austin
Lowry et al. 2013). Several recently introduced species        1999) and the movement of house mice (Rajabi-Maham
have become notorious invaders and highly invasive             et al. 2008) and domestic animals following the Neo-
and damaging pests, costing billions to control and tak-       lithic expansion (Larson et al. 2007; Sacks et al. 2013).
ing a toll on human health and the environment                 However, historical records or archaeological evidence
(Pimentel et al. 2000, 2005). Human migration and trade        for species invasions is often lacking or difficult to
have always aided dispersal of other organisms as com-         acquire, and most evidence for commerce-mediated
                                                               invasions is recent. This bias is undoubtedly augmented
Correspondence: Dietrich Gotzek, Fax: +1-217-244-1224;         by human-mediated introductions having increased
E-mail: dgotzek@uga.edu                                        sharply with the rise in global transportation and trade
1
  These authors contributed equally to the work.               (Meyerson & Mooney 2007; Westphal et al. 2007; Hulme

                                                                                              © 2014 John Wiley & Sons Ltd
G L O B A L I N V A S I O N O F T H E T R O P I C A L F I R E A N T 375
2009). Although such global transport is largely population and invasion history, it is difficult to identify
assumed to be contemporary, Europe, Africa and Asia native ranges.
were already well connected through a vibrant commer- Tropical fire ant is a pioneer species (Perfecto 1991), a
cial network, and trade had become truly global in the generalist keystone predator (Risch & Carroll 1982), and
16th century when the Spanish established trade routes readily occupies urban and agro-ecosystems (Perfecto
across the Pacific and Atlantic Oceans (Flynn & Gir al- 1991; Holway et al. 2002; Perfecto & Vandermeer 2011).
dez 2004). The Manila galleons and West Indies fleet This ant also is well known as an agricultural pest (La-
connected Spain to the Asian markets via the New kshmikantha et al. 1996; Holway et al. 2002) and is
World. The extent to which early global trade may have thought to be one of the infamous Hispaniolan plague
been important for setting up many current biogeo- ants of the early 16th century (Wilson 2005). Damage to
graphic patterns is unknown, as we lack studies that crops is mostly indirect, by tending honeydew-produc-
examine range expansions at this time (but see Aplin ing aphids and other Hemiptera (Risch & Carroll 1982;
et al. 2011). Carroll & Risch 1984), but foragers also are known to
Ants are ideal models to test whether the emergence girdle citrus trunks (Wolcott 1933), deter specialist poll-
of global trade had a far-reaching biogeographic impact, inators (Carroll & Risch 1984) and damage irrigation
as they are readily moved via ship transport, making tubing (Chang & Ota 1976). Aside from its negative
them highly susceptible to human dispersal. There are a impacts on agriculture, TFA can impact both vertebrate
number of widespread ant species with global or near (Travis 1938; Kroll et al. 1973; Moulis 1996; Plentovich
global distributions (McGlynn 1999). Their native et al. 2009) and invertebrate (Lake & O’Dowd 1991;
ranges are often unknown, as is accurate and detailed Way et al. 1998; Geetha et al. 2000) faunas. The latter
historical documentation of their spread. Many of these has led it to be described as an important biocontrol
species are known to have reached a near global distri- agent of invertebrate pest species (Way et al. 2002; Way
bution by the 19th century (Wetterer 2005, 2008, 2010, & Heong 2009).
2011, 2012; Wetterer et al. 2009), raising the possibility Research on invasive populations of TFA has lagged
that they were distributed along the same routes and far behind that of the other invasive ant species, partic-
during the same times. If so, comparative analyses of ularly its congener S. invicta (Tschinkel 2006). System-
invasion histories should recover the predominant trade atic study and understanding of biological invasions are
routes during the time of invasion and highlight the not only important to better control, manage and pre-
importance of human commerce as a main vector for vent establishment of invasive species, but also repre-
human-mediated dispersal. sent ideal model systems for the study of important
One such globally distributed ant species is the tropi- questions in evolution and ecology (e.g. rapid evolution,
cal fire ant (TFA), Solenopsis geminata (Fabricius 1804). genetics of adaptation to new environments) (Sax et al.
While TFA is not as well studied as its congener, the Red 2007; Suarez & Tsutsui 2008; Simberloff et al. 2013).
Imported Fire Ant (S. invicta), TFA is often the most com- Molecular genetic methods have become an important
mon, abundant and conspicuous ant in disturbed areas tool for the study of biological invasions (Estoup & Gu-
and has a much wider distribution. Having colonized illemaud 2010; Fitzpatrick et al. 2012; Kirk et al. 2013),
virtually all tropical regions in the world (Wetterer 2011), allowing inference of parameters otherwise difficult or
it is one of the most widespread tropical and subtropical impossible to obtain by other means. Here, we present
ants. Like many other widely distributed early invasives, the first population genetic study using microsatellites
there has been uncertainty regarding the native range of and mtDNA sequences of the TFA on a global scale.
TFA. It has long been known outside the New World We describe the population structure of this ant, iden-
(Wetterer 2011); a red variant (subspecies S. geminata tify the most likely source population, estimate times
rufa, now a junior synonym of the nominal form (Etter- and infer routes of invasion, and document recent,
shank 1966)) was initially considered to be indigenous to human-mediated long distance dispersal. Our data indi-
Asia and distinct from the New World forms (Creighton cate that TFA spread in the wake of the first global
1930). However, this red form was later found to occur trade network in the 16th century.
from Florida to Panama, which suggests a New World
origin for S. g. rufa (Creighton 1930). Trager (1991)
Materials and methods
hypothesized that the Old World S. g. rufa derived from
a single introduction event based on the high uniformity
Data generation
of the Asian and Pacific populations, but noted that the
dark West African specimens of the TFA more resembled Sample collection. A total of 192 TFA colonies were sam-
forms from the southeastern U.S.A. and the Caribbean. pled from across the current geographic distribution of
Clearly, without exact knowledge of an invasive species’ Solenopsis geminata (Fig. 1, Table S1, Supporting
© 2014 John Wiley & Sons Ltd376 D . G O T Z E K E T A L .
A
B
Fig. 1 Group memberships and projection in geographic and discriminant space. A) Geographic localities of samples. Samples are
RGB colour coded according to the first three principal components of the DAPC (using four clusters which clearly distinguish an
Old World (red), South American (dark blue), Caribbean (green) and North American (light blue) cluster. The Mesoamerican samples
are intermediate between the New World clusters. B) Scatterplot of eight clusters recognized by DAPC. The first three principal com-
ponents are shown (PC1: 26.1%, PC2: 7%, PC3: 4.8%). Cluster centroids are connected by a minimum-spanning tree.
information). To generate statistically independent sam- not nuclear homologs. Sequences were readily aligned
ples, only a single worker ant was used from each col- by hand and are deposited in GenBank (Table S1, Sup-
ony. We roughly distinguish between the New World porting information).
(i.e. the Americas including the Galapagos) and Old
World (Africa, Asia and Australia). Samples of the three Microsatellite genotyping. Forty-five microsatellite mark-
most closely related species to S. geminata (S. xyloni, S. ers were amplified following methods outlined in previ-
amblychila, and S. aurea) were used as outgroups for the ous studies (Ascunce et al. 2009, 2011). Briefly,
phylogenetic analyses (Trager 1991; Pitts et al. 2005). genotypes of a single female from 151 colonies were
determined at 45 nuclear microsatellite loci. We only
Mitochondrial DNA sequencing. We amplified 646 bp of included individuals with genotypic data for >30 micro-
the mitochondrial gene cytochrome c oxidase 1 (CO1) satellite markers in our analyses, resulting in 68 native
from 182 specimens of S. geminata and five outgroup and 77 invasive samples retained for subsequent study.
specimens following published procedures (Ross et al. Following best practice procedures (Bonin et al. 2004;
2003). Resulting sequences were checked for the pres- Hoffman & Amos 2005), we estimated microsatellite
ence of premature stop codons and indels and com- genotyping error rate by independent allele scoring and
pared to S. geminata mtDNA sequences from GenBank; double-checking of random individuals, which also
amplified fragments were consistent with mtDNA and helped to identify and eliminate errors that had
© 2014 John Wiley & Sons LtdG L O B A L I N V A S I O N O F T H E T R O P I C A L F I R E A N T 377
occurred during scoring of alleles by hand. Loci were minimum-spanning trees connecting the cluster cent-
screened for null alleles, Hardy–Weinberg equilibrium roids allows a visual representation of affinities between
and linkage disequilibrium. clusters.
To validate our decision to recognize substructure in
our data set, we compared stability of group member-
Data analysis
ship probabilities of the eight inferred clusters to ran-
Generally, we analysed the mtDNA sequence data and dom clustering, giving an indication of how well
nuclear microsatellite data separately to be able to com- supported the clusters are. Low group membership
pare and contrast potential differences between mater- probabilities suggest that clusters are not supported by
nal and biparental gene flow and divergence. To the data. As retention of too many principal compo-
examine population genetic structure at a finer resolu- nents can result in overinflated membership probabili-
tion in the nuclear data set, we also analysed the New ties and hence perfect discrimination, we conservatively
World and Old World/Australian samples separately. used only three principal components and discriminant
functions.
Multivariate analyses of microsatellite data. As part of data We estimated how well supported the group mem-
exploration, we performed several multivariate analy- bership was relative to collection locality. Posterior
ses, which do not make strong assumptions about the group memberships can be used to indicate admixture
underlying genetic model (Jombart et al. 2009). We con- or misclassification when prior groups are used to con-
ducted discriminant analysis of principal components duct the DAPC. We repeated the DAPC, grouping sam-
(DAPC), which finds principal components best sum- ples by region or country of origin (Fig. 2B).
marizing the differences between these clusters while Membership assignment probabilities to each region
minimizing within-cluster variation (Jombart et al. based on retained discriminant functions were com-
2010). DAPC was carried out with the adegenet 1.3-8 pared to the groups identified by K-means. Posterior
package (Jombart & Ahmed 2011) implemented in R assignment probabilities to a priori selected groups
3.0.1 (R Development Core Team 2013). As we wanted indicate the validity of a given group.
a na€ıve comparison between this method and the
Bayesian clustering methods, we assumed no prior Bayesian clustering of microsatellite data. As the multi-
group membership and used sequential K-means clus- variate methods inferred cluster sizes varying up to
tering (up to K = 15) and model selection to infer 10-fold, we used the Bayesian clustering software
genetic groups. The Bayesian information criterion STRUCTURAMA 2.0 (Huelsenbeck et al. 2011) to assign
(BIC) (Schwarz 1978) was used to assess the support for samples to clusters, which has been shown to outper-
the model (i.e. the number of clusters and assignment form other methods (Fogelqvist et al. 2010; Hausdorf
of individuals to them), which is an efficient measure of & Hennig 2010). STRUCTURAMA uses a Dirichlet process
support (Lee et al. 2009). Although K-means clustering prior (DPP) to calculate the posterior probability of
is performed on transformed data using PCA, we used numbers of populations in the data set (Pella & Masu-
all 145 principal components, thus retaining all varia- da 2006), which has been shown to be an efficient and
tion of the original data. We used 109 iterations and 103 powerful method to infer population structure (Huel-
random starting centroids for each run, which both aid senbeck & Andolfatto 2007; Onogi et al. 2011; Shrin-
in the convergence of the algorithm. To not overfit the garpure et al. 2011). STRUCTURAMA implements a
discriminant function, we chose the optimal number of Hierarchical Dirichlet Process model (Teh et al. 2006)
principal components for the DAPC using the to accommodate admixture of infinite ancestral popu-
optim.a.score function. The a-score captures the trade-off lations while treating the number of populations as a
between the power of discrimination and overfitting random variable.
using too many principal components in the analysis by As this model is computationally demanding, we ran
measuring the proportion of successful reassignments short exploratory analyses to assess the impact of the
of the DAPC analysis compared to K-means clustering model (admixture vs. no admixture), concentration prior
(observed discrimination) and random clustering (ran- and hyperpriors on the analysis, with five or ten repli-
dom discrimination). Subsequent DAPCs were con- cates for each model to test for consistency between
ducted with three principal components (explaining analyses. Following the recommendations of Francßois &
37.8% of variance) and three retained discriminant func- Durand (2010), we employed various models using Ba-
tions. The use of principal components also ensures that yes Factor to guide model choice. While we recognize
information provided to the discriminant analysis is un- that the harmonic mean reported by Structurama is a
correlated, thus removing potential effects of linkage poor estimator of the marginal likelihood as its variance
disequilibrium. Plotting discriminant functions with is often unreasonably large, we found that K = 4 was
© 2014 John Wiley & Sons Ltd378 D . G O T Z E K E T A L .
A W-13 CBR QMX2 QMX CAS6
B India 0.5
Taiwan 1.0
China 0.0
Philippines 0.0
Thailand 0.0
Hawaii 0.0
Malagasy 0.0
Christmas Isl. 0.0
Australia 1.0
Texas 1.0
Mexico 0.5
Mesoamerica 0.6
0.3
Caribbean 0.0
Venezuela 0.8
Florida 0.4
Trinidad&Tobago 1.0
French Guiana 1.0
Peru 0.0
Brazil 1.0
CAS6
Fig. 2 Cluster assignment and admixture proportions as inferred by A) Structurama for K = 4 and B) DAPC using collection sites as
prior clusters. The heatmap (red = 1, white = 0) shows proportions of successful reassignment of individuals to their original clus-
ters. Sites and their successful reassignments proportions are in rows, and individuals and their prior cluster (i.e. collection sites; blue
crosses) are in columns. Large values indicate clear-cut clusters, and low values suggest admixed or poorly supported groups. Well-
supported sites (≥0.8 reassignment proportions) are indicated in bold.
most often chosen, regardless of model used. In addition single chain run for 100 000 generations with a burnin
to the marginal likelihood (which were often very similar of 100.
between analyses), we also used low sum of squares
score for mean partition (i.e. the partition distance; Huel- General description of genetic variation. Measures of
senbeck & Andolfatto 2007) to identify the best analysis. genetic diversity and population differentiation were
This partition distance, which is the minimum number separately estimated for the mtDNA and microsatellite
of individuals that must be moved between populations data sets using the groups identified by the clustering
in one of the partitions to make it identical to the other methods. We analysed the mtDNA using MEGA 5.2.2
partition (Gusfield 2002), measures the stability the parti- (Tamura et al. 2011) and DNASP 5.10.01 (Librado & Ro-
tioning scheme of a given analysis. zas 2009). All sequences were included in these
For the final model, we fixed a to give the desired analyses, not only unique haplotypes. For the nuclear
mean of the prior for the expected number of popula- data, we calculated indices of genetic variation with
tions [E(K) = 5] and modelled admixture using a GENODIVE 2.0 (Meirmans & Van Tienderen 2004) and
gamma distribution shape and scale parameters GENEALEX 6.5 (Peakall & Smouse 2012). Following Meir-
(hyperpriors) set to 1 each. All analyses were con- mans & Hedrick (2011), we report pairwise population
ducted with the program default of sampling from a FST, G’’ST and D values (Hedrick 2005; Jost 2008;
© 2014 John Wiley & Sons LtdG L O B A L I N V A S I O N O F T H E T R O P I C A L F I R E A N T 379
Gerlach et al. 2010; Meirmans & Hedrick 2011) as none Assignment and exclusion tests of microsatellite
is an ideal summary statistic. We used nearly unbi- data. Assignment and exclusion tests were carried out
ased estimates of heterozygosity (HS and HT) (Nei & with GENECLASS2 (Piry et al. 2004) using Bayesian
Chesser 1983) to reduce the bias of D and G’’ST values approaches, which generally outperform distance and
due to small sample size of some of the inferred pop- frequency-based approaches (Paetkau et al. 2004). We
ulations. Statistical significance of pairwise FST values used the four native clusters as determined by the clus-
was tested using an analysis of molecular variance tering methods as reference populations. Assignment
with 10 000 permutations (Excoffier et al. 1992; Micha- tests were used to assign individuals collected in non-
lakis & Excoffier 1996) with Bonferroni correction (Rice native areas to reference clusters from the native range.
1989). Assignment probabilities of ≥95% to a given source
population were considered to be significant support
Phylogenetic analyses. To obtain a more explicitly phylo- for the native population to be the source of invasives.
genetic perspective of the relationships between clusters In the absence of statistically significant assignment
using the microsatellite data, we constructed a neigh- probabilities, the native reference population showing
bour-joining tree (Saitou & Nei 1987) of interindividual the highest average likelihood value was considered the
Nei’s chord distances (DA; Nei et al. 1983) using the most likely source population. Results of the Bayesian
neighbor program in the PHYLIP 3.69 package (Felsenstein assignment tests were independent of the prior used
2005). This is expected to reflect genealogical relation- (Rannala & Mountain 1997; Baudouin & Lebrun 2000).
ships when a large number of informative markers are However, assignment methods assume that the actual
used (Chakraborty & Jin 1993; Bowcock et al. 1994). We source population is represented among the reference
used Nei’s chord distance as it has been shown to out- populations and can thus erroneously assign individu-
perform other distance measures for reconstructing als to one or another reference population with high
phylogenetic trees using microsatellite data (Takezaki & probability if the true source population has not been
Nei 1996, 2008). One thousand bootstrap replicates were sampled (Paetkau et al. 2004). Exclusion tests are not
used to estimate branch support. prone to such an error, as they can exclude all reference
Bayesian inference of the mtDNA genealogy was per- populations as putative sources of introduced popula-
formed using BEAST 1.7.5 (Drummond et al. 2012). We tions. To perform exclusion tests, we used the resam-
estimated the best fitting partition and model of nucle- pling algorithm of Paetkau et al. (2004), as other Monte
otide substitution using the greedy heuristic search Carlo resampling methods (Rannala & Mountain 1997;
algorithm in PARTITIONFINDER 1.1. (Lanfear et al. 2012), Cornuet et al. 1999) exclude an excess of resident indi-
which selected the HKY+I, F81 and GTR+G model for viduals. All simulations were conducted with 100 000
the first, second and third codon position, respectively. simulated individuals and an alpha level of 0.01.
Clock and tree models were linked across partitions, Once individuals from the invasive range were
but substitution models remained unlinked. We assigned to reference source populations, we tested
applied an exponential size coalescent model (Griffiths whether any of these were first-generation migrants. As
& Tavare 1994) with a lognormal prior on the coales- we could not be confident that we have sampled every
cent size parameter to estimate the tree. All other native population, we used both the likelihood of an
priors were kept at default. As we did not extensively individual’s genotype within the population where the
sample the outgroup species and this violates the individual has been sampled (L_home) and the ratio of
assumption of random sampling of OTUs in coalescent L_home to the highest likelihood value among all popu-
analyses (Wakeley 2008), we conducted the phyloge- lations excluding the population where the individual
netic analyses with and without outgroups. No signifi- was sampled (L_home/L_max) as statistical criteria for
cant differences were found. Ten million generations the detection of first-generation migrants (Paetkau et al.
were run, sampled every 1000th generation, of which 2004). While the likelihood ratio L_home/L_max has
the first 10% were discarded as burn-in. Stationarity of more power than the L_home statistic, it is only appro-
the runs was assessed in TRACER 1.5 (Rambaut & Drum- priate if all source populations for immigrants have
mond 2007) by plateauing of log-likelihoods and effec- been sampled. The L_home statistic is more appropriate
tive sample sizes (ESS) >200. Four independent runs when some source populations are clearly missing (Pae-
were combined, all of which had similar mean log-like- tkau et al. 2004; Piry et al. 2004).
lihoods. To test for undue influence of the priors on
the posterior parameter estimates, we compared poste- Testing invasion scenarios using approximate Bayesian com-
riors from analyses estimated by sampling with and putation. We used approximate Bayesian computation
without (i.e. sampling only from the prior distribution) (ABC; Beaumont 2010; Bertorelle et al. 2010) to compare
data. invasion scenarios and infer the invasion history of the
© 2014 John Wiley & Sons Ltd380 D . G O T Z E K E T A L .
tropical fire ant. ABC is a Bayesian inference approach tables with 105 simulated data sets per scenario for
that does not require the specification of a likelihood analyses A–C and 106 data sets per scenario for analysis
function and can hence be used to efficiently carry out D for parameter estimation. To lighten the computa-
complex model-based inferences using large numbers tional burden for analyses D), we used LDA-trans-
of simulated data sets which are compared to the formed summary statistics (Estoup et al. 2012). For
observed data set using summary statistics. All steps of analyses (A–C), we used raw summary statistics.
the analyses were conducted with DIYABC 2.0 (Cornuet To reveal model (scenario) and/or prior misspecifica-
et al. 2014) using only microsatellite data. To limit the tion prior to full analyses, we pre-evaluated scenario
number of scenarios to test and for lack of a robust and and prior distributions using both PCA and locating
reliable evolutionary history of the native populations observed within simulated summary statistics (Cornuet
due to rooting problems of both the microsatellite and et al. 2010) to verify that at least one prior–scenario
mtDNA trees, we first sought to determine the source combination can produce simulated data sets that are
population(s) of the introduced clusters. To this end, sufficiently close to the observed data set.
we tested three competing scenarios (Fig. S3, Support- We estimated posterior probabilities of competing
ing information), with successively more narrowly scenarios using polychotomous logistic regression of the
defined putative source populations. For these analyses, 1% simulated data sets closest to the observed data set
we considered the invasives to belong to one popula- (which is generally more discriminant than the direct
tion and successively more narrowly defined two com- estimates). We assessed confidence in scenario choice
peting putative source populations, loosely following by computing 95% confidence intervals and type I and
the clusters recovered with increasing K: (A) the South II errors for the most probable scenario of analysis D.
American and TexMex/Meso1/Meso2/Caribbean clus- We validated the choice of thresholds by repeating pos-
ters; (B) the TexMex/Meso2 and Meso1/Caribbean clus- terior probability calculations with fewer (0.1% and
ters; and (C) the TexMex and Meso2 clusters. The three 0.0025%) and more (10% and 0.1%) simulated data sets
competing scenarios allowed the introduced population (Cornuet et al. 2008; Guillemaud et al. 2010), which pro-
to derive from one or the other source population or to duced similar results.
be admixed from both. We estimated parameters after applying a logit trans-
Second, we tested more complex and specific inva- formation to the parameter values of the 1% simulated
sion scenarios in analyses D from which we also data sets closest to the observed data set. Use of other
derived parameter estimates of invasion times, bottle- transformations (log or log-tangent transformation; Es-
neck sizes and duration (Fig. S4, Supporting informa- toup et al. 2004; Hamilton et al. 2005) produced similar
tion). For this analysis, we recognized the Australian, results (not shown). We additionally measured the per-
Indo-Pacific and Meso2 clusters and we sought to dis- formance of parameter estimation by calculating the
tinguish between four invasion scenarios: an indepen- median of the absolute error divided by the true param-
dent invasion, a serial invasion, an independent eter value of the 500 pseudo-observed data sets simu-
invasion from an unsampled ghost population and a lated using the median and mode of the posterior
serial invasion from an unsampled ghost population distribution as point estimates (relative median absolute
(Fig. S4A, Suporting information). errors, RMAE). Finally, we performed model checking
Following Cornuet et al. (2008), we considered only with all summary statistics not used for the primary
the simple generalized stepwise-mutation model analysis using both PCA and ranking of summary sta-
(Estoup et al. 2002) to reduce the number of parameters. tistics (Cornuet et al. 2010) to assess the goodness-of-fit
We left the mutation model at default settings. We also of our model/parameter/posterior combination.
implemented a 5:6 female to male sex ratio (Travis
1941) and haplo-diploid locus model for all analyses,
Results
although these settings did not substantially influence
the results (not shown). We only considered uniform
Population structure
priors and the following constraints on parameters:
db < t1 < t2 < ta, Nb < N. For analyses A–C, we kept Four to nine clusters were supported by K-means clus-
all parameter priors at their default. We set N = [10– tering and Bayesian methods (Fig. 1, Fig. S1A, Support-
10 000], t1,2 = [150–1000], ta = [10–10 000] and db = [1– ing information). Four clusters represent the simplest
1000] for analysis D. We used mean size variance, mean summary of the data at the highest hierarchical level
number of alleles, mean Garza-William’s M index (Evanno et al. 2005), but the substantial substructure, in
across loci, (dl)2 distance between samples, mean size both geographic and discriminant space (Fig. 1), sug-
variance across loci, mean number of alleles across loci gests eight clusters among which genetic differentiation
and FST as summary statistics. We produced reference was pronounced and always statistically significant
© 2014 John Wiley & Sons LtdG L O B A L I N V A S I O N O F T H E T R O P I C A L F I R E A N T 381
after Bonferroni correction (P < 0.0005; Table S3, Sup- populations (n = 106) contain the vast majority of
porting information). Stability of group membership mtDNA diversity (57 haplotypes; Table S2, Supporting
probabilities, derived from proportions of successful information), whereas the putative invasive ants
reassignments based on retained discriminant functions (n = 75) shared a total of 4 haplotypes. One of these
of the DAPC based on maximal substructuring, was (CAS6 from Reunion Island) is shared with two native
high (100% for the New World clusters and >82% for specimens collected in the Caribbean islands of Turks
the Old World clusters compared to 0–50% of random and Caicos. Two specimens from Hawaii and a single-
clustering (Fig. S2, Supporting information). ton from Christmas Island share the second haplotype.
Of the eight clusters, five were in the New World The third haplotype is unique to a sample from the
(Fig. 1B) and were consistently recovered in both global Philippines. All remaining Old World samples (93%;
and New World-only analyses. The South American n = 70) and a single specimen from Brazil (BrGem)
cluster contains all specimens from the Amazon, Gui- share the fourth and most common haplotype. This
ana Shield, Brazilian coast and Florida. The Caribbean haplotype is thus found throughout the Indo-Pacific
cluster contains samples from Panama, central Venezu- region (Madagascar, Reunion Island, Mauritius, Aus-
ela, the Dominican Republic, the Grand Turks, all sam- tralia, India, the Philippines, Thailand, China and Tai-
ples from the Galapagos and one individual from wan). The low number of haplotypes is reflected in
Reunion (CAS6). The TexMex cluster contains samples the very low estimate of mitochondrial diversity (Table
from Texas and northern Mexico. The first Mesoameri- S2, Supporting information). The nuclear genome of
can cluster (Meso1; containing samples from Costa Rica, the Old World clusters showed similar patterns of
Nicaragua, Honduras, Guatemala and a singleton from reduced genetic diversity relative to the native popula-
Mexico) partially overlaps the more northern second tions, but to a lesser degree (Table S2, Supporting
Mesoamerican cluster (Meso2; with samples from Mex- information).
ico, Guatemala, Belize and a singleton from Costa Rica).
Finally, three clusters were identified in the Old
Admixture
World (Fig. 1B). Minimum-spanning trees of cluster
centroids and distance in discriminant space of New to Bayesian posterior assignment probabilities of individu-
Old World samples suggest a close affinity between als to a single cluster were generally very high (>99%;
Mesoamerica and the Old World. Global analyses and Fig. 2A), indicating that there is little evidence for
Bayesian analyses of Old World samples only differenti- admixture between clusters, with few exceptions. Two
ate between the Australian cluster (containing all sam- Meso2 samples from the Yucatan (QMX and QMX2)
ples from Australia, Christmas Island and a singleton contained a minority proportion (6.7% and 25.6%,
from Reunion (CAS3)) and an Indo-Pacific cluster (con- respectively) of their genome from the Meso1 cluster. A
taining all other Old World samples). K-means cluster- Brazilian sample, W-13, was also admixed, with a small
ing of Old World samples supports further proportion (7.8%) of its genome derived from the Old
substructure. At K = 3, the Indo-Pacific cluster is split World clusters. Finally, CBR from Jalisco, Mexico was
into the Indo-Pacific1 (containing samples from Hawaii, estimated to derive 23.3% of its genome from the Old
Taiwan, India and all samples from China, Thailand World cluster.
and Madagascar) and Indo-Pacific2 clusters (containing Reassignment of individuals to areas of origin based
the remaining samples from Hawaii, Taiwan and India, on the discriminant function of the DAPC (Fig. 2B)
all samples from the Philippines and one sample from resulted in seven sites having high (≥80%) reassign-
Mauritius). Due to the relatively poor separation in dis- ment proportions, indicating clear-cut groups. Six
criminant space and decreasing stability of group mem- strongly differentiated clusters can be visually recog-
bership relative to the New World clusters in the global nized mirroring the results of the clustering methods,
analysis, we chose to ignore finer substructure (Fig. 2B, validating our recognition of substructure in the data
Fig. S2, Supporting information). set, especially in the New World. Assignment propor-
tions for sites and clusters outside the cluster inferred
by the clustering methods were generally zero, indicat-
Estimates of diversity
ing no admixture between clusters. Assignment propor-
Estimates of genetic diversity show a reduction in the tions were often distributed across sites within a given
Old World clusters in both the nuclear and cytoplas- cluster, indicating lack of within-cluster structure. Sub-
mic genomes, pointing to an invasive origin of these structure is also visible in the Old World, suggesting
samples (Tables S3 and S4, Supporting information). that recognition of an Australian cluster is valid. CAS6
There were a total of 64 unique haplotypes in 186 from Reunion is again not reassigned to its sampled
mtDNA sequences generated. The putative native site.
© 2014 John Wiley & Sons Ltd382 D . G O T Z E K E T A L .
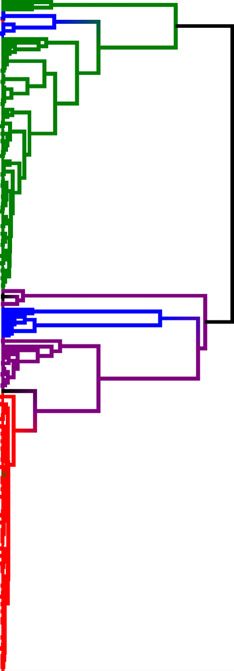
Phylogenetic analyses incorrectly assign individuals to a reference population
with high probability if the true source population is
Both the nuclear NJ tree and mtDNA coalescent generally
not sampled. Exclusion tests do not suffer from this
recover the same groups as the clustering methods
problem. Exclusion probabilities for our data set were
(Fig. 3). Importantly, in both data sets, CBR from south-
generally very low (P < 0.05), suggesting that we have
ern Jalisco, Mexico is always the sister group to the inva-
not sampled the true source population. However,
sive clade (with high support) and CAS6 from Reunion
Meso2 could not be excluded as source population for
falls within a clade of Caribbean cluster samples (the
most samples (at P ≥ 0.01). Meso2 was excluded as
Dominican Republic and Venezuela). In the NJ tree
source population only for CAS6, for which the Carib-
(Fig. 3A), the Philippine and most Taiwanese samples
bean cluster could not be excluded (P = 0.164). Both the
are sister to all samples within the Indo-Pacific clade, and
direct likelihood (L_home) and likelihood ratio
the Australian cluster is situated well within the invasive
(L_home/L_max) methods identified CAS6 from
samples. Despite uncertainty in rooting and lack of sup-
Reunion as a first-generation migrant with high proba-
port for the deeper nodes in the mtDNA tree (Fig. 3B),
bility (95% probability (Table S4, Supporting infor- was always preferred over an independent invasion sce-
mation), with five exceptions. CAS6 from Reunion had nario, indicating one initial invasion event took place
a 100% assignment probability to the Caribbean cluster with subsequent dispersal within the Old World (Fig.
and four samples had a majority assignment to the S4A, Supporting information). Scenarios including an un-
TexMex cluster, but only one of these was significant sampled ghost population were also always preferred
at 95% assignment probability. Assignment tests can over scenarios in which the source population had been
A B Fig. 3 Phylogenetic hypotheses based on
nuclear (A) and cytoplasmic (B) ge-
nomes. Cluster membership is indicated
by colour (red: Indo-Pacific & Australia;
green: South America; blue: TexMex &
Meso2; purple: Caribbean & Meso1). The
three Mexican samples which are incon-
sistently placed between the Meso1 and
Meso2 clusters are in black. Branch sup-
port is indicated by red (1.0) and black
(0.95–0.99) stars; only deeper nodes are
labelled. A) Bootstrapped (1000 repli-
cates) neighbour-joining tree using micro-
satellite Nei’s chord distances. B)
Bayesian maximum clade credibility tree
based on mtDNA sequences.
© 2014 John Wiley & Sons LtdG L O B A L I N V A S I O N O F T H E T R O P I C A L F I R E A N T 383
sampled. Scenario 3 (serial invasion from a ghost popula- TFA, one of the most widely distributed pest ants, and
tion) had the highest posterior probability (PP = 0.6575), describe its invasion history in great detail. We show
and its 95% CI (0.5802, 0.7348) did not overlap with the that the Old World samples are introduced and derived
95% CI of the next best scenario (scenario 1; Fig. S4A, from a single New World source population. Multiple
Supporting information). Type I and II errors were esti- lines of evidence support the Meso2 cluster and more
mated at 0.31 and 0.124, respectively. specifically, southwestern Mexico, as the likely source,
Posterior distributions of parameters are well esti- including results from clustering methods, admixture
mated with peaked posteriors and clear differences to proportions, assignment and exclusion tests, measures
prior distributions and generally low RMAE values of genetic diversity, tree-based methods and ABC.
(Table 1, Fig. S4B, Supporting information). Estimates of Creighton (1930) was the first to recognize the connec-
population size indicate large effective population sizes tion between the Old World and Mexican populations
for both native and invasive populations. Founding of the TFA, pointing out that the Old World S. g. rufa
propagule size estimates are also rather large, which form was especially common in Texas and Mexico. Our
explains the modest loss of nuclear diversity in the analyses further suggest the invasive populations origi-
introduced populations. The rather old divergence time nated during one main introduction period followed by
of the ghost population suggests it is a native and not more recent long distance dispersal events from other
an invasive population. Divergence estimates of the source populations.
invasive populations using the mode indicate the Divergence time estimates of the invasive popula-
founding event occurred approximately 241 generations tions from the native source population suggest that
ago (95% CI 178, 938). This places the initial invasion the main founding event(s) occurred in the early 16th
event in the early 16th century, based on colony repro- century, a time of burgeoning colonialism and trade.
ductive ages of 2 years. The Australian cluster diverged These results are consistent with historical data. Since
approximately in the mid-19th century (~ 163 genera- the early 15th century, Europeans explored and traded
tions). The bottlenecks were estimated to be quite long with Africa, Asia, the Americas and Oceania. This Age
(~100 generations). of Exploration culminated in the first truly global trade
network by way of the Spanish Manila galleon trade,
which connected the Asian and American markets
Discussion
(Flynn & Gir aldez 2004). For 250 years (from 1565 to
We use nuclear and cytoplasmic genotype data for sam- 1815 CE), one or two Spanish galleons set sail annually
ples collected throughout the known global range of the to trade New World silver for Chinese silk, porcelain
and spices in Manila (Spate 2004). Importantly, the
Table 1 Demographic parameter estimates, their relative med-
Spanish-Mexican colonists not only brought maize,
ian absolute errors (RMAE) and their 95% confidence interval sweet potatoes and other crops to Asia, but addition-
of scenario 3 using ABC based on simulated 1% of simulated ally carried rock, sand and soil for ballast (Carlton
data sets closest to the observed values. All population sizes 1992), giving ample opportunity for entire TFA colo-
(N) are effective population sizes. Nxb: bottlenecked founding nies to have been inadvertently transported during
populations, db: bottleneck duration, ty: divergence time. Time these long trans-Pacific voyages. Manila served as a
(t and db) is given in generations
hub for Spanish trade with the Chinese Ming and Qing
RMAE RMAE q q
Dynasties via the southern Chinese province of Fujian
Parameter Median (median) Mode (mode) [2.5] [97.5] and to a lesser degree with Canton (Guangdong) prov-
ince and the Molucca Spice Islands. Thus, the Spanish
N1 9230 0.141 9430 0.150 7110 9960 Philippines were well connected with the main trade
(Meso2) centres of Asia, not only via the Portuguese and Dutch
N2 4290 0.184 1800 0.253 990 9590 trade networks, but perhaps more importantly through
(Austral.)
an already existing vast and sophisticated Asian net-
N2b 589 0.306 381 0.325 116 2770
N3 1530 0.147 1010 0.172 354 7790 work (Spate 2004; Bjork 2005). The expansive and
(Indo-P.) dynamic 16th–18th century trade system would have
N3b 357 0.371 156 0.452 52 2450 allowed the TFA to rapidly spread to the major eco-
Nu 3920 0.245 2350 0.277 801 9530 nomic and agricultural centres of coastal Asia, Africa,
(ghost) and the Pacific and Indian Oceans.
db 123 0.452 77 0.610 11 427 The Manila galleons sailed from the Pacific port of
t1 188 0.199 163 0.208 153 357
Acapulco, Oaxaca, in southwestern Mexico. Even
t2 382 0.149 241 0.176 178 938
ta 3280 0.188 2980 0.220 850 8660 though we lack samples from this area, our sample
from Jalisco (CBR) is both geographically closest to
© 2014 John Wiley & Sons Ltd384 D . G O T Z E K E T A L .
Acapulco (~450 km) and genetically closest to the intro- southern China and Formosa (Taiwan), where the Span-
duced populations. This lack of sampling of popula- iards briefly settled in the 17th century. Finally, all analy-
tions around Acapulco and southwestern Mexico could ses suggest that the Australian cluster is derived from the
explain divergence of the introduced populations from Indo-Pacific cluster and does not represent an indepen-
the native samples (e.g. the lack of shared mitochon- dent invasion event. The ABC analysis estimates the
drial haplotypes, the inference of an unsampled native invasion of Australia and the Christmas Island occurred
ghost population and low power of the exclusion tests). more recently (188–376 years ago), which is consistent
However, low mitochondrial diversity stands in con- with the relatively late (ca. 1869 CE) European settlement
trast to the relatively high nuclear genetic diversity. of northern Australia.
Although the low mtDNA haplotype variation in the Human-mediated movement of the TFA is still ongo-
invasive ants suggests a severe bottleneck during the ing. We identified both samples from Reunion as recent
founding event or selective sweeps associated with or first-generation immigrants. While CAS3 may not be
adaptation to the new environment, the nuclear genetic an F0 migrant, CAS6 (belonging to the Caribbean clus-
diversity of invasives is comparable to the diversity ter) clearly is. Such long distance dispersals are a well-
estimates of native populations and estimates of found- known feature of invasions (Suarez et al. 2001). There
ing propagule size based on nuclear data number in the also is evidence for reintroduction of the TFA into its
hundreds. Several factors may explain this observation. native range. Two samples from Bahia, Brazil (BrGem
First, genetic bottlenecks are expected to be more severe and W-13), have admixed genomes derived from the
for the cytoplasmic than the nuclear genome due to its invasive and South American populations. A likely
smaller effective population size (Moritz et al. 1987). explanation for the genetic footprint of the invasive clus-
Second, founding propagules may have contained mul- ter in Brazil is due to a secondary invasion of TFA from
tiple reproductive queens (polygyny; Banks et al. 1973; the invasive range. Given that both samples were col-
Mackay et al. 1990). Queens in polygyne fire ant colo- lected close to the city of Salvador, the economic and
nies are often derived from the same matriline (Ross cultural hub of northeastern Brazil, it is perhaps not sur-
et al. 1996), resulting in a shared cytoplasmic genome, prising to find evidence of a secondary invasion here.
while the nuclear genome is not similarly impacted. We demonstrate that the TFA achieved its current pan-
While the social form of most introduced populations tropical distribution through Spanish trade with Asia
has not been conclusively determined, field observa- during the 16th–18th century. One major introduction
tions of nest structure and spacing suggest that polyg- event from a single source population first brought the
yny is common. Third, selective sweeps due to TFA from southwestern Mexico to the Philippines and
adaptation to the newly invaded environment or endo- then China, and from there, it was dispersed throughout
symbiont-driven reductions can result in reduced mito- the Old World tropics. However, movement of this
chondrial diversity (Hurst & Jiggins 2005; Suarez & highly invasive ant is still ongoing as indicated by the
Tsutsui 2008). On the other hand, loss of genetic diver- finding of long distance, first-generation migrants from
sity can be modest or nonexistent if the founding prop- the Caribbean to Reunion, or reintroduction from the
agule is large, the bottleneck brief and population invasive populations to the native range in Brazil. To the
growth rapid (Suarez & Tsutsui 2008). Moreover, histor- best of our knowledge, this is the first documented evi-
ical processes operating in the source population(s) dence of human-mediated introduction of a highly inva-
shape the level of genetic diversity introduced during sive pest species during the first truly global trade
the invasion process (Taylor & Keller 2007). network. Our results are in contrast to many other unin-
Despite the relative genetic homogeneity of the inva- tentionally introduced social insects where data largely
sive clusters, several inferences on the spread of the TFA supports patterns of establishment much later, ranging
within the invasive range can be made. First, the DAPC, from the late 19th century to mid-20th century (Tsutsui
minimum-spanning tree and measures of population dif- et al. 2001; Krushelnycky et al. 2005; Ascunce et al. 2011;
ferentiation indicate that the Indo-Pacific2 cluster is clos- Beggs et al. 2011; Evans et al. 2013). However, some inva-
est to the source population, suggesting that the other sive ant distributions look surprisingly similar to that of
non-native clusters stem from there. The Indo-Pacific2 TFA and already appeared to be well established by the
cluster, containing all Philippine and most Taiwanese 19th century (Wetterer 2005, 2008, 2011, 2012; Wetterer
samples, also has the highest mtDNA haplotype diversity et al. 2009). Thus, it is likely that other ants were spread
of the invasive clusters, as the two rare haplotypes are along the same maritime trade routes, a conclusion sup-
found within this cluster. The NJ tree places the Philip- ported by the fact that soil often was used as ballast
pine samples sister to the remaining invasives, followed (which was common well into the early 20th century;
by most Taiwanese samples. This is congruent with Carlton 1992), a habit that would suggest the transport of
direction of Spanish trade from Acapulco via Manila to soil nesting ant colonies is highly likely. Further study of
© 2014 John Wiley & Sons LtdG L O B A L I N V A S I O N O F T H E T R O P I C A L F I R E A N T 385
the TFA and other ant species in their native and invasive ing errors in population genetics studies. Molecular Ecology,
ranges (e.g. Suarez et al. 2001; Ascunce et al. 2011) will 13, 3261–3273.
shed light on the causes, processes and consequences of Bowcock AM, Ruiz-Linares A, Tomfohrde J, Minch E, Kidd JR,
Cavalli-Sforza LL (1994) High resolution of human evolu-
biological invasions and allow a richer assessment of the
tionary trees with polymorphic microsatellites. Nature, 368,
impact of human history on contemporary biogeographic 455–457.
patterns. Bright C (1999) Invasive species: pathogens of globalization.
Foreign Policy, 1999, 50–64.
Acknowledgements Carlton JT (1992) Blue immigrants: the marine biology of mari-
time history. Log, 44, 499–509.
We thank the following scientists and institutions for gener- Carroll CR, Risch SJ (1984) The dynamics of seed harvesting in
ously contributing specimens: B. Hoffman, K.L. Heong and the early successional communities by a tropical ant, Solenopsis
International Rice Research Institute, S. Hasin, V. Framenau geminata. Oecologia, 61, 388–392.
and the Western Australian Museum, W. Tschinkel, J. Longino, Chakraborty R, Jin L (1993) Determination of relatedness
S.C-C. Yang, L. van Aesch, D. Cherix, L. Davis, J. Orivel, B. between individuals using DNA fingerprinting. Human Biol-
Fisher, E. LeBrun, H. Herrerra, R. Arauco, K. Ross, and the ogy, 65, 875–895.
National Museum of Natural History for sharing samples. E. Chang VCS, Ota AK (1976) Fire ant damage to polyethylene
Caroll kindly provided assistance in the laboratory. M. Ciolek tubing used in drip irrigation systems. Journal of Economic
pointed out important literature. K. Ross, J. Wetterer and three Entomology, 69, 447–450.
anonymous reviewers improved the manuscript with helpful Cornuet J, Piry S, Luikart G, Estoup A, Solignac M (1999) New
comments and discussions. A.V.S. and D.G. gratefully methods employing multilocus genotypes to select or exclude
acknowledge financial support from NSF (DEB 1020979) and populations as origins of individuals. Genetics, 153, 1989–2000.
USDA APHIS (292 AG 11-8130-0068-CA). Cornuet J-M, Santos F, Beaumont MA et al. (2008) Inferring
population history with DIY ABC: a user-friendly approach
References to approximate Bayesian computation. Bioinformatics, 24,
2713–2719.
Aplin KP, Suzuki H, Chinen AA et al. (2011) Multiple geo- Cornuet J-M, Ravigne V, Estoup A (2010) Inference on popula-
graphic origins of commensalism and complex dispersal his- tion history and model checking using DNA sequence and
tory of black rats. PLoS ONE, 6, e26357. microsatellite data with the software DIYABC (v1.0). BMC Bio-
Ascunce MS, Bouwma AM, Shoemaker DD (2009) Character- informatics, 11, 401.
ization of 24 microsatellite markers in 11 species of fire ants Cornuet J-M, Pudlo P, Veyssier J et al. (2014) DIYABC v2.0: a soft-
in the Genus Solenopsis (Hymenoptera: Formicidae). Molecu- ware to make approximate Bayesian computation inferences
lar Ecology Resources, 9, 1476–1479. about population history using single nucleotide polymor-
Ascunce MS, Yang C-C, Oakey J et al. (2011) Global invasion his- phism. DNA sequence and microsatellite data. Bioinformatics,
tory of the fire ant Solenopsis invicta. Science, 331, 1066–1068. 30, 1187–1189.
Austin CC (1999) Lizards took express train to Polynesia. Nat- Creighton WS (1930) The new world species of the genus
ure, 397, 113–114. Solenopsis (Hymenop. Formicidae). Proceedings of the American
Banks WA, Plumley JK, Hicks DM (1973) Polygyny in a colony Academy of Arts and Sciences, 66, 39–151.
of the fire ant Solenopsis geminata. Annals of the Entomological Darwin C (1859) On the Origin of Species by Means of Natural
Society of America, 66, 234–235. Selection, or the Preservation of Favoured Races in the Struggle
Baudouin L, Lebrun P (2000) An operational Bayesian for Life. John Murray, London.
approach for the identification of sexually reproduced cross- Drummond AJ, Suchard MA, Xie D, Rambaut A (2012) Bayes-
fertilized populations using molecular markers. Proceedings ian Phylogenetics with BEAUTI and the BEAST 1.7. Molecular
of the International Symposium on Molecular Markers for Biology and Evolution, 29, 1969–1973.
Characterizing Genotypes and Identifying Cultivars in Horti- Estoup A, Guillemaud T (2010) Reconstructing routes of inva-
culture, March 6–9, 2000, Montpellier, France. Leuven: Inter- sion using genetic data: why, how and so what? Molecular
national Society Horticultural Science, 81–93. Ecology, 19, 4113–4130.
Beaumont MA (2010) Approximate Bayesian computation in Estoup A, Jarne P, Cornuet J-M (2002) Homoplasy and mutation
evolution and ecology. Annual Review of Ecology, Evolution, model at microsatellite loci and their consequences for popu-
and Systematics, 41, 379–406. lation genetics analysis. Molecular Ecology, 11, 1591–1604.
Beggs JR, Brockerhoff EG, Corley JC et al. (2011) Ecological Estoup A, Beaumont M, Sennedot F, Moritz C, Cornuet J-M
effects and management of invasive alien Vespidae. BioCon- (2004) Genetic analysis of complex demographic scenarios:
trol, 56, 505–526. spatially expanding populations of the cane toad, Bufo mari-
Bertorelle G, Benazzo A, Mona S (2010) ABC as a flexible nus. Evolution, 58, 2021–2036.
framework to estimate demography over space and time: Estoup A, Lombaert E, Marin J-M et al. (2012) Estimation of
some cons, many pros. Molecular Ecology, 19, 2609–2625. demo-genetic model probabilities with Approximate Bayes-
Bjork K (2005) The link that kept the Philippines Spanish: Mex- ian Computation using linear discriminant analysis on sum-
ican merchant interests and the Manila Trade, 1571–1815. mary statistics. Molecular Ecology Resources, 12, 846–855.
Journal of World History, 9, 25–50. Ettershank G (1966) A generic revision of the world Myrmici-
Bonin A, Bellemain E, Bronken Eidesen P, Pompanon F, Broch- nae related to Solenopsis and Pheidologeton (Hymenoptera:
mann C, Taberlet P (2004) How to track and assess genotyp- Formicidae). Australian Journal of Zoology, 14, 73–171.
© 2014 John Wiley & Sons Ltd386 D . G O T Z E K E T A L .
Evanno G, Regnaut S, Goudet J (2005) Detecting the number of Huelsenbeck JP, Andolfatto P, Huelsenbeck ET (2011) STRUCTU-
clusters of individuals using the software STRUCTURE: a simu- RAMA: Bayesian inference of population structure. Evolution-
lation study. Molecular Ecology, 14, 2611–2620. ary Bioinformatics, 7, 55–59.
Evans TA, Forschler BT, Grace JK (2013) Biology of invasive Hulme PE (2009) Trade, transport and trouble: managing inva-
termites: a worldwide review. Annual Review of Entomology, sive species pathways in an era of globalization. Journal of
58, 455–474. Applied Ecology, 46, 10–18.
Excoffier L, Smouse PE, Quattro JM (1992) Analysis of molecu- Hurst GDD, Jiggins FM (2005) Problems with mitochondrial
lar variance inferred from metric distances among DNA DNA as a marker in population, phylogeographic and phy-
haplotypes - application to human mitochondrial-DNA logenetic studies: the effects of inherited symbionts. Proceed-
restriction data. Genetics, 131, 479–491. ings of the Royal Society B, 272, 1525–1534.
Felsenstein J (2005) PHYLIP v.3.6. Distributed by the author. Dept. Jombart T, Ahmed I (2011) ADEGENET 1.3-1: new tools for the analy-
Genome Sci, Univ. Washington, Seattle. sis of genome-wide SNP data. Bioinformatics, 27, 3070–3071.
Fisher RN (1997) Dispersal and evolution of the Pacific Basin Jombart T, Pontier D, Dufour A-B (2009) Genetic markers in the
Gekkonid Lizards Gehyra oceanica and Gehyra mutilata. Evolu- playground of multivariate analysis. Heredity, 102, 330–341.
tion, 51, 906–921. Jombart T, Devillard S, Balloux F (2010) Discriminant analysis
Fitzpatrick BM, Fordyce JA, Niemiller ML, Reynolds RG (2012) of principal components: a new method for the analysis of
What can DNA tell us about biological invasions? Biological genetically structured populations. BMC Genetics, 11, 94.
Invasions, 14, 245–253. Jost L (2008) Gst and its relatives do not measure differentia-
Flynn DO, Giraldez A (2004) Born with a “silver spoon”: the ori- tion. Molecular Ecology, 17, 4015–4026.
gin of world trade in 1571. Journal of World History, 6, 201–221. Kirk H, Dorn S, Mazzi D (2013) Molecular genetics and genom-
Fogelqvist J, Niittyvuopio A, Agren JA, Savolainen O, Lascoux ics generate new insights into invertebrate pest invasions.
M (2010) Cryptic population genetic structure: the number of Evolutionary Applications, 6, 842–856.
inferred clusters depends on sample size. Molecular Ecology Kroll JC, Arnold KA, Gotic RF (1973) An observation of preda-
Resources, 10, 314–323. tion by native fire ants on nestling barn swallows. Wilson
Francßois O, Durand E (2010) Spatially explicit Bayesian cluster- Bulletin, 85, 478–479.
ing models in population genetics. Molecular Ecology Krushelnycky PD, Loope LL, Reimer NJ (2005) The ecology,
Resources, 10, 773–784. policy and management of ants in Hawaii. Proceedings of the
Geetha V, Ajay N, Viswananthan G, Narenda A (2000) The Hawaiin Entomological Society, 37, 1–25.
effect of urbanisation on the biodiversity of ant fauna in and Lake PS, O’Dowd DJ (1991) Red crabs in rain forest, Christmas
around Bangalore. Journal of Ecobiology, 12, 115–122. Island: biotic resistance to invasion by an exotic snail. Oikos,
Gerlach G, Jueterbock A, Kraemer P, Deppermann J, Harmand 62, 25–29.
P (2010) Calculations of population differentiation based on Lakshmikantha BP, Lakshminarayan NG, Ali TMM, Veeresh
Gst and D: forget Gst but not all of statistics!. Molecular Ecol- GK (1996) Fire-ant damage to potato in Bangalore. Journal of
ogy, 19, 3845–3852. the Indian Potato Association, 23, 75–76.
Griffiths RC, Tavare S (1994) Sampling theory for neutral Lanfear R, Calcott B, Ho SYW, Guindon S (2012) PARTITIONFIND-
alleles in a varying environment. Philosophical Transactions of ER: combined selection of partitioning schemes and substitu-
the Royal Society of London B, 344, 403–410. tion models for phylogenetic analyses. Molecular Biology and
Guillemaud T, Beaumont MA, Ciosi M, Cornuet J-M, Estoup A Evolution, 29, 1695–1701.
(2010) Inferring introduction routes of invasive species using Larson G, Albarella U, Dobney K et al. (2007) Ancient DNA,
approximate Bayesian computation on microsatellite data. pig domestication, and the spread of the neolithic into Eur-
Heredity, 104, 88–99. ope. Proceedings of the National Academy of Sciences USA, 104,
Gusfield D (2002) Partition-distance: a problem and class of 15276–15281.
perfect graphs arising in clustering. Information Processing Lee C, Abdool A, Huang C-H (2009) PCA-based population
Letters, 82, 159–164. structure inference with generic clustering algorithms. BMC
Hamilton G, Currat M, Ray N, Heckel G, Beaumont M, Excof- Bioinformatics, 10, S73.
fier L (2005) Bayesian estimation of recent migration rates Librado P, Rozas J (2009) DNASP v5: a software for comprehen-
after a spatial expansion. Genetics, 170, 409–417. sive analysis of DNA polymorphism data. Bioinformatics, 25,
Hausdorf B, Hennig C (2010) Species delimitation using domi- 1451–1452.
nant and codominant multilocus markers. Systematic Biology, Lowry E, Rollinson EJ, Laybourn AJ et al. (2013) Biological
59, 491–503. invasions: a field synopsis, systematic review, and database
Hedrick PW (2005) A standardized genetic differentiation mea- of the literature. Ecology and Evolution, 3, 182–196.
sure. Evolution, 59, 1633–1638. Mackay WP, Porter S, Gonzalez D et al. (1990) A comparison
Hoffman JI, Amos W (2005) Microsatellite genotyping errors: of monogyne and polygyne populations of the tropical fire
detection approaches, common sources and consequences for ant, Solenopsis geminata (Hymenoptera: Formicidae), in Mex-
paternal exclusion. Molecular Ecology, 14, 599–612. ico. Journal of the Kansas Entomological Society, 63, 611–615.
Holway DA, Lach L, Suarez AV, Tsutsui ND, Case TJ (2002) McGlynn TP (1999) The Worldwide transfer of ants: geographi-
The causes and consequences of ant invasions. Annual Review cal distribution and ecological invasions. Journal of Biogeogra-
of Ecology and Systematics, 33, 181–233. phy, 26, 535–548.
Huelsenbeck JP, Andolfatto P (2007) Inference of population Meirmans PG, Hedrick PW (2011) Assessing population struc-
structure under a dirichlet process model. Genetics, 175, ture: FST and related measures. Molecular Ecology Resources,
1787–1802. 11, 5–18.
© 2014 John Wiley & Sons LtdYou can also read