Global trade landscape in an uncertain world - Asiafruit ...
←
→
Page content transcription
If your browser does not render page correctly, please read the page content below
September 2019

                                                                    Global trade landscape
                                                                     in an uncertain world

                                                                                  Raymond Yeung 杨宇霆
                                                                          Chief Economist, Greater China
                                                                                     research@anz.com

Follow us on Twitter
@ANZ_Research

This is not personal advice. It does not consider your objectives
or circumstances. Please refer to the Important Notice.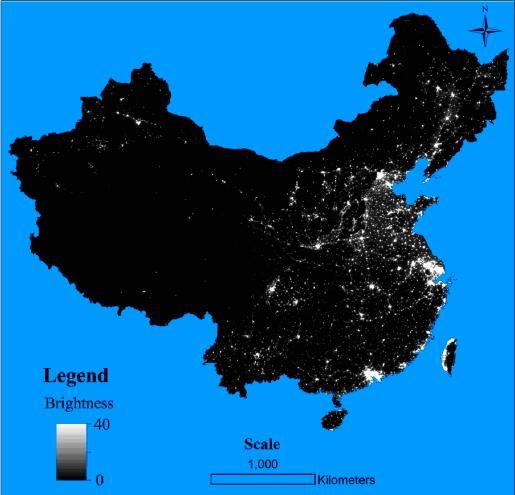
Market view: Decade-long low interest rate regime
 suggests structural economic slowdown quantitatively

                        The best proxy: US Treasury 10y vs growth
16                                                        12                                                                         4.5

                                                          10                                                                         4.0

14                                                         8                                                                         3.5
                                                                                                                                     3.0
                                                           6

12                                                         4
                                                                                                                                     2.5
                                                                                                                                     2.0
                                                           2
                                                                                                                                     1.5
10                                                         0                                                                         1.0
                                                          -2                                                                         0.5

 8                                                        -4
                                                           Oct-09 Nov-10 Dec-11   Jan-13   Feb-14 Mar-15 Apr-16 May-17 Jun-18   Jul-19
                                                                                                                                      0.0

                                                                                     ISM (+/- 50) (RHS)    UST 10y
 6
 4
 2                                                                                                            For 2019-23,
                                                                                                              2% is likely a
                                                                                                              natural rate
 0                                                                                                            for long-term
                                                                                                              risk free
-2                                                                                                            funding

-4
     1981 1984 1987 1990 1993 1996 1999 2002 2005 2008 2011 2014 2017 2020 2023

                                  US nominal GDP, % y/y            UST 10y, %

Source: Bloomberg, ANZ Research
                                                                                                                                            2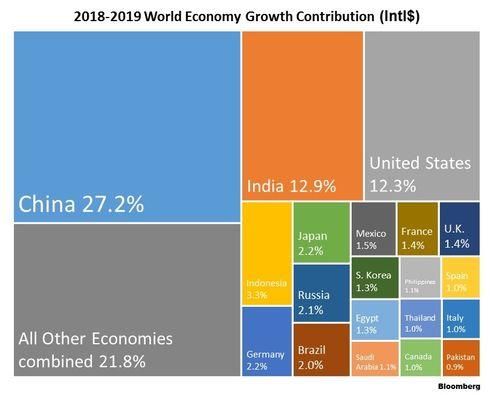
U-turn of the Fed opens the door for rate cuts in Asia Pacific
                                                                                  Fed funds rate and LIBOR
                                                                 6

                                                                 5
                                               Cut
                                                                 4

                                                                 3

                                  Cut
                                                                 2

                                                                 1

                                                                 0
            Cut                                                      2005 2006 2007 2008 2009 2010 2011 2012 2013 2014 2015 2016 2017 2018 2019

                                                                                            USD LIBOR 3m       Fed funds rate
                                        Cut

                                                     Cut
                                                                                Central       Interest rate action
                            Cut                                                 bank
                                                                                PBOC          Push lending rate lower via LPR
                                              Cut

                                                                                BOK           Cut repo rate 25bps in Jul

                                                                                BSP           Cut reverse repo 25bps in May

                                                                                BOT           Cut benchmark rate 25bps in Jul

                                                                                BMN           Cut overnight rate 25bps in May

                                                           Cut
                                                                                BI            Cut reverse repo 50bps since Jul

                                                                                RBI           Cut repo rate 75bps since Dec 18

                                                                                RBA
                                                                                Cut
                                                                                              Cut cash rate 50bps since May

                                                                                RBNZ          Cut cash rate 25bps in May

Source: Bloomberg, ANZ Research                                                                                                                   3
The trade war drives the market’s risk-on-risk-off mode
Aug:
Trump
announced
to increase
12 Sep: tariffs on
US expressed USD300bn
interest to Chinese
10 Jul, USTR resume goods to
released the trade talks 10% from 1
tariff list of 17 Sep: Sept. He
USD200bn for US announced also
public comment USD200bn tweeted to
tariffs (first escalate the
1 Aug: tranche 13 May: tariff level
USTR raised to effective 24 China retaliated higher and
25% additional Sep); Trump by increasing ban US
tariffs on threatened to 5 May: tariffs on companies
USD200bn of expand it to 1 Dec: Trump threatened from doing
16 Apr: USD60bn of US
2-4 Jun: Chinese goods, USD267bn. Xi and Trump to increase tariffs Jul: China
goods
US banned US Commerce from 10% China met at G20 to 25% from 10% China and business on
16 May: US
firms from selling Secretary retaliated on in Argentina, on USD200bn of the US national
1 Mar: Jan-Apr 2019: banned Huawei
parts to ZTE for Wilbur Ross 3 Aug: 18 Sep agreeing on a goods effective 10 made two emergence.
US announced tariffs on visited China China retaliated 90-day truce China and US 2 Jun: phone calls The US
seven years May, citing China’s
steel and aluminium in kind on 24 Sep: conducted 10 China released a in mid treasury
5 Dec: USTR back-pedalling on
imports 3-4 May: US 15-16 Jun: USD60bn of US China rounds of trade trade war white designated
postponed its commitments. July. The
Treasury Secretary US goods released talks in Beijing paper. China as a
tariff hike to USTR confirmed US
7 Mar: Mnuchin visited announced White paper and 3 Jun:
7 Aug: 2 March 2019 the decision on 9 confirmed currency
ZTE pleaded guilty to Beijing additional reiterating its Washington, CH held a press
USTR published usual tone May that manipulator
charges of violating US 25% tariffs 14 Dec: with both sides conference
tariff list for 2nd against US Mnuchin . USDCNY
sanctions on USD50bn China sending 10 May: clarifying China’s
22 Jan: and broke ‘7’ for
tranche of trade temporarily positive signals. USTR mulled tariff bottom line to
US approved of Chinese Lighthizer the first
USD16bn measures removed During this rise on the resume the trade
safeguard 17-20 May: goods (the will travel time since
Chinese goods, additional period, both remaining Chinese negotiation
tariffs on Vice Premier Liu He first tranche to 2008. China
effective 23 Aug Mid Oct: tariffs on US sides said to goods to the US. 29 Jun: Trump
imported visited US. China, of USD34bn Shanghai retaliated
washing effective 13 Aug: Trump Trump and Xi goods, further The US refused to and Xi agreed on with tariffs
US issued a joint for the
machines, 22 Mar: Trump announced 6 July). China signed NDAA, agreed to including postpone March allow China Mobile a truce, without on
statement vowing trade talks
solar cells additional tariffs on retaliated in strengthening meet at G20 autos until 31 tariff hikes until to provide telecom a specified USD75bn
not to launch a on 30-31
and modules USD50bn of Chinese goods kind the CFIUS in Dec 2018 March 2019 further notice. services in US timeline goods.
trade war Jul.
NDAA: John S. McCain National Defense Authorization Act for FY2019; CFIUS: Committee on Foreign Investment in the US.
Source: USTR, China MoFCoM, China MoF, Bloomberg, ANZ Research. 4The impact of headline trade figures is largely expected
The US imports from China China export figures
China’s exports in value added terms and the impact of tariffs
Goods value exports to the US % of China’s % of China’s Impact:
USD bn total export GDP by value 10%/20%/30%
2018 added reduction
50 2% 0.2%(North) Asia – The center of the global supply chain
Asia exports and the global electronic supply chain
6
Source: CEIC, ANZ Research 6Trump’s shock would make a wave of corporate migration
Top 10 exporters in China-US trade*
CNY bn
0 200 400 600 800
Hon Hai
Quanta
Pegatron
Dell
Compal
ASUS
Inventec
LG
Flextronics
Shenzhen Yidatong
Total exports by group, 2018
Numbers shown here represent each company’s total exports from China to the world in 2018.
Breakdown of their exports to the US is not available.
*Disclaimer: The data is estimated by aggregating individual entities of the same company, Therefore,
subject to error given holding structure unknown to the authors.
Source: China Customs, OECD, Bloomberg, ANZ Research 7The trade war may help spur Belt and Road countries unintendedly
US imports from other markets
US high tech imports from other markets
Source: Bloomberg, ANZ Research
8The nature, impact and outlook of the China-US trade war
Trade dispute reflects fundamental differences Trade tariffs will impact both countries
• The US adopts a unilateral approach while China • Exports to the US represent 22% of China’s total
advocates multilateral platforms, ie WTO. But the exports and 2.7% of GDP. We expect 25% increase in
USTR has questioned China’s WTO commitments for tariffs on Chinese goods to cause a 20% decline in
many years. shipments, detracting 0.5% from China’s GDP.
• China sees the dispute to be mainly trade issues but • Global (electronics) supply chains have been
the US is concerned about China’s tech supportive disrupted. Manufacturers will accelerate to shift
policy and intellectual property rights protection. production away from China to, eg Southeast Asia,
especially for low margin, unsophisticated products.
• The US (and allies) do not welcome China’s
overseas acquisitions and 5G initiatives, citing • US buyers have likely suffered from higher prices due
national security issues. China views this as a to import tariffs in 2018, according to US-based
policy of containment, and a challenge to its economists. The impact on US GDP is not easy to
national dignity. quantify but growth uncertainty has prompted the
Fed to cut interest rate in July.
Deadlock will remain till 2020 Other event risks deserved attention
• As stated in our trade war primer in September • Financial weapons: China’s push for a more flexible
2018 (link) and May 2019 (link), the trade war will exchange rate regime does not intend for a currency
not be resolved through trade negotiations. war. But if the US decides to ‘intervene’ the FX
market, China may reassess the currency risk of its
• Our view remains that the trade war was originated holding of US Government securities.
from dollar reserve currency status (link). With
national security consideration now, China-US • Sanction risks: The US began to ban business
bilateral economic relationship becomes more transactions with some Chinese companies on an
complicated. ‘entity list’. Earlier, Washington Post reported that
the US Justice Department accused some Chinese
• Trump’s administration will not soften its stance banks involved transactions with North Korea.
while China will retaliate. Both parties do not view
each other to be trustworthy. The lack of a • Geopolitical events: Any sign of geopolitical
resolution will continue to drive market volatility conflicts will bode ill for long-term economic
through 2020. relationship.
Please click on the ANZ logo to return to this slide at any stage.
9China remains critically important to global growth
10Long term: Productivity and value added - more important
Output = function (Labour, Capital, Technology)
Y = AKaLb
ln(Y) = ln(AKbL(1-b)) = ln(A)+a*ln(K) + b*ln(L)
where ln(Y) = GDP growth
When K and L are falling, only ln(A) can help lift growth.
Economists call ln(A) Total Factor Productivity.
11China perceives Japan’s experiences to be instructive
Faced with an ageing population in the 2000s, Japan had difficulty recovering from the
property market collapse in the early 1990s as the economy was mired in a liquidity trap.
China’s current population profile is similar to Japan’s in the 2000s, and thus it is also
wary of property bubbles and liquidity trap.
China in 2017 Japan in the 2000s
95+ 95+
90-94 90-94
85-89 85-89
80-84 80-84
75-79 75-79
70-74 70-74
65-69 65-69
60-64 60-64
55-59 55-59
Age Groups
Age Groups
50-54 50-54
45-49 45-49
40-44 40-44
35-39 35-39
30-34 30-34
25-29 25-29
20-24 20-24
15-19 15-19
10-14 10-14
5-9 5-9
0-4 0-4
5 3 1 1 3 5 5 3 1 1 3 5
Male Female % of total population Male Female % of total population
Source: National statistical authorities, ANZ Research
12Policymakers are aware of the demographic challenges
Aged 15-64 share of total population %
2011
1992
2007
2035
2047
Source: World Bank, ANZ Research
13Major Chinese cities are the principal sources of economic activity
Among China’s 283 prefectural cities, the top 10 comprises almost a quarter of China’s
GDP and the top 20 account for more than one-third. Economists believe agglomeration
can create economic value through localisation (industry) and urbanisation (size). In the
US, Silicon Valley and Los Angeles are examples of these scale economies, respectively.
GDP of China’s prefectural cities in 2017 (cumulative share to national total)
% 0 5 10 15 20 25 30 35 40
Shanghai
Beijing
Shenzhen
Guangzhou
Chongqing
Tianjin
Suzhou
Chengdu
Wuhan
Hangzhou
Nanjing
Qingdao
Changsha
Wuxi
Ningbo
Foshan
Zhengzhou
Nantong
Dongguan
Quanzhou
Source: CEIC. ANZ Research
14Counting on China’s domestic growth driver, i.e city clustering
Satellite image of night lights shows three major
GDP GDP Population Companies
city clusters currently. China plans to unleash (% per (% of on Fortune
potential economic value via city integration, of total) cap, total) 500 list
involving both soft and hard infrastructure. CNY
Beijing-Tianjin-Hebei
CNY8.5trn 76k 113m State Grid,
(10%) (8%) Sinopec, China
National
Petroleum, Bank
of China, ICBC,
China Mobile, JD,
Sinochem,
CNOOC, COFCO
Yangtze River Delta
CNY21.1trn 94k 225m Alibaba, SAIC
(26%) (16%) Motor, Bank of
Communications,
China Pacific
Insurance, SHPD
Bank, Greenland,
Geely
Greater Bay Area
CNY8.1trn 140k 62m Tencent, Huawei,
(10%) (excl. (5%) ZTE, Ping An
excluding HK and excl. Insurance, China
CNY2.6trn Macau) 8m of Southern Power
of HK and HK and Grid. Country
Macau Macau Garden, Midea,
Vanke
Source: CEIC, ANZ Research
Source: Huimin Xu et al, “Multi-scale Measurement of Regional Inequality in Mainland
Note: Data of Yangtze River Delta include
China during 2005-2010 using DMSP/OLS Night Imagery and Population Density Grid Shanghai, Jiangsu, Zhejiang and Anhui. Land
Data”, Sustainability 2015, 7, 13469-99 area are based on 2008 land survey. 15China plans to push Shenzhen’s experience further
Hong Kong and Shenzhen GDP per capita
120,000
Basic Law* 2047: SZ>HK
100,000
2017: SZ/HK = 63%
80,000
Deng Southern Visit:
USD
60,000 SZ/HK=13%
40,000
20,000
0
1992 1998 2004 2010 2016 2022 2028 2034 2040 2046
China Hong Kong Shenzhen
*The Basic Law Article 5: The socialist system and policies shall not be practised in the Hong Kong Special Administrative
Region, and the previous capitalist system and way of life shall remain unchanged for 50 years.
Source: CEIC, ANZ Research
16Asia will rely on domestic consumption to boost growth
We have used World Bank data for household consumption in several Asian economies, including
China, India, Indonesia, South Korea, Malaysia, Philippines, Singapore, Thailand and Vietnam, to
extrapolate nominal consumption in 2024 using a 5-year CAGR from 2014 to 2018. By 2024, the
Asian consumer market will reach USD13trn. This represents 74% of US consumption. China will
contribute about 62% of Asia’s expansion from 2018 to 2024.
Household consumption of Asian economies: Actual and projection
14,000 80
12,000 70
60
10,000
50
8,000
USD bn
%
40
6,000
30
4,000
20
2,000 10
0 0
2012 2018 2024
CHN IND KOR SGP IDN
MLY VNM THA PHL % of US
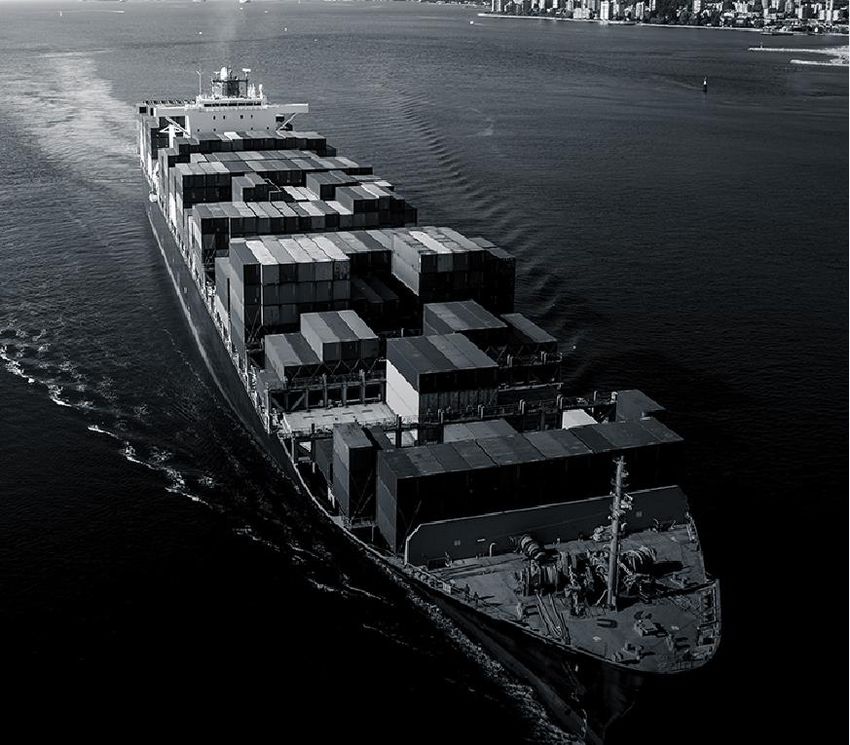
Source: World Bank, CEIC, ANZ Research 17NZ exports mirror the quality consumption theme of China
NZ exports to China rose to NZD17bn in 2018, up 14.6%, despite the global trade
tension. Goods exports rose 15% to NZD13bn. New Zealand received 448,189 Chinese
visitors in 2018, up 7%. Tourism exports reached NZD1.6bn, up 13%. Education exports
was NZD1.3bn, up 11%.
New Zealand's trade with China
Year ended December
2014 2015 2016 2017 2018
Up 20.4%
NZ$(million)
12mma July
Exports
Goods 9,986 8,611 9,432 12,094 13,898
Services 2,034 2,947 3,055 3,067 3,431
Total 12,021 11,558 12,487 15,161 17,329
Major goods exports
Milk pow der, butter, and cheese 4,293 2,419 2,683 4,080 4,321
Logs, w ood, and w ood articles 1,731 1,551 1,970 2,482 2,913
Meat and edible offal 1,058 1,211 1,011 1,437 1,991
Fruit 168 359 445 454 606
Fish, crustaceans, and molluscs 423 485 560 523 581
Source: StatsNZ, ANZ Research
18Important notice [3 July 2019] This document is intended for ANZ’s Institutional, Markets and Private Banking clients. It should not be forwarded, copied or distributed. The information in this document is general in nature, and does not constitute personal financial product advice or take into account your objectives, financial situation or needs. This document may be restricted by law in certain jurisdictions. Persons who receive this document must inform themselves about and observe all relevant restrictions. Disclaimer for all jurisdictions: This document is prepared by Australia and New Zealand Banking Group Limited (ABN11 005 357 522) (ANZ), a company incorporated in Australia. It is distributed in your country/region by ANZ or (if stated below) its subsidiary or branch (each, an Affiliate). This document is distributed on the basis that it is only for the information of the specified recipient or permitted user of the relevant website (recipients). This document is solely for informational purposes and nothing contained within is intended to be an invitation, solicitation or offer by ANZ to sell, or buy, receive or provide any product or service, or to participate in a particular trading strategy. Distribution of this document to you is only as may be permissible by the laws of your jurisdiction, and is not directed to or intended for distribution or use by recipients resident or located in jurisdictions where its use or distribution would be contrary to those laws or regulations, or in jurisdictions where ANZ would be subject to additional licensing or registration requirements. Further, the products and services mentioned in this document may not be available in all countries. ANZ in no way provides any financial, legal, taxation or investment advice to you in connection with any product or service discussed in this document. Before making any investment decision, recipients should seek independent financial, legal, tax and other relevant advice having regard to their particular circumstances. Whilst care has been taken in the preparation of this document and the information contained within is believed to be accurate, ANZ does not represent or warrant the accuracy or completeness of the information, except with respect to information concerning ANZ. Further, ANZ does not accept any responsibility to inform you of any matter that subsequently comes to its notice, which may affect the accuracy of the information in this document. Preparation of this document and the opinions expressed in it may involve material elements of subjective judgement and analysis. Unless specifically stated otherwise: they are current on the date of this document and are subject to change without notice; and, all price information is indicative only. Any opinions expressed in this document are subject to change at any time without notice. ANZ does not guarantee the performance of any product mentioned in this document. All investments entail a risk and may result in both profits and losses. Past performance is not necessarily an indicator of future performance. The products and services described in this document may not be suitable for all investors, and transacting in these products or services may be considered risky. ANZ expressly disclaims any responsibility and shall not be liable for any loss, damage, claim, liability, proceedings, cost or expense (Liability) arising directly or indirectly and whether in tort (including negligence), contract, equity or otherwise out of or in connection with this document to the extent permissible under relevant law. Please note, the contents of this document have not been reviewed by any regulatory body or authority in any jurisdiction. ANZ and its Affiliates may have an interest in the subject matter of this document. They may receive fees from customers for dealing in the products or services described in this document, and their staff and introducers of business may share in such fees or remuneration that may be influenced by total sales, at all times received and/or apportioned in accordance with local regulatory requirements. Further, they or their customers may have or have had interests or long or short positions in the products or services described in this document, and may at any time make purchases and/or sales in them as principal or agent, as well as act (or have acted) as a market maker in such products. This document is published in accordance with ANZ’s policies on conflicts of interest and ANZ maintains appropriate information barriers to control the flow of information between businesses within it and its Affiliates. Your ANZ point of contact can assist with any questions about this document including for further information on these disclosures of interest. Australia. ANZ holds an Australian Financial Services licence no. 234527. For a copy of ANZ's Financial Services Guide please click here or request from your ANZ point of contact. Brazil, Brunei, India, Japan, Kuwait, Malaysia, Switzerland, Taiwan. This document is distributed in each of these jurisdictions by ANZ on a cross-border basis. Cambodia. This document is distributed in Cambodia by ANZ Royal Bank (Cambodia) Limited (ANZ Royal Bank). The recipient acknowledges that although ANZ Royal Bank is a subsidiary of ANZ, it is a separate entity to ANZ and the obligations of ANZ Royal Bank do not constitute deposits or other liabilities of ANZ and ANZ is not required to meet the obligations of ANZ Royal Bank. European Economic Area (EEA): United Kingdom. ANZ is authorised in the United Kingdom by the Prudential Regulation Authority (PRA) and is subject to regulation by the Financial Conduct Authority (FCA) and limited regulation by the PRA. Details about the extent of our regulation by the PRA are available from us on request. This document is distributed in the United Kingdom by Australia and New Zealand Banking Group Limited ANZ solely for the information of persons who would come within the FCA definition of “eligible counterparty” or “professional client”. It is not intended for and must not be distributed to any person who would come within the FCA definition of “retail client”. Nothing here excludes or restricts any duty or liability to a customer which ANZ may have under the UK Financial Services and Markets Act 2000 or under the regulatory system as defined in the Rules of the PRA and the FCA. Fiji. For Fiji regulatory purposes, this document and any views and recommendations are not to be deemed as investment advice. Fiji investors must seek licensed professional advice should they wish to make any investment in relation to this document. Hong Kong. This publication is issued or distributed in Hong Kong by the Hong Kong branch of ANZ, which is registered at the Hong Kong Monetary Authority to conduct Type 1 (dealing in securities), Type 4 (advising on securities) and Type 6 (advising on corporate finance) regulated activities. The contents of this publication have not been reviewed by any regulatory authority in Hong Kong. India. If this document is received in India, only you (the specified recipient) may print it provided that before doing so, you specify on it your name and place of printing. Myanmar. This publication is intended to be general and part of ANZ’s customer service and marketing activities when implementing its functions as a licensed bank. This publication is not Securities Investment Advice (as that term is defined in the Myanmar Securities Transaction Law 2013). New Zealand. This document is intended to be of a general nature, does not take your financial situation or goals into account, and is not a personalised adviser service under the Financial Advisers Act 2008 (FAA). When distributed by ANZ in New Zealand, this document is intended only for “wholesale” clients as defined in the FAA.
Important notice
Oman. ANZ neither has a registered business presence nor a representative office in Oman and does not undertake banking business or provide financial services in Oman. Consequently ANZ is
not regulated by either the Central Bank of Oman (CBO)or Oman’s Capital Market Authority (CMA). The information contained in this document is for discussion purposes only and neither
constitutes an offer of securities in Oman as contemplated by the Commercial Companies Law of Oman (Royal Decree 4/74) or the Capital Market Law of Oman (Royal Decree 80/98), nor does it
constitute an offer to sell, or the solicitation of any offer to buy non-Omani securities in Oman as contemplated by Article 139 of the Executive Regulations to the Capital Market Law (issued vide
CMA Decision 1/2009). ANZ does not solicit business in Oman and the only circumstances in which ANZ sends information or material describing financial products or financial services to
recipients in Oman, is where such information or material has been requested from ANZ and the recipient understands, acknowledges and agrees that this document has not been approved by
the CBO, the CMA or any other regulatory body or authority in Oman. ANZ does not market, offer, sell or distribute any financial or investment products or services in Oman and no subscription
to any securities, products or financial services may or will be consummated within Oman. Nothing contained in this document is intended to constitute Omani investment, legal, tax, accounting
or other professional advice.
People’s Republic of China (PRC). This document may be distributed by either ANZ or Australia and New Zealand Bank (China) Company Limited (ANZ China). Recipients must comply with
all applicable laws and regulations of PRC, including any prohibitions on speculative transactions and CNY/CNH arbitrage trading. If this document is distributed by ANZ or an Affiliate (other than
ANZ China), the following statement and the text below is applicable: No action has been taken by ANZ or any affiliate which would permit a public offering of any products or services of such an
entity or distribution or re-distribution of this document in the PRC. So, the products and services of such entities are not being offered or sold within the PRC by means of this document or any
other document. This document may not be distributed, re-distributed or published in the PRC, except under circumstances that will result in compliance with any applicable laws and regulations.
If and when the material accompanying this document relates to the products and/or services of ANZ China, the following statement and the text below is applicable: This document is distributed
by ANZ China in the Mainland of the PRC.
Qatar. This document has not been, and will not be:
• lodged or registered with, or reviewed or approved by, the Qatar Central Bank (QCB), the Qatar Financial Centre (QFC) Authority, QFC Regulatory Authority or any other authority in the State
   of Qatar (Qatar); or
• authorised or licensed for distribution in Qatar,
and the information contained in this document does not, and is not intended to, constitute a public offer or other invitation in respect of securities in Qatar or the QFC. The financial products or
   services described in this document have not been, and will not be:
• registered with the QCB, QFC Authority, QFC Regulatory Authority or any other governmental authority in Qatar; or
• authorised or licensed for offering, marketing, issue or sale, directly or indirectly, in Qatar.
Accordingly, the financial products or services described in this document are not being, and will not be, offered, issued or sold in Qatar, and this document is not being, and will not be,
distributed in Qatar. The offering, marketing, issue and sale of the financial products or services described in this document and distribution of this document is being made in, and is subject to
the laws, regulations and rules of, jurisdictions outside of Qatar and the QFC. Recipients of this document must abide by this restriction and not distribute this document in breach of this
restriction. This document is being sent/issued to a limited number of institutional and/or sophisticated investors (i) upon their request and confirmation that they understand the statements
above; and (ii) on the condition that it will not be provided to any person other than the original recipient, and is not for general circulation and may not be reproduced or used for any other
purpose.
Singapore. This document is distributed in Singapore by the Singapore branch of ANZ solely for the information of “accredited investors”, “expert investors” or (as the case may be) “institutional
investors” (each term as defined in the Securities and Futures Act Cap. 289 of Singapore). ANZ is licensed in Singapore under the Banking Act Cap. 19 of Singapore and is exempted from holding
a financial adviser’s licence under Section 23(1)(a) of the Financial Advisers Act Cap. 100 of Singapore.
United Arab Emirates (UAE). This document is distributed in the UAE or the Dubai International Financial Centre (DIFC) (as applicable) by ANZ. This document does not, and is not intended
to constitute: (a) an offer of securities anywhere in the UAE; (b) the carrying on or engagement in banking, financial and/or investment consultation business in the UAE under the rules and
regulations made by the Central Bank of the UAE, the Emirates Securities and Commodities Authority or the UAE Ministry of Economy; (c) an offer of securities within the meaning of the Dubai
International Financial Centre Markets Law (DIFCML) No. 12 of 2004; and (d) a financial promotion, as defined under the DIFCML No. 1 of 200. ANZ DIFC Branch is regulated by the Dubai
Financial Services Authority (DFSA) ANZ DIFC Branch is regulated by the Dubai Financial Services Authority (DFSA). The financial products or services described in this document are only
available to persons who qualify as “Professional Clients” or “Market Counterparty” in accordance with the provisions of the DFSA rules. In addition, ANZ has a representative office (ANZ
Representative Office) in Abu Dhabi regulated by the Central Bank of the UAE. The ANZ Representative Office is not permitted by the Central Bank of the UAE to provide any banking services
to clients in the UAE.
United States. Except where this is a FX- related document, this document is distributed in the United States by ANZ Securities, Inc. (ANZ SI) which is a member of the Financial Regulatory
Authority (FINRA) (www.finra.org) and registered with the SEC. ANZSI’s address is 277 Park Avenue, 31st Floor, New York, NY 10172, USA (Tel: +1 212 801 9160 Fax: +1 212 801 9163).
ANZSI accepts responsibility for its content. Information on any securities referred to in this document may be obtained from ANZSI upon request. This document or material is intended for
institutional use only – not retail. If you are an institutional customer wishing to effect transactions in any securities referred to in this document you must contact ANZSI, not its affiliates. ANZSI
is authorised as a broker-dealer only for institutional customers, not for US Persons (as “US person” is defined in Regulation S under the US Securities Act of 1933, as amended) who are
individuals. If you have registered to use this website or have otherwise received this document and are a US Person who is an individual: to avoid loss, you should cease to use this website by
unsubscribing or should notify the sender and you should not act on the contents of this document in any way. Non-U.S. analysts: Non-U.S. analysts may not be associated persons of ANZSI and
therefore may not be subject to FINRA Rule 2242 restrictions on communications with the subject company, public appearances and trading securities held by the analysts. Where this is an
FX-related document, it is distributed in the United States by ANZ's New York Branch, which is also located at 277 Park Avenue, 31st Floor, New York, NY 10172, USA (Tel: +1 212 801 916 0
Fax: +1 212 801 9163).
Vietnam. This document is distributed in Vietnam by ANZ or ANZ Bank (Vietnam) Limited, a subsidiary of ANZ.
You can also read