HEALTH & WELLBEING PROFILE 2020 - City of Melton
←
→
Page content transcription
If your browser does not render page correctly, please read the page content below
City of Melton

HEALTH & WELLBEING
PROFILE 2020
Acknowledgement of Traditional Owners
Melton City Council acknowledges Aboriginal and/or Torres Strait Islander peoples living and working
in Melton. Council recognises the people of the Kulin Nations as the original custodians of the land
now known as City of Melton. On behalf of the municipality, Council pays respect to their Elders, past,
present and future.

                                                                                                      2
Contents

EXECUTIVE SUMMARY………………………………………………………………………………………5
1. INTRODUCTION ................................................................................................................................. 7
  1.1 Map of the City of Melton ................................................................................................................ 7
  1.2 History ............................................................................................................................................. 8
2. CONTEXT ........................................................................................................................................... 9
  2.1 Purpose ......................................................................................................................................... 11
  2.2 Methodology ................................................................................................................................. 11
  2.3 Limitations ..................................................................................................................................... 11
3. About our City- demographic characteristics .................................................................................... 13
  3.1 Growth .......................................................................................................................................... 13
  3.2 Age profile ..................................................................................................................................... 14
  3.3 Household type ............................................................................................................................. 15
  3.4 Cultural and religious diversity ...................................................................................................... 17
  3.5 Key learnings – About our City- demographic characteristics ...................................................... 20
4. Social and economic conditions ........................................................................................................ 21
  4.1 Education ...................................................................................................................................... 21
  4.2 Employment .................................................................................................................................. 24
  4.3 Unemployment .............................................................................................................................. 26
  4.4 Income .......................................................................................................................................... 27
  4.5 SEIFA Index of relative disadvantage........................................................................................... 28
  4.6 Perceptions of safety .................................................................................................................... 29
  4.7 Crime ............................................................................................................................................ 30
  4.8 Family violence ............................................................................................................................. 31
  4.9 Child abuse ................................................................................................................................... 33
  4.10 Elder abuse ................................................................................................................................. 33
  4.11 Homelessness and housing stress ............................................................................................. 35
  4.12 Food security .............................................................................................................................. 36
  4.13 Gambling ..................................................................................................................................... 37
  4.14 Racism and other forms of discrimination .................................................................................. 37
  4.15 Social connection and participation ............................................................................................ 37
  4.16 Digital literacy.............................................................................................................................. 39
  4.17 Domestic work, care and childcare ............................................................................................. 40
  4.18 Health and community service access and use ......................................................................... 42
  4.19 Liveability .................................................................................................................................... 43
  4.20 Key learnings – social and economic conditions ........................................................................ 45
5. Health behaviours ............................................................................................................................. 46
  5.1 Nutrition ......................................................................................................................................... 46
  5.2 Physical activity............................................................................................................................. 47
  5.3 Smoking, alcohol and other drugs ................................................................................................ 48

                                                                                                                                                           3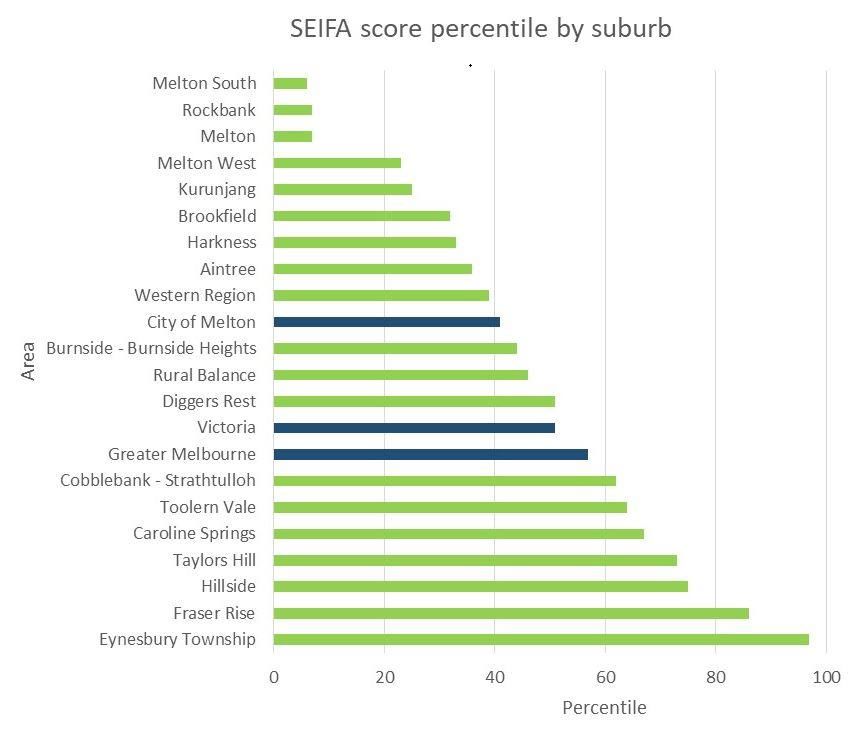
5.4 Screening and immunisation ........................................................................................................ 49
  5.5 Key learnings – health behaviours................................................................................................ 50
6. Health conditions ............................................................................................................................... 51
  6.1 Burden of disease ......................................................................................................................... 51
  6.2 Chronic disease ............................................................................................................................ 52
  6.3 Hospitalisations ............................................................................................................................. 54
  6.4 Mental health ................................................................................................................................ 55
  6.5 Sexual and reproductive health .................................................................................................... 56
  6.6 Key learnings – health conditions ................................................................................................. 57
7. Our community experiencing disadvantage ...................................................................................... 58
  7.1 Low income households ............................................................................................................... 58
  7.2 Aboriginal and/or Torres Strait Islander communities ................................................................... 58
  7.3 LGBTIQA+ communities ............................................................................................................... 60
  7.4 Culturally and linguistically diverse communities .......................................................................... 62
  7.5 People with disability .................................................................................................................... 63
  7.6 Carers ........................................................................................................................................... 65
  7.7 Women .......................................................................................................................................... 65
  7.8 Key learnings – our community experiencing disadvantage ........................................................ 66
8. Climate change and health ............................................................................................................... 67
  8.1 Tree canopy .................................................................................................................................. 67
  8.2 Heat vulnerability .......................................................................................................................... 68
  8.3 Carbon emissions ......................................................................................................................... 69
  8.4 Climate change impacts on health................................................................................................ 71
  8.5 Key learnings –climate change and health ................................................................................... 74
9. Victorian Public Health and Wellbeing Plan 2019-2023 ................................................................... 75
10. Summary ......................................................................................................................................... 76
11.0 Glossary of terms .......................................................................................................................... 79
12. References ...................................................................................................................................... 84

                                                                                                                                                         4
EXECUTIVE SUMMARY
This Health and Wellbeing Profile seeks to outline the major health and social needs within
the City of Melton. Through the examination of the wider determinants of health, the Profile
will not only outline health and wellbeing concerns but will promote an understanding of the
broader causes of those conditions and issues.
The following information summaries the community’s health and wellbeing status.

Our community
   •   Population is 172,500
   •   Second fastest growing municipality in Victoria
   •   Median age is 33 years compared to 37 years in Greater Melbourne
   •   30% of population were born overseas (compared to 28.4% born overseas in
       Victoria) - India (3.8%), Philippines (2.9%), United Kingdom (2.4%), New Zealand
       (2.1%) and Malta (1.5%)
   •   56.6% of households include children
   •   Higher percentage of single parent households 13.2% compared to 10.1% in Greater
       Melbourne
   •   4.9% residents reported needing assistance in their day-to-day lives due to disability
       compared to Greater Melbourne 4.9%
   •   1,290 residents (0.95%) identify as Aboriginal and/or Torres Strait Islander compared
       to the Victorian Aboriginal and/or Torres Strait Islander population of 0.7% .
Risk factors
   •   30% of adults are obese compared to the Victorian average of 19.27%
   •   17.5 per 100 adults has circulatory system disease compared to 16.6 per 100 adults
       Victorian average
   •   20% residents experience high or very high psychological distress compared to the
       Victorian average of 15.4%
   •   6 per 100 residents have type 2 diabetes compared to the Victorian average of 4.7
       per 100
   •   Chlamydia rates are 29.46 per 10,000 women and 26.58 per 10,000 men compared
       to the Victorian average of 20.8 per 10,000 women and 18.1 per 10,000 men
Lifestyle and behaviours
   •   21% of residents smoke tobacco daily compared to the Victorian average of 10%
   •   58% of residents do not meet the fruit and vegetable consumption guidelines
       compared to 51% in Greater Melbourne
   •   17% of residents consume sugar sweetened drinks daily compared to 9% in Greater
       Melbourne
   •   4.3% of residents are sedentary compared to 2.5% Victorian average
   •   $67.8 million was lost on gaming machines, the 16th highest pokies expenditure in
       Victoria

                                                                                                5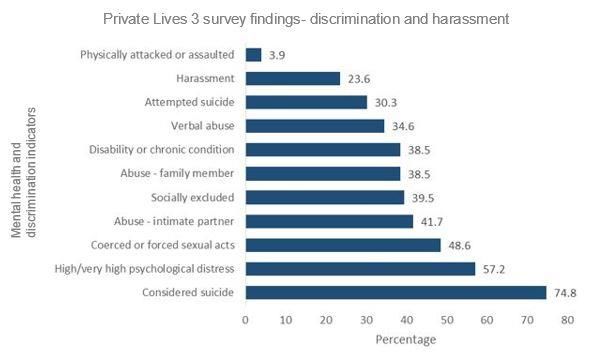
Environmental determinants
Social and cultural
• The number of overseas born residents increased from 9,393 to 13,142 (+3,752)
between 2011 and 2016
• 51% of residents completed Year 12 compared to 59.4% in Greater Melbourne
• Third highest rate of family violence in metropolitan Melbourne with a rate of
1,669 per 100,000 persons (or 2,870 incidents). The rate in Victoria is 1,315 per
100,000 residents.
• 87% of residents agreed that they felt safe walking alone during the day
compared to the Victorian average of 93%
Economic
• Fourth highest rate of unemployment with 8.8% compared to 6.3% in Greater
Melbourne
• 10.4% of households have no internet connection compared to 11.3% in Greater
Melbourne
• SEIFA score is 994 compared to the Victorian average of 1010
• 3.5% of households experience food insecurity compared to the Victorian average
of 4.26%
• 12.3% of households experience mortgage stress compared to the Victorian
average of 10.2%
• 30.6% of households experience rental stress compared to the Victorian average
of 27.2%
Built/Natural
• 63% of households have two or more vehicles compared to 50.7% of households
in Greater Melbourne
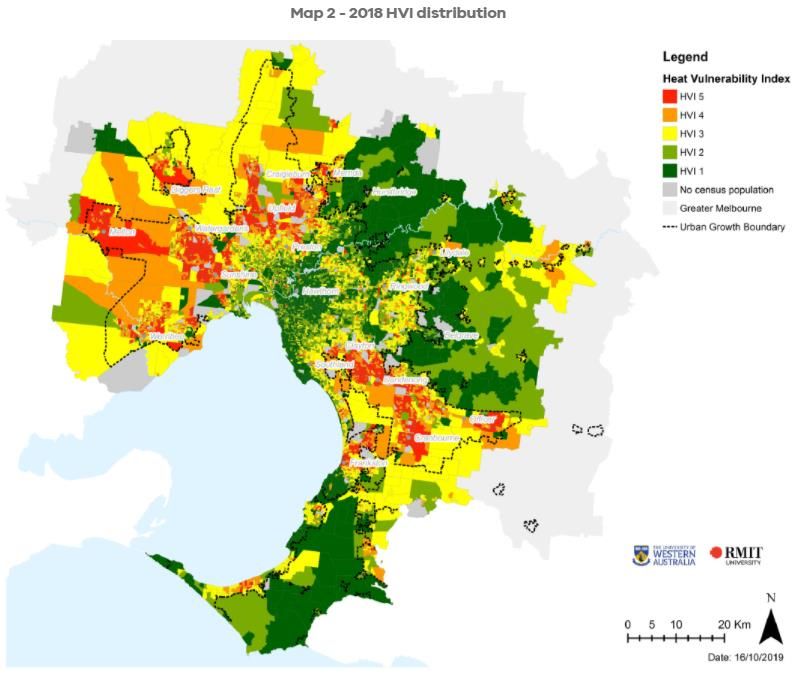
• The City has the lowest tree canopy in metropolitan Melbourne at only 4.1%
compared with the metropolitan Melbourne average of 16.2%
• The City has a high vulnerability to heat with a score of 5 on the Heat Vulnerability
Index
Figure 1: Health and wellbeing status in the City of Melton
6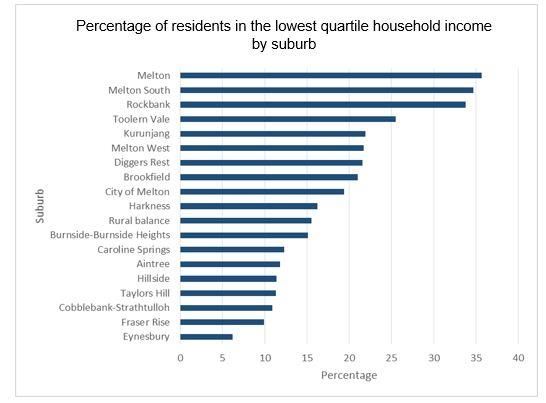
1. INTRODUCTION
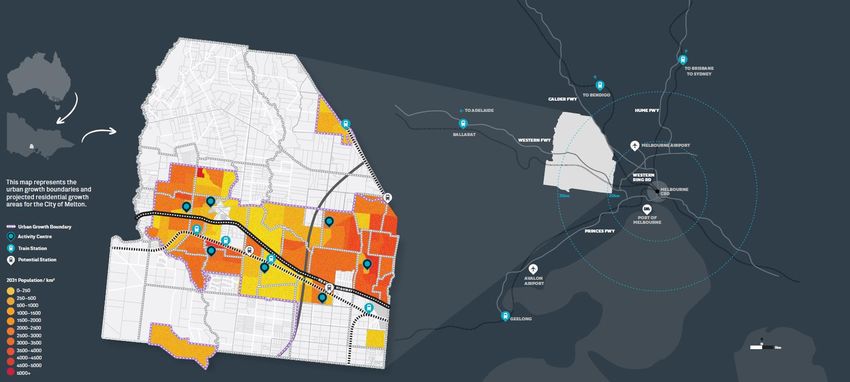
The City of Melton is a key part of Melbourne’s western growth corridor. It is directly
connected by the Western Ring Road and Deer Park bypass to Melbourne’s major freeways,
main airport, major industrial hub and the Port of Melbourne. The Western Highway, an
important national freight route runs through the City. The City of Melton is within a
comfortable driving distance north west of the Melbourne Central Business District (CBD).
The City’s residential population is currently concentrated in Melton township and the
eastern corridor districts.
Melton Township comprises the suburbs of Melton, Melton West, Harkness, Melton South,
Kurunjang, and Brookfield and is centred on the Melton major activity centre, around 35
kilometres north west of the Melbourne CBD. The Township continues to grow while
preserving features of its rural heritage.
The City of Melton’s eastern corridor is centred on the major activity centre of Caroline
Springs, approximately 19 kilometres north west of the Melbourne CBD. The eastern corridor
includes the suburbs of Burnside, Burnside Heights, Caroline Springs, Hillside and Taylors
Hill. This district has been the focus of most of the population growth over the past two
decades.
Increasingly, the focus of development is in growth suburbs including Diggers Rest, Aintree,
Bonnie Brook, Cobblebank, Deanside, Fieldstone, Fraser Rise, Grangefields, Ravenhall,
Rockbank, Strathtulloh, Thornhill Park, Truganina and Weir Views.
The City of Melton also has a number of significant rural areas including Parwan, Plumpton,
Mount Cottrell, Exford, parts of Diggers Rest, Toolern Vale and Eynesbury.
1.1 Map of the City of Melton
Figure 2: Map of the City of Melton
7
1.2 History
The City of Melton has a rich Aboriginal heritage which goes back over 40,000 years. Two
different but related language groups, each made up of a number of individual clans, lived in
the areas now covered by the Melton Local Government Area. These two language groups
are the Wurundjeri Woi-Wurrung and Wada-Wurrung peoples.

These two Traditional Owner groups form two of the five tribes that make up the Kulin
Nations. Historically and today, the inheritance of cultural practice for next generations is
important, encouraging connection to people and places. City of Melton Aboriginal and/or
Torres Strait Islander community members are diverse, coming from the two Traditional
Owner groups, but also many Aboriginal nations and clans from across Australia.

Aboriginal stone tools and camp sites have been found along local water courses, as well
as a number of scarred trees where bark had been excised out of the tree without causing
harm to the ongoing health of the tree. This bark was used for making canoes, carrying
containers, shields and shelters. There are a number of Aboriginal cultural heritage sites
in the City of Melton; the Melton Valley Golf Course canoe scar tree, the Bullum Bullum
camp site in Burnside and the site of the area’s last known corroboree of 1863 in Hannah
Watts Park, Melton.

The first European settlers arrived in the late 1830s. By 1862, Melton was created as
a district, which would develop a rich pastoral and farming heritage. This era is still evident
with numerous remaining pastoral homesteads, dry stone walls and dams.

In 1974, Melton was declared as Melbourne’s first satellite city. Extensive suburban
development led to a major increase in population through the 1980s. Throughout
the last decade, the municipality has continued to experience unprecedented
population growth and is currently recognised as one of the fastest growing municipalities
in Australia. In acknowledgement of our fast growth, Melton Shire Council was granted
city status by the State Government in September 2012 and is now known as
Melton City Council.

                                                                                                  8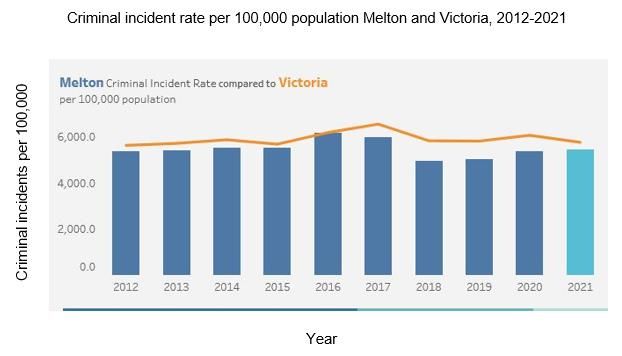
2. CONTEXT
The World Health Organisation (WHO) defines health as ‘a state of complete physical,
mental and social wellbeing and not merely the absence of disease or infirmity’ (World
Health Organisation, 2020). Health and wellbeing is driven by the interaction of individual
characteristics and lifestyle factors, and the built, social, natural and economic environments
within which people live. Factors such as income, racism, education, social networks,
employment and housing heavily influence the health and wellbeing of communities and
individuals. These are referred to as the wider determinants of health (Figure 3).

Figure 3: Wider determinants of health adapted from the Victorian Public Health and Wellbeing Plan 2019-2023
(Department of Health and Human Services, 2019)

In recognition of the wider determinants of health, the Victorian Public Health and Wellbeing
Plan (VPHWP) outlines six major contributors to health and wellbeing:
•   a fair and equal society – Those who live with greater social and economic
    disadvantage are more likely to experience health inequalities. An inclusive society that
    supports those experiencing health and social inequalities promotes health and
    wellbeing.
•   a healthy start in life – Early life experiences provide the foundations for lifelong health
    and wellbeing and require optimal caregiving, positive education, safe communities,
    secure housing, access to parklands and access to nutritious food.
•   a strong education system – Well developed literacy and numeracy skills contribute to
    social, economic and physical wellbeing and affect opportunities for education,
    employment, income and wellbeing across the life course.
•   positive employment – Secure and quality employment is protective of health and
    wellbeing (particularly mental health), provides a sense of community and social
    inclusion, and promotes financial security.

                                                                                                               9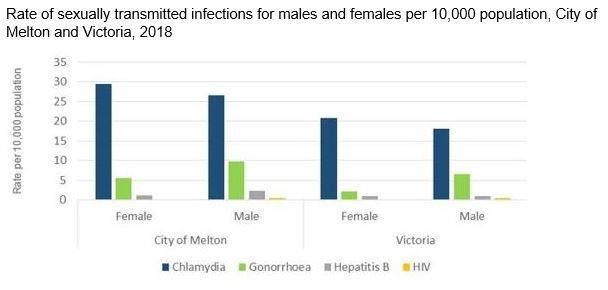
•   healthy, liveable communities – Health and wellbeing is dependent on the
    development of safe, attractive, socially cohesive and inclusive communities. There must
    be diverse and affordable housing, employment and education opportunities. Adequate
    services, transport and leisure and recreation opportunities are also required.
•   effective health protection – Protection from communicable disease through
    prevention and/or management where outbreaks occur.
There is overwhelming evidence that those who live in certain
areas experience poorer health and social outcomes than              Burden of disease is
others, and that this is largely due to the interplay of a range    50 per cent greater for
of environmental conditions and individual factors. Australian         the lowest socio-
data shows that the burden of disease was 50 per cent              economic group than for
greater for the lowest socio-economic group than for the              the highest socio-
highest socio-economic group (Australian Institute of Health            economic group
and Welfare, 2019).
Further exacerbating disparities in health and wellbeing, the COVID-19 global pandemic has
had a severe impact on health, the economy and how the community lives and works in the
City of Melton. COVID-19 is a highly contagious infectious disease which first emerged in
Australia in January 2020. The Australian and Victorian governments implemented public
health measures (social distancing restrictions) from the 12 March 2020 to limit the spread of
disease. The social distancing restrictions have resulted in a range of multidimensional and
rapid social and economic stressors on the City of Melton. These are highlighted throughout
the report and summarised in the sections titled ‘Social and economic impacts of COVID-19.’
         This symbol denotes where COVID-19 social distancing measures have impacted
        health and wellbeing.
Local government has an important role to play in promoting the health and wellbeing of their
communities. It has significant influence on the built, natural, social and economic
environments in which their residents live. Local government influences health and wellbeing
through the delivery of policy and strategy, services, programs and infrastructure.
The Public Health and Wellbeing Act 2008 (The Act) (Victorian Government, 2008)
mandates local government to protect, improve and promote public health and wellbeing
within the municipal district by taking on a range of responsibilities including:
•   creating an environment which supports the health and wellbeing of members of the
    local community and strengthens the capacity of the community and individuals to
    achieve better health and wellbeing
•   initiating, supporting and managing public health planning processes at the local
    government level
•   developing and implementing public health policies and programs within the municipal
    district
•   facilitating and supporting local agencies whose work has an impact on public health and
    wellbeing to improve public health and wellbeing in the local community.

                                                                                           10
The Act requires that councils prepare a Municipal Public Health and Wellbeing Plan
(MPHWP) every four years, within the 12 months following a Council election. At Melton City
Council (Council), this will be combined with the Council Plan to form the Council and
Wellbeing Plan 2021-25.
2.1 Purpose
This Health and Wellbeing Profile (the Profile) seeks to outline the major health and social
needs within the City of Melton. Through the examination of the wider determinants of
health, the Profile will not only outline health and wellbeing concerns but will promote an
understanding of the broader causes of those conditions and issues. The Profile will inform
the development of the Council and Wellbeing Plan 2021-2025 and be used to inform
residents in deliberative engagement processes for the Melton City 2041 – The City We
Create, the Financial Plan 2021-2031 and Asset Plan 2021-2031.
2.2 Methodology
The following methodology was used to develop the Profile.
• a list of indicators was developed, based upon other health and social needs profiles
undertaken by Council and other municipalities
• the most recent data was gathered for each indicator using a range of online sources
• existing and known reports on relevant issues were reviewed and relevant information
extracted
• data was collated into a data summary document and reviewed by subject matter
experts across Council
• additional data was included under several topics following advice of subject matter
experts
• the final data summary was analysed to identify key issues facing residents
• key health and social issues were summarised, and groups facing health and social
inequities were identified
• subject matter experts were asked to review the Profile and provide feedback
• the Profile was finalised.
2.3 Limitations
There are some limitations to the development of this Profile. Much of the data is based
upon the 2016 Australian Bureau of Statistics (ABS) Census. In a rapidly growing
municipality, data becomes quickly outdated. Some health and wellbeing data is also
relatively old. The most recent Victorian Population Health Survey data is from 2017. The
VicHealth Indicators Survey was last conducted in 2015. This is less likely to impact on
broad results about health conditions and behaviours that are well-established as these do
not often change over such a short period of time. Council’s Household Survey is
undertaken annually and allows a refresh of community sentiment on a range of issues
including food security, safety and community connection. Some data is limited in its scope
and its applicability to the City of Melton context. Each data set also has limitations of its
own.
11The national data presented in this Profile has inherent limitations. For example, the ABS
geographies do not align to Australian Early Development Census (AEDC), hence, AECD
data is presented using peculiar geographical groupings and/or names which effects the
extrapolation of the data for other purposes. Also, new suburbs have been established in the
municipality generally based on Statistical Area Level 2 (SA2), however, some SA2’s overlap
with neighbouring local government areas. As such, this needs to be taken into account
when applying the data from the Profile in different contexts.
This Profile highlights a range of areas where improvements can be made. The next step is
to identify what strengths and opportunities there are within the municipality to make
improvements to identified issues. A partnership approach with community and stakeholders
is vital to harness local strengths and resources to promote better health and social
outcomes.
123. About our City- demographic characteristics
3.1 Growth
The City of Melton is known as one of Australia’s fastest
The City of Melton
growing areas. In 2006, the City of Melton was home to just
population is expected to
under 79,000 residents (id Community, 2020). In 2020, the
grow by a further 160 per
estimated population was 172,500. That equates to 118 per
cent by 2051
cent growth in just 13 years. 50.6 per cent of the population
are female, 49.4 per cent of the population are male.
By 2051, the population is expected to be more than 448,000 representing a further 160 per
cent increase from now (Figure 4) (id Community, 2020).
500,000
448,053
450,000
400,000
365,220
350,000
300,000
264,651
Population
250,000
200,000 185,471
150,000
100,000
50,000
0
2021 2031 2041 2051
Year
Figure 4: City of Melton population projection 2021-2051 (id Community, 2020)
133.2 Age profile
The City of Melton is a relatively ‘young’ community with the median age of 33 years,
compared with 36 years in Greater Melbourne and 37 years across Victoria (id Community,
2020). A population with a relatively young age profile can expect a large number of births
even if most women have few children. This is because of the large number of women of
childbearing age. Conversely, as the population ages, the number of deaths can be
expected to increase because of the relatively large numbers of older people (Australian
Bureau of Statistics, 1996).
25.0
Percentage of population
20.0
15.0
10.0
5.0 2021
2036
0.0
2051
Figure 5: Percentage age composition of the City of Melton in 2021, 2036 and 2051 (id community, 2020)
The City has a higher proportion of children and a lower proportion of people aged 60 years
or older compared with Greater Melbourne. Although the number of people in each age
group is expected to grow significantly to 2051, the age composition of the community is
likely to remain stable with the exception of a reduction in the young workforce group, and an
increase in the seniors and elderly cohorts (Figure 5).
143.3 Household type
Given the young demographic, more than half of households (56.6 per cent) include children
compared with 43.5 per cent of households in Greater Melbourne (Figure 6) (id Community,
2020). Over the next 30 years, the household size is projected to decrease (Figure 7) (id
Community, 2020).
Household type City of Melton and Greater Melbourne, 2016
50.0
40.0
30.0
Percentage
20.0
10.0
0.0
Couples with Couples One parent Other families Group Lone person Other not
children without families household classifiable
children household
Household type
City of Melton% Greater Melbourne %
Figure 6: Household type City of Melton and Greater Melbourne, 2016
Forecast average household size, City of Melton 2021-2051
3.12
Avergae number of persons per
3.1
3.08
3.06
household
3.04
3.02
3
2.98
2.96
Forecast year
2021 2031 2041 2051
Figure:7 Forecast average household size, City of Melton, 2021-2051 (id Community, 2020)
There is a higher rate of single parent households in the City of Melton (13.2 per cent)
compared with Greater Melbourne (10.1 per cent). This varies across the municipality with
Melton South, Melton West, Melton, Kurunjang and Harkness showing a greater proportion
of single parent households compared with other suburbs (Table 1).
15Projected number single Projected number single
Suburb
parent households 2021 parent households 2051
Aintree 239 615
Bonnie Brook --- 724
Brookfield 467 873
Burnside 213 230
Burnside Heights 184 204
Caroline Springs 905 896
Cobblebank - Strathtulloh 152 1,114
Deanside 35 839
Diggers Rest 253 761
Eynesbury Township 92 388
Fieldstone --- 445
Fraser Rise 288 1,277
Grangefield --- 603
Harkness 687 1,110
Hillside 542 629
Kurunjang 531 622
Melton 638 1,043
Melton South (Existing) 798 904
Melton West 516 761
Rockbank 127 572
Taylors Hill 272 251
Thornhill Park 142 852
Truganina - Ravenhall 25 1,448
Weir Views 162 494
Total- City of Melton 7,321 17,714
Table 1- Projected number of single parent households by suburb 2021 and 2051 (id Community, 2020
Single parent households are more likely to earn lower incomes and be dependent on others
to assist with childcare. They are more susceptible to social and economic shocks, such as
COVID-19, particularly when overlaid with under or unemployment and low incomes
(VicHealth, 2020 [a]).
16With more than half of households including children, the average household size is larger in
the City of Melton at 3.02 people compared with 2.61 people in Greater Melbourne. Since
2006, there has been an increase in the proportion of households with six or more people
and the City of Melton surpasses Greater Melbourne in the proportion of larger households
with four or more, and six or more people (id Community, 2020). While there has been an
increase in lone person households since 2006, they make up only 15.3 per cent of
households compared with 22 per cent in Greater Melbourne (id Community, 2020).
3.4 Cultural and religious diversity
The City of Melton is less diverse than many areas in Greater Melbourne although this is
changing as the municipality grows. Thirty per cent of residents were born overseas
compared to 33.8 per cent in Greater Melbourne (id Community, 2020). Of those, 50 per
cent have been in Australia for 20 years or more and are well settled in Australia. Fifteen per
cent of people born overseas arrived in the five years to 2016 (id Community, 2020).
City of Melton residents born overseas by suburb, 2016
Aintree
Brookfield
Burnside - Burnside Heights
Caroline Springs
Cobblebank - Strathtulloh
Diggers Rest
Eynesbury Township
Fraser Rise
Suburb
Harkness
Hillside
Kurunjang
Melton
Melton South
Melton West
Rockbank
Taylors Hill
Toolern Vale
0 5 10 15 20 25 30 35 40 45 50
Percentage of population born overseas
Figure 8: Percentage of residents born overseas by suburb 2016 (id Community, 2020)
17There are more residents born overseas residing in the suburbs of Fraser Rise, Caroline
Springs and Taylors Hill compared to the Greater Melbourne average (Figure 8). The most
common languages spoken at home in the City of Melton are:
Filipino/Tagalog Macedonian
Vietnamese Italian
Punjabi Hindi
Maltese Spanish
Arabic
(id Community, 2020)
Between 2011 and 2016, there was significant growth in the number of people speaking
Punjabi, Filipino, Arabic, Hindi and Vietnamese reflecting increased migration from India,
Vietnam and the Philippines (id Community, 2020). The City of Melton is home to an
increasing number of asylum seekers. In September 2014, there were 10 residents on
Bridging visa E. In June 2020, there were 106, representing a ten-fold increase (City of
Greater Dandenong, 2020).
Unpublished settlement data for Humanitarian, Family and Skilled migrant streams indicated
6,652 settlers are recorded as currently residing in the City of Melton having arrived in
Australia between 2016 and 2021.
Number of migrants arriving 2016-2021
Migration stream
residing in the City of Melton
Humanitarian 1,414
Family 2,036
Skilled 3,201
Total 6,652
Table 2: Number of Humanitarian, Family and Skilled migrants arriving 2016-2021 currently recorded as residing
in the City of Melton (Home Affairs, 2021)
18Country of birth: humanitarian, family and skilled migrants arriving
Total number
2016-2021 residing in the City of Melton
India 1,976
Iraq 892
Vietnam 432
Philippines 423
Pakistan 340
Australia 239
Sri Lanka 135
Peoples Republic of China 115
Myanmar 113
Afghanistan 92
Thailand 75
Ethiopia 70
Syrian Arab Republic 61
Democratic Republic of Congo 61
Malaysia 58
United Kingdom 59
Eritrea 55
Egypt 52
New Zealand 45
Nigeria 36
Tanzania 36
Table 3: Number of Humanitarian, Family and Skilled migrants arriving 2016-2021 currently recorded as residing
in the City of Melton by country of birth (Home Affairs, 2021)
There is greater religious affiliation in the City of Melton (68.9 per cent) compared to Greater
Melbourne (60.2 per cent). There is a greater percentage of Catholic, other Christian, Sikh
and Pentecostal residents than in Greater Melbourne. Between 2001 and 2016, there was
significant growth in the proportion of people following Christian religions (other than
Catholic), Sikhism and Hinduism (id Community, 2020), reflecting the increase in religious
diversity in the community over that time period.
19The impact of COVID-19 on growth is not yet fully understood. People migrating from
overseas account for 35.6 per cent of people moving to the City of Melton (id Community,
2020). This has dropped in 2020 and is likely to stay low for several years. Interstate
migration is also expected to reduce (id Community, 2020). However, there may be
increased migration to the City of Melton from other parts of Melbourne and Victoria due to
affordable housing and the advent of more flexible working arrangements. It is likely that
there will be a reduction in growth in the short to medium term but that this will again
increase over time.
3.5 Key learnings – About our City- demographic characteristics
• The City of Melton has experienced a sustained period of growth. This is expected to
continue for at least the next 30 years, although there will be a downturn in the short and
medium-term due to COVID-19.
• There are larger households in the City of Melton compared to Greater Melbourne, with
more than half of households including children.
• The impact of COVID-19 on growth and diversity is not yet fully understood.
• Growth will increase infrastructure and service needs across all age groups for the
foreseeable future. While the age profile will stay relatively stable, there will be significant
growth in the number of people in all age groups.
204. Social and economic conditions
The social and economic conditions in which people live
have a strong influence on their health and wellbeing. This Differences in health status
section of the Profile describes those who make their home and distribution of
resources are health
in the City of Melton and how they live.
inequities.
The wider determinants of health are estimated to account Those who have poorer
for 40 per cent of all influences on health (The British health outcomes and who
Academy, 2014). There is a well-established social suffer from social and
gradient in health and wellbeing, with those who have the economic inequities should
greatest social and economic status enjoying greater be prioritised.
health than those with social and economic challenges
(Australian Institute of Health and Welfare, 2016).
4.1 Education
In 2018, the four year old kindergarten participation was the same as the Victorian average,
being 92 per cent (Victorian Government, 2020[b]). Since 2006, there has been an increase
in the number of residents completing high school education
The Australian Early Development Census (AEDC) measures the development of children in
Australia in their first year of full-time school. Data collection occurs every three years, with
the most recent in 2018 (Australian Government, 2019). Table 4 illustrates the percentage of
children in the City of Melton developmentally vulnerable across a range of domains
compared to Victoria and Australia.
Table 4: Percentage of children developmentally vulnerable, City of Melton, Victoria and Australia, 2018.
(Australian Government, 2019)
There are some suburbs where children are more developmentally vulnerable on two or
more compared to the local government average (Table 5). Brookfield, Diggers Rest,
Hillside, Kurunjang, Taylors Hill and Melton Rural North East1 (Australian Government,
2019).
1Melton Rural North East is an AECD geography/ area known as Melton Growth Areas as per id Community
geography: Thornhill Park, Deanside, Fraser Rise, Truganina / Ravenhall, Cobblebank-Strathtulloh
21Table 5: Vulnerable on one or more domain(s) and two or more domains Australia, Victoria, City of Melton and
suburb level 2012-2018 (Australian Government, 2019)
A significantly lower proportion of children aged six months to four years are read to by a
family member every day with 54.3 per cent, compared to the Victorian average of 69.6 per
cent (Department of Education and Training (Australian Government), 2016).
In 2016, 50.9 per cent of the population had finished high school compared to 46.5 per cent
in 2006. Figure 9 shows that in 2016, 16 per cent of persons aged 15+ years in the City of
Melton have attained a bachelor degree or higher and 21 per cent have attained a vocational
qualification (id Community, 2020).
Females are more likely than males to:
• have a bachelor or higher degree (18.3 per cent compared to 13.6 per cent).
• have an advanced diploma or diploma (10.4 per cent compared to 7.8 per cent).
• Less likely to have a vocational qualification 15.7 per cent compared to 25.7 per cent of
males.
(id Community, 2020).
22Educational attainment varies across the municipality. Forty-four per cent of residents had
no qualification compared to 38.6 per cent in Greater Melbourne (id Community, 2020).
Aintree, Melton, Melton South, Melton West, Kurunjang and Rockbank reported the greatest
proportion of residents with no qualification.
Highest qualification achieved- City of Melton and Greater
Melbourne, 2016
Percentage of population aged 15+ years
50
45
40
35
30
25
20
15 City of Melton
10 Greater Melbourne
5
0
Advanced Bachelor or No qualification Not stated Vocational
Diploma or Higher degree
Diploma
Qualification type
Figure 9: Highest qualification achieved for persons aged 15+ years- City of Melton and Greater Melbourne 2016
(id Community 2020)
In 2016, 560 people (5.3 per cent) who needed assistance in the City of Melton had a tertiary
qualification, compared to 8.1 per cent in Greater Melbourne. (id Community, 2020). Of
those needing assistance,
• 4.8 per cent had a Diploma or Advanced Diploma compared to 5.4 per cent in Greater
Melbourne.
• 16.2 per cent had Vocational qualifications compared to 12.0 per cent in Greater
Melbourne.
• 67.9 per cent had no qualification compared to 65.1 per cent in Greater Melbourne.
(id Community, 2020).
In 2016, of residents born overseas:
• 24.9 per cent had a Bachelor degree of higher compared to 33.3 per cent in Greater
Melbourne.
• 10.2 per cent had a Diploma or Advanced Diploma compared to 9.9 per cent in Greater
Melbourne.
• 16.3 per cent had Vocational qualifications compared to 11.8 per cent in Greater
Melbourne.
• 43.2 per cent had no qualification compared to 40.3 per cent in Greater Melbourne.
(id Community, 2020).
234.2 Employment
Figure 10 illustrates the largest sectors of employment in the City of Melton:
Largest sectors of employment, City of Melton, 2016
Accommodation and Food Services
Construction
Sectors of employment
Education and Training
Health Care and Social Assistance
Manufacturing
Professional, Scientific and Technical Services
Public Administration and Safety
Retail Trade
Transport, Postal and Warehousing
0 2 4 6 8 10 12
Percentage of employed persons aged 15+ years
Figure 10: Largest sector of employment persons aged 15+ years City of Melton, 2016 (id Community 2020)
• Females are more likely to work in clerical and administrative roles (25.2 per cent
compared to 7.9 per cent), community and personal services (17.5 per cent compared to
5.5 per cent), and in sales (14.8 per cent compared to 7 per cent).
• Males are more likely than females to be technicians and trades workers (23.6 per cent
compared to 4.5 per cent), machinery operators and drivers (17.6 per cent compared to
2.6 per cent), labourers (12.6 per cent compared to 7 per cent) and managers (12 per
cent compared to 8.2 per cent).
(id Community, 2020)
Employment status Female Male
Employed full-time 44.2 per cent 75.2 per cent
Employed part-time 45.8 per cent 18.2 per cent
Table 6- Employment status City of Melton females compared to males aged 15+ years, 2016 (id Community,
2020)
Of residents born overseas, 60.7 per cent were employed full-time compared to 63.9 per
cent in Greater Melbourne. There were more overseas born residents working part-time in
the City of Melton, 28.8 per cent compared to 26.9 per cent in Greater Melbourne. (id
Community, 2020).
24In 2016, 553 people who needed assistance in the City of Melton were employed. Of which
32.3 per cent were working full-time, compared to 28.4 per cent in Greater Melbourne and
48.5 per cent working part time compared to 53.0 per cent in Greater Melbourne (id
Community, 2020).
Management and professional roles are some of the highest paying roles available
(Australian Bureau of Statistics, 2018[a]). There is a difference between the percentage of
people employed as managers or professionals in suburbs such as Eynesbury, Caroline
Springs and Fraser Rise. Residents of Rockbank, Melton South, Melton, Kurunjang, are less
likely to be employed in these roles (Figure 11). Rural balance2 comprises the non-urban
parts of the City of Melton.
Percentage of persons aged 15+ years employed as
professionals and managers by suburb, 2016
Aintree
Brookfield
Burnside - Burnside Heights
Caroline Springs
Cobblebank - Strathtulloh
Diggers Rest
Eynesbury Township
Fraser Rise
Suburb
Harkness
Hillside
Kurunjang
Melton
Melton South
Melton West
Rockbank
Rural Balance
Taylors Hill
Toolern Vale
0 5 10 15 20 25 30 35 40
Percentage of employed persons aged 15+ years
Figure 11: Percentage of residents aged 15+ years employed as managers or professionals by suburb, 2016 (id
Community, 2020)
2 Rural Balance is bounded by Holden Road in the north, the railway line, the suburb of Hillside, Melton Highway, Plumpton Road, Taylors Road,
Monaghans Lane, Clarke Road, Western Highway and Robinsons Road in the east, Boundary Road, the Werribee River, the urban part of the
locality of Eynesbury, St Arnaud Road, Greenhill Road and Springhill Road in the south, and Bucklers Road, Nortons Road, Moorabool Shire, the
Werribee River, the railway line, Rees Road, a line running west to east between Rees Road and Toolern Creek, the Toolern Creek, Greigs Road
West, Mount Cottrell Road, the Melton Highway and the Kororoit Creek in the west. Rural Balance excludes the localities of Aintree and
Rockbank, which are located in the centre of the area.
254.3 Unemployment
In June 2020, the City of Melton had the fourth highest rate of unemployment in Victoria at
8.8 per cent, compared to 6.3 per cent in Greater Melbourne. (Australian Government,
2020). Figure 12 shows Melton South, Melton, Kurunjang and Rockbank had higher
unemployment rates than other suburbs within the municipality. (id Community, 2020). There
is a higher rate of disengagement from work and education in 15-24 year old’s in the City of
Melton (10.9 per cent) compared with Greater Melbourne (7.5 per cent) (id Community,
2020).
Ten per cent of City of Melton residents were in receipt of Job Seeker or Youth Allowance
payments in December 2020, compared with 8.8 per cent in Greater Melbourne (id
Community, 2020). The economic impacts of COVID-19 public health restrictions has
resulted in widespread unemployment across the municipality, including in areas that
previously experienced low unemployment. Figure 13 shows the increase in recipients of
Youth Allowance and/or Job Seeker by SA23 between March 2020 prior to COVID-19-
related restrictions being introduced and October 2020. Sharp increases in unemployment
occurred in suburbs such as Rockbank, Fraser Rise, Hillside and Taylors Hill. Suburbs
already vulnerable to unemployment, such as Melton, Melton South and Melton West, were
further impacted.
Unemployment rate by suburb, 2016
Aintree
Brookfield
Burnside - Burnside Heights
Caroline Springs
Cobblebank - Strathtulloh
Diggers Rest
Eynesbury Township
Fraser Rise
Suburb
Harkness
Hillside
Kurunjang
Melton
Melton South
Melton West
Rockbank
Taylors Hill
Toolern Vale
0.00 2.00 4.00 6.00 8.00 10.00 12.00 14.00 16.00
Unemployment rate
Figure 12: Unemployment rate by suburb, 2016 (id Community, 2020)
3Statistical Areas Level 2 (SA2) are medium-sized general purpose areas built up from whole Statistical Areas Level 1. Their
purpose is to represent a community that interacts together socially and economically.
26Figure 13: Change in percentage of working-age residents accessing JobSeeker or Youth Allowance March 2020
to October 2020 by SA2 (id Community 2020)
4.4 Income
City of Melton residents are over-represented in lower income
brackets and under-represented in higher income brackets There is substantial
when compared with Greater Melbourne. Melton, Melton variation in income
South and Rockbank have a higher percentage of across the municipality
households in the lowest income quartile (Figure 14). with a striking difference
between the eastern part
• Females are much more likely than males to be in the of the municipality and
lowest individual income quartile (32.2 per cent the area in and around
compared to 21 per cent). the Melton township
• Males are twice as likely to be in the highest individual
income quartile as females (32.3 per cent compared
to 14 per cent).
(id Community, 2020)
27Figure 14: Percentage of residents in lowest income quartile by suburb 2016 (id Community, 2020)
Of residents born overseas 15.1 per cent lowest household income quartile compared to
20.4 per cent in Greater Melbourne (id Community, 2020).
Of residents needing assistance 28.5 per cent in the lowest household income quartile
compared to 35 per cent in Greater Melbourne (id Community, 2020)
4.5 SEIFA Index of relative disadvantage
The socio-economic index for areas of disadvantage (SEIFA)
The City of Melton index of relative disadvantage ranks geographic areas across
includes some of the Australia by level of socio-economic disadvantage. The SEIFA
most disadvantaged combines measures that indicate disadvantage, such as low
suburbs in Australia and educational attainment and low income, to estimate the level of
some of the least disadvantage experienced in an area. The City of Melton SEIFA
disadvantaged suburbs, was 994 in 2016, which is low compared with the Victorian
sometimes only a few average of 1010. As with a range of social indicators already
kilometres from one discussed, the SEIFA varies significantly across the
another municipality. When the SEIFA score is viewed as percentiles,
this disparity becomes clearer. Melton South (sixth percentile),
Rockbank (seventh percentile) and Melton (seventh percentile)
is depicted in Figure 15.
28This means that 93-94 per cent of suburbs in Australia experience less disadvantage than
these three suburbs. Eynesbury, Fraser Rise, Hillside, Taylors Hill, Caroline Springs, Toolern
Vale and Cobblebank- Strathtulloh all experience less disadvantage than the average score
for Greater Melbourne.
Figure 15: SEIFA Relative Index of Disadvantage Score percentile by suburb 2016 (id Community, 2020)
4.6 Perceptions of safety
In 2015, the VicHealth Community Indicators Survey found 87 per cent of City of Melton
residents agreed that they felt safe walking alone during the day, compared to the Victorian
estimate of 93 per cent. Forty-two per cent of residents agreed that they felt safe walking
alone in their local area after dark, which is much less than the Victorian estimate of 55.1 per
cent (VicHealth, 2016 [a]).
Men were twice as likely to feel safe walking alone at night
Men are twice as likely compared with women (25.1 per cent compared to 59.4 per
as women to feel safe cent). A similar pattern exists in the western metropolitan
walking alone after dark region of Melbourne although a greater proportion of men (67.7
in the City of Melton per cent) and women (35.8 per cent) feel safe walking alone at
night (VicHealth, 2016 [a]).
29Data from Council’s Community Satisfaction Survey shows perceptions of safety ratings4 are
increasing over time (Table 7) (Metropolis Research, 2020).
Community Satisfaction 2020 2019 2018 2017
Survey- Perceptions of safety
In public areas during the day 7.81 7.90 7.43 7.61
In public areas during the night 7.57 6.18 5.64 5.33
Table 7- Perceptions of safety in public areas during the day and night, Community Satisfaction Survey results,
2017-2020 (Metropolis Research, 2020).
4.7 Crime
The overall crime rate has been relatively stable since 2012 and is consistently lower than
the Victorian crime rate (Figure 16). In the year ending March 2020, there were 9,323
criminal incidents in the City of Melton. This increased by 6.2 per cent in the year ending
March 2021 to 9,902 incidents (Crime Statistics Agency, 2021).
There has been a small increase in crimes against the person since 2015, particularly
robberies and dangerous and negligent acts (Crime Statistics Agency, 2020 [c]). Property
and deception offences have varied but there has been a significant reduction in
burglary/break and enter offences since 2016. Drug offences have stayed relatively stable
while breaches of court order offences have more than doubled since 2015.
Figure 16: Crime rate per 100,000 population- City of Melton and Victoria 2011-2020 (Crime Statistics Agency,
2021)
4*Metropolis Research categorises satisfaction results as follows:
⊗ Excellent - scores of 7.75 and above- excellent ⊗ Very good - scores of 7.25 to less than 7.75 - very good
⊗ Good - scores of 6.5 to less than 7.25 - good ⊗ Solid - scores of 6 to less than 6.5- solid
⊗ Poor - scores of 5.5 to less than 6 -poor ⊗ Very Poor - scores of 5 to less than 5.5 -very poor
⊗ Extremely Poor – scores less than 5 -extremely poor
30Figure 17: Top five suburbs of offences, 2021 (Crime Statistics Agency, 2021)
Melton South, Melton and Melton West experienced the highest number of criminal incidents
in the year ending March 2021, followed by Rockbank and Caroline Springs (Figure 17).
Residents under the age of 45 years accounted for 71 per cent of victim reports in 2019-
2020 and this has been a broadly consistent pattern since 2016. With a similar pattern in
previous years, females, males and organisations each accounted for approximately a third
of all victim reports (Crime Statistics Agency, 2019 [c]). Despite an even representation
between males and females as victims, males are far more likely to be offenders than
females. In 2019-20, 80-per cent of offenders were males (Crime Statistics Agency, 2020
[c]).
4.8 Family violence
There were 2,870 were family incidents5 equating to 30
per cent of all criminal incidents in the municipality. The City of Melton has the third
Women are much more likely to be the victim- highest rate of family violence in
survivors of family violence. Children are also heavily Greater Melbourne. Family
affected. In 29 per cent of cases, a child witnessed or violence incidents account for 30
was otherwise affected by family violence incidents in per cent of local crime
Victoria (Crime Statistics Agency, 2020 [a]).
Females were the victims in 77 per cent of incidents and males were the perpetrators in 78
per cent of incidents (Crime Statistics Agency, 2020 [c]). The rate of family violence in the
City of Melton has been increasing since 2018 and is higher than the Victorian rate (Figure
18) (Crime Statistics Agency, 2021).
The impacts of family violence can be serious and long-lasting, affecting an individual’s
health, wellbeing, education, relationships and housing outcomes (AIHW, 2020). Six
diseases have been causally linked to exposure to family violence including, depressive
disorders, anxiety disorders, alcohol use disorders, early pregnancy loss, homicide, suicide
and self-inflicted injuries (Australian Institute of Health and Welfare, 2020[b]).
5An incident reported by Victoria Police where a Risk Assessment and Risk Management Report (L17 form) was
completed. The report is completed when family violence incidents, interfamilial-related sexual offences, and
child abuse are reported to police.
31Figure 18: Family violence incidents rate per 100,000 population City of Melton and Victorian 2017-2021 (Crime
Statistics Agency, 2021).
There are some community cohorts that are disproportionately impacted by family violence
including:
• Aboriginal and/or Torres Strait Islander people – higher risk of experiencing family
violence, higher level of under-reporting, more likely to be hospitalised due to family
violence incidents and difficulties accessing culturally-sensitive support
• culturally and linguistically diverse groups – higher level of under-reporting and
challenges accessing support
• people with disabilities – significantly higher risk of experiencing family violence and
challenges accessing support
• people living in rural, regional and remote areas – higher risk of experiencing family
violence, concerns about confidentiality and challenges accessing support
• older people – may be at increased risk of family violence due to their reliance on others
for financial or care reasons; or alternatively at risk from adult children who continue to
live in the family home for financial or other reasons.
(KPMG, 2017)
In Australia, over one third of women with disabilities experience some form of intimate
partner violence – compared to one fourth of women without a disability. Women with
disability report experiencing
• Physical violence 48 per cent - compared to 28 per cent without disability
• Sexual violence 33 per cent - compared to 16 per cent without disability
• Stalking or harassment 27 per cent - compared to 16 per cent without disability
(Australian Bureau of Statistics, 2016[a])
32You can also read