High-speed Rail and Industrial Developments: Evidence from House Prices and City-Level GDP in China
←
→
Page content transcription
If your browser does not render page correctly, please read the page content below
High-speed Rail and Industrial Developments: Evidence from House Prices
 and City-Level GDP in China

 Zhengyi ZHOU*
 (School of Finance, Shanghai University of Finance and Economics)
 Anming ZHANG**
 (Sauder School of Business, University of British Columbia)

 This version: 28 April 2021

Abstract With unique datasets, this paper studies the distributional impact of high-speed rail
(HSR) on industrial developments by examining the house price premium of industrial parks
in two important core-periphery city pairs of China: Shanghai-Suzhou and Beijing-Langfang.
We find that in core cities, the premium of service industrial parks (SIPs) has grown faster near
HSR stations, while that of manufacturing industrial parks (MIPs) has grown slower near HSR
stations. In periphery cities, however, the premium of SIPs has grown slower near HSR stations.
Moreover, the premium of MIPs has grown faster near HSR stations of Suzhou. The results
suggest that HSR facilitates a “spillover effect” between the core and peripheries for the
manufacturing industry, but a “siphon effect” for the service industry. City-level GDP analysis
for the two industries delivers consistent results. Our findings shed light on the underlying
reason for the spatial variation in the economic impacts of HSR.

Keywords: House price; High-speed rail; Industrial parks; Manufacturing industry; Service
industry; China
JEL: R12 R42 O14 P25

* Corresponding author: Zhengyi Zhou, School of Finance, Shanghai University of Finance and
Economics, 100 Wudong Road, Yangpu District, Shanghai, China, 200433. Email:
zhou.zhengyi@mail.sufe.edu.cn. Tel: 86 021 65908193.
** Anming Zhang, Sauder School of Business, University of British Columbia, Vancouver, Canada,
BC V6T 1Z2. Email: anming.zhang@sauder.ubc.ca.

 1
1. Introduction
 Transportation costs play an important role in the location, agglomeration, and evolution
of economic activities (Lin, 2017). Since the opening of the first high-speed rail (HSR) system
in Japan in 1964, HSR has developed in several countries (Li and Rong, 2020), and China has
demonstrated the world’s fastest and most extensive adoption of HSR since 2007. The scale
and scope of the HSR network in China is qualitatively different from other nations’
experiences, and can be expected to create different effects on urban developments than the
Japanese and European HSR deployments that preceded it (Wu et al., 2016). According to
National Bureau of Statistics of China, the total length of HSR lines reached 29,904 kilometers
(km) by 2018, with an annual passenger volume of more than 2 billion. By July 2019, 250
prefecture-level or higher level cities had HSR service. By reducing travel time, HSR is
expected to substantially improve the efficiency of economic activities. However, while there
is evidence that HSR brings aggregate benefits (e.g., Hu et al., 2020), our knowledge about the
distributional impact of HSR on economic activities is quite limited (Zhang et al., 2019). In
this paper, we study the distributional effect of HSR on regional industrial developments.
 The distributional impact of HSR can be complicated. Among the cities with HSR services,
the disparity between large and small cities may increase or decrease, depending on the relative
strength of the “spillover effect” and the “siphon effect” (Zhang et al., 2019). The spillover
effect is also known as “agglomeration spillover” in the literature of New Economic Geography.
It describes the situation in which reduced transportation cost alleviates the over-agglomeration
in urban centers by pulling firms and workers into less congested places. The siphon effect is
also known as “agglomeration shadow”, which describes the situation in which reduced
transport costs enables one region to attract firms and workers away from another region
(Lenaerts et al., 2021). 1 When HSR is introduced to a small city, it brings both improved
market access and increased market competition, so both effects are possible. Whether the
spillover effect or the siphon effect dominates depends on the relative importance of increased
market access and increased market competition, which may be different from one industry to
another. Therefore, whether a small city would flourish or decline after being connected to the
HSR network may also depend on the industry structure of the region.
 We conduct this study by focusing on two typical core-periphery pairs in China: Shanghai-
Suzhou and Beijing-Langfang. Suzhou is located 85 km northwest of Shanghai. In 2018, it had
a gross domestic product (GDP) of 1,860 billion yuan (vs. Shanghai's 3,601 billion yuan) and
a population of 10.7 million (vs. Shanghai's 24.2 million). Langfang is located 48 km southeast
of Beijing. In 2018, it had a GDP of 303 billion yuan (vs. Beijing's 3,311 billion yuan) and a
population of 4.8 million (vs. Beijing's 21.5 million). 2 In the HSR era, we have observed

1 The spillover effect and the siphon effect are related to, but not the same as, the spread-backwash concepts of
Mydral (1957). The spread effect refers to the positive effect of more developed region’s “purchases and
investments” on the less developed region. The backwash effect refers to the negative effect on the less developed
region, which is caused by superior urban competition. Hence, the spread effect and the backwash effect are not
explicitly related to transportation cost. It is unclear whether HSR would enhance or weaken the spread effect and
the backwash effect. In contrast, the spillover effect and the siphon effect, as defined above, are directly related to
transportation cost. Reduced transportation cost is a prerequisite for them to take place.
2 In terms of U.S. dollar, Shanghai’s GDP in 2018 was $509 billion, whereas Beijing’s was $468 billion. The

 2
different development patterns in the two pairs. As shown in Figure 1, for the Beijing-
Langfang pair, the per-capita GDP of the core (Beijing) has grown faster than that of the
periphery (Langfang) since the introduction of HSR in 2007. For the Shanghai-Suzhou pair, in
contrast, the per-capita GDP of the periphery (Suzhou) has grown faster than that of the core
(Shanghai). It seems that for the Shanghai-Suzhou pair, the periphery benefits more from HSR,
whilst for the Beijing-Langfang pair, the core benefits more. For policy makers and researchers,
it is important to understand the channels through which HSR affects regional disparity. We
investigate this issue by emphasizing the different impact of HSR on the manufacturing
industry versus the service industry. Given the significant difference in industrial structure
across regions, our work will shed light on the underlying reason behind the spatial difference
in the economic impact of HSR.

 200,000 200,000

 150,000 150,000

 100,000 100,000

 50,000 50,000

 0 0
 2001 2004 2007 2010 2013 2016 2019 2001 2004 2007 2010 2013 2016 2019

 Beijing Langfang Shanghai Suzhou

 Figure 1 Per-capita GDP of two core-periphery pairs
Note. The left panel shows the per-capita GDP (yuan) of Beijing and Langfang. The right panel shows the per-
capita GDP of Shanghai and Suzhou.

 We use house prices as our research tool. If the manufacturing industry is expected to
benefit from HSR and create many jobs, the house prices around manufacturing industrial parks
(MIPs) should increase after the city’s connection to HSR. Similarly, if the service industry is
expected to benefit from HSR, the house prices around service industrial parks (SIPs) should
increase. In a study on the impact of industrial parks on the local economy, Zheng et al. (2017)
propose that house prices will be higher in the vicinity of industrial parks, given that
commuting is costly and workers in the parks earn higher wages. This helps justify the
effectiveness of house prices as a research tool in our study.
 This research is conducted in several steps. First, we test how the growth of the house price
premium of industrial parks varies with the distance to HSR stations. Intuitively, industrial
parks that are closer to HSR stations are more influenced by HSR. Here we separately consider
MIPs and SIPs, which would reveal the difference in the impact of HSR on the manufacturing
industry versus the service industry. By comparing the patterns in core cities and periphery
cities, we would know whether a siphon effect or spillover effect dominates. Second, we

exchange rate used here (and in this paper) is 7.0743, which is the average exchange rate between the Chinese
currency and the U.S. currency during the period January 2002 - December 2019, according to People’s Bank of
China.

 3
conduct a city-level GDP analysis to confirm our micro-level findings. Finally, we examine
whether the industrial parks that are supposed to flourish (decline, respectively) according to
our house price analysis have witnessed increased (decreased, respectively) employment. Here
we refer to the riding records of shared bikes. If an industrial park witnesses increased
employment, we should observe an increasing number of riders arriving there during morning
rush hours.
 We have the following findings. In core cities, the house price premium of SIPs located
near HSR stations has grown faster than that of SIPs farther away. This indicates that the service
industry in core cities has benefited from HSR. In contrast, the house price premium of MIPs
located near HSR stations has grown slower than that of MIPs farther away. This suggests that
HSR hurts the manufacturing industry in core cities. Evidence based on shared bike riding
records also shows consistent results. When we look at periphery cities, however, things are
different. The house price premium of MIPs located near HSR stations has grown faster than
those farther away, given that the nearby core city has a strong manufacturing industry.
Meanwhile, the house price premium of SIPs near HSR stations has grown slower than that of
SIPs farther away. This suggests that HSR benefits the manufacturing industry in periphery
cities, while hurting their service industry. Taken together, we conclude that HSR leads to a
spillover effect between the core and peripheries for the manufacturing industry, but a siphon
effect for the service industry. At the aggregate level, we find evidence that supports our major
conclusions based on the micro-level analysis.
 The contribution of this paper lies in several aspects. First, we shed light on the underlying
reason for the spatial variation in the economic impact of HSR. A direct implication of our
finding is that local industry structures should be taken into account in the financing of HSR.
Currently, a large proportion of the HSR construction cost is borne by municipalities along
HSR lines. According to our results, if a periphery city has a core city with a very strong service
industry but a weak manufacturing industry, then the periphery city would likely suffer from
the siphon effect after the introduction of HSR. In this case, it should contribute a smaller part
in the financing of HSR. Second, this is, to our best knowledge, the first paper that uses house
transaction data to identify the distributional effect of HSR. Other studies in this field usually
use aggregate-level data, and a major challenge for them is the endogeneity problem. For
example, it is hard to tackle whether HSR affects a local economy, or the site choice of HSR
stations simply reflects people’s expectations for the future condition of a local economy. We
are less subject to this problem, because it is unlikely that policy makers consider house price
premiums of MIPs and SIPs when they make the site choice of HSR stations. Third, we
contribute to the literature on the impacts of HSR on the price of houses, the most important
assets for the majority of households (Zhou, 2016). The impact of HSR on housing assets is
actually a redistribution of household wealth. By exploiting transaction-level datasets, we offer
the most recent evidence from an emerging economy.
 The rest of the paper is arranged as follows. Section 2 reviews the literature. Section 3
develops our hypotheses. Section 4 introduces the institutional background and describes our
data. Section 5 displays our empirical results. Section 6 conducts additional tests and robustness
check. Section 7 concludes.

 4
2. Literature review
 This paper is related to several streams of literature. First, it is related to the rapidly
growing literature on the economic effects of HSR. Many studies have found positive effects.
For example, Nakagawa and Hatoko (2007) commented that Japan's high-speed railway lines
have been a great success. Zheng and Kahn (2013) found, suing housing prices, that China’s
bullet (HSR) trains benefit second-tier and third-tier cities by facilitating market integration.
With evidence from the Yangtze River Delta of China, Wang et al. (2019a) found that HSR
promotes the upgrading of industrial structure. Gao and Zheng (2020) showed that HSR
connection promotes firm innovation in peripheral areas of China. Zhang et al. (2020) showed
that HSR stimulates corporate innovation by facilitating information flows and improving
monitoring capabilities. Cascetta et al. (2020) found that HSR in Italy has contributed to an
extra growth of per capita GDP of 2.6%. However, there are also studies with different views.
For instance, Albalate and Fageda (2016) highlighted the disappointing ex-post impact
evaluations of HSR in Spain. Li et al. (2021) proposed that HSR facilitated the spread of
COVID-19 in China. Unlike these studies, we highlight the distributional economic impact of
HSR rather than the general effects.
 Furthermore, there are studies that highlight the spatial variation in the economic impact
of HSR. Qin (2017) indicated that HSR in China has led to a significant economic slowdown
in peripheral counties that are uncovered by HSR services. Li and Xu (2018) found that because
of HSR, municipalities within approximately 150 km of Tokyo expand, while the distant ones
contract. Yu et al. (2019) found that the HSR connection in China has led to a reduction in per
capita GDP for connected peripheral prefectures. Wang et al. (2019b) pointed out that firms in
peripheral cities with HSR connections are facing increased competition in the product market
and the credit market. More recently, Duan et al. (2020) found that HSR alleviates the
development imbalance within wealthier cities while widening the gap between wealthier cities
and poorer cities. Hu et al. (2020) documented that the HSR network in China displaces the
employment of skill-intensive sectors from periphery to core, and promotes the employment
creation of labor-intensive sectors in the periphery. Shi et al. (2020) found that the spatial
spillover effects of HSR in China are significant and positive only in the eastern/northeastern
region. Liu et al. (2020) highlighted that although the difference between megalopolises has
reduced, small/medium-sized cities not belonging to any major city cluster are further lagged
behind in HSR development. We are different from these studies in that we shed light on the
underlying reason for the spatial variation in the HSR effects by emphasizing the difference
between the manufacturing industry and the service industry.
 Several studies have addressed the industrial difference in the HSR impacts from a labor
market perspective. For example, after the opening of HSR in Japan, noncore areas witnessed
a decline of 7 percent in service employment, while manufacturing employment increased by
21 percent (Li and Xu, 2018). Lin (2017) found that industries with a higher reliance on non-
routine cognitive skills benefit more from HSR-induced market access to other cities. Unlike
them, we take a housing market perspective. While changes in employment reflect the
instantaneous impact of HSR on a local economy, house prices reflect people’s expectations

 5
for the future. The history of HSR in China is shorter than in developed countries (such as
Japan and European countries). House prices enable us to capture people’s expectations for the
economic impacts of HSR, even if the impacts have not yet occurred.
 When investigating the economic impacts of HSR, many studies provide aggregate-level
evidence. A challenge for aggregate-level analysis is the endogeneity problem. For example, it
is hard to judge whether HSR affects a local economy, or the site choice of HSR stations is
based on people’s expectations for the future condition of a local economy. To resolve this
problem, most studies use instrument variables (IVs) such as hypothetical least-cost path-
spanning tree networks (Yu et al., 2019), straight line (Gao and Zheng, 2020), historical railroad
network, or spatial distribution of major military troop deployments in 2005 (Zheng and Kahn,
2013). We are less subject to the endogeneity problem. It is unlikely, in our view, that the site
choices of HSR stations depend on policy makers’ expectations for the house price premiums
of MIPs and SIPs.
 Second, the present paper is related to studies about the impact of transportation
infrastructure on house prices. Armstrong and Rodriguez (2006), Brandt and Maennig (2012),
Grimes and Young (2013), Zhou et al. (2021), and He (2020) studied the impact of commuter
rail and the public transit system on house prices. Unlike them, we study the impact of HSR,
which is inter-city rather than intra-city. Compared with intra-city transportation infrastructure,
the mechanism through which inter-city transportation infrastructure affects residents’ utility
and house prices is less straightforward, because most people in China do not live and work in
different cities. However, HSR may directly affect the business opportunities of industrial parks,
which then affect house prices nearby. Considering the large number of industrial parks, the
number of households with their housing assets indirectly affected by HSR is potentially large.

3. Hypothesis development
 When a periphery city is connected to its core city by HSR, it faces both increased market
access and increased market competition from the core city. The relative importance of the two
things is likely different between the manufacturing industry and the service industry.
 First, consider the manufacturing industry. Because of economies of scale, the production
of each manufactured good would take place at only a limited number of sites. Other things
equal, the preferred sites for manufacturing firms are those with relatively large local demand
(Krugman, 1991). With a large non-rural population, core cities usually have large demand for
manufactured goods. However, as industrialization proceeds, land prices and house prices of
core cities grow together with the city size (Combes et al., 2019). High housing cost raises the
cost of low-skilled laborers. These factors lead to high pressure in production cost for the
traditional manufacturing industry, which is intensive in land and low-skilled labor. When this
happens, the low costs of land and labor in periphery cities become attractive. In the past, one
obstacle for manufacturing firms to locate in a periphery city is the inconvenient access to the
large demand in the core city. But now, HSR solves this problem. With HSR, sales teams from
a periphery city can easily access their potential customers in the core city. It is also feasible
for a firm to keep the headquarters in the core city, while locating the plants at periphery cities,
because HSR enables the management to easily supervise plants in periphery cities (Zhang et

 6
al., 2020). Giroud (2013) found that new airline routes that reduce the travel time between
headquarters and plants lead to an increase in plant-level investment of 8% to 9%. Therefore,
we expect that HSR facilitates the spillover of the manufacturing industry from a core city to
its periphery cities. To the extent that the impact of HSR should be larger in areas near HSR
stations, we have the following testable hypothesis:
 H1a: In periphery cities, the house price premium of MIPs located in areas near HSR
stations has grown faster than that of MIPs farther away.
 As the periphery city becomes more attractive as a site choice for manufacturing firms, the
manufacturing industry of the core city would grow slower. The reduction in the growth should
be more evident in the areas near HSR stations, because these locations are more homogeneous
to the counterparts in periphery cities. Locations far from HSR stations may have some unique
features and are less substitutable. Hence, we have another testable hypothesis:
 H1b: In core cities, the house price premium of MIPs located in areas near HSR stations
has grown slower than the premium of MIPs farther away.
 Second, consider the service industry. Relative to the manufacturing industry, the service
industry is more skill intensive and knowledge intensive. In the literature, it has been well
documented that urban agglomeration facilitates the learning of skilled individuals (Francis et
al., 2016; Davis and Dingel, 2019), that skill-sharing is a critical salient motive behind the
location choices of services (Diodato et al., 2018), and that high-skilled laborers gain more
from the urban scale than low-skilled laborers (Torfs and Zhao, 2015). Then, in terms of the
service industry, a core city has a comparative advantage over its periphery cities. In the pre-
HSR era, the service markets in different cities were segmented, because service is non-tradable
when passenger transportation cost is high. By facilitating consumer mobility, HSR exposes
service firms in periphery cities to the competition from the core city. For example, HSR makes
it easier for a patient in Langfang to see the doctor in Beijing, and for an investment banker in
Shanghai to serve a client in Suzhou. In short, HSR potentially leads to a siphon effect that
attracts service industry resources away from periphery cities to core cities. To the extent that
the effect is reflected on the house price premium of SIPs located near HSR stations, we have
the following testable hypotheses:
 H2a: In periphery cities, the house price premium of SIPs located in areas near HSR
stations has grown slower than the premium of SIPs farther away.
 H2b: In core cities, the house price premium of SIPs located in areas near HSR stations
has grown faster than the premium of SIPs farther away.

4. Institutional background and data description
 We first document the development of HSR in China. Then we describe our data.

4.1. Railway network and HSR in China
 In the past two decades, China has invested heavily in its railway network (Li et al., 2019a).
During the period 2002-2019, the total investment in the fixed assets of the railway network
was 9.56 trillion yuan, or about 1.35 trillion U.S. dollars. The annual investment was 1.09% of
China’s GDP. In 2018, the total length of the railway network reached 131,700 km, serving

 7
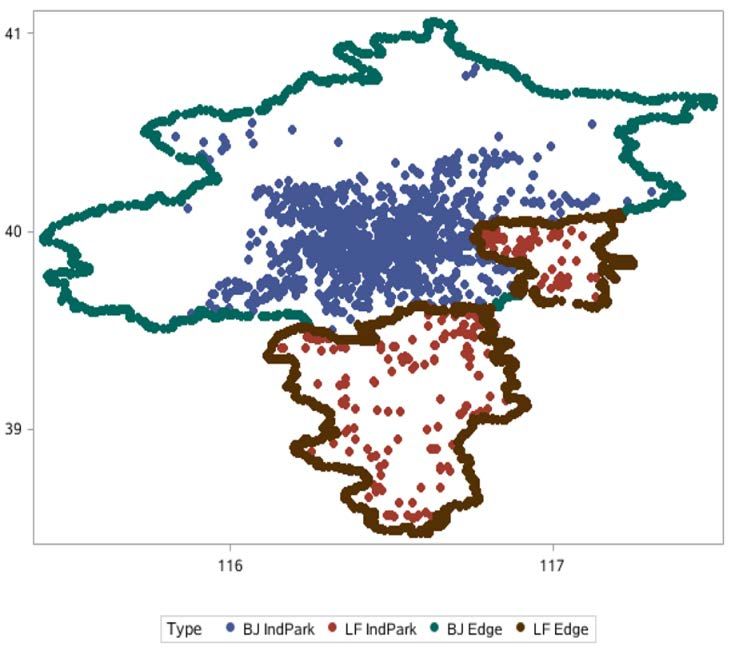
more than 3.37 billion passengers in that single year.

 Figure 2 Locations of HSR stations in mainland China
Note. We obtain the names of HSR stations from the timetable in July 2019. With these names, we find their
locations from Baidu Map, a Chinese counterpart of Google Maps.

 Starting in 2007, China has introduced new bullet trains connecting megacities (Zheng and
Kahn, 2013). These trains can reach 200–250 km per hour. In 2008, more advanced trains were
put into use. They can reach 350 km per hour. In the same year, the State Council in its revised
Mid-to-Long Term Railway Development Plan set the goal of a national HSR grid composed
of four north-south corridors and four east-west corridors, with a budget of around 4 trillion
yuan (Lin, 2017). From 2008 to 2018, the total length of the HSR network increased from 671.5
km to 29,904 km, and the annual volume of passengers increased from 7.34 million to 2.05
billion. Between 2010 and 2019, the length of newly-invested HSR lines was 54% of the total
length of newly-invested rail lines. As can be seen from Figure 2, the HSR network covered
most parts of the country by 2019. The network has grown beyond an exclusive corridor or a
hybrid network of inter-connected corridors, becoming a mainstay of the nation’s domestic
transportation network (Perl and Goetz, 2015; Wu et al., 2016; Bracaglia et al., 2020). 3

4.2. Data description
 Our datasets encompass the train timetable, house transactions, and point of interests
(POIs).

4.2.1. Train timetable
 The train timetable can be searched at the official website of “12306 China Railway.” We
have the timetable from 2014 to 2019. 4 An observation consists of the following variables:

3
 The numbers in this sub-section are from National Bureau of Statistics (NBS) and Nation Railway
Administration (NRA).
4 In 2014, the timetable was collected in June. During the period 2015-2017 and the year 2019, it was collected

in each month of July. In 2018, it was collected in October. The HSR timetable is available at:
https://www.12306.cn/index/

 8
Train ID, the name of a station where the train stops, time of arrival at the station, time of
departure at the station. Hence, a train with n stops leads to n observations; the first departure
station is also counted as a stop. The timetable of 2019 includes 112,902 observations, which
correspond to 10,367 trains.
 HSR trains are defined as trains with an identification initial of “G” (i.e., “Gao Tie” in
Chinese) or “D” (i.e., “Dong Che” in Chinese) or “C” (i.e., “Cheng Tie”). In 2019, a total of
993 stations in 250 cities had HSR service. The mean and median of the number of HSR trains
that stop in a city is 265 and 170 per day, respectively; a train is counted n times if it stops at n
stations in the city.

4.2.2. House transaction data
 Our micro-level analysis uses the house transaction data of four cities: Beijing, Langfang,
Shanghai, and Suzhou. The data source is Lianjia, which is the largest real estate brokerage in
China, holding more than 50% of market share in Beijing (Li et al., 2019b). 5
 Table 1 shows the summary statistics of our sample houses, which are mostly apartments.
The definitions of house characteristics are summarized below the table and also in Appendix
C. The distance to the city center (DCenter) and the distance to the nearest subway station
(DSubway) are calculated by us; other characteristics are directly from the house transaction
datasets. 6 As can be seen from the table, the house prices in Shanghai and Beijing are higher
than those in Suzhou and Langfang. This is consistent with the fact that Shanghai and Beijing
are core cities, while Suzhou and Langfang are periphery cities. A large proportion of
transactions in Langfang are located near the boundary between Langfang and Beijing, and this
is why the average DCenter of Langfang is as long as 46 km.
 The sample period starts in 2011 for the two core cities and in 2014 for the two periphery
cities. For data availability reasons, the sample period does not cover the pre-HSR era. However,
our sample period can still catch a significant proportion of the HSR effects. First, the
development of the HSR network is a gradual process. The passenger volume of HSR in 2010
was only 6% of the volume in 2018. During the last decade, the HSR effects have been greatly
intensified by the expansion of the HSR network and increase in service frequency. Second, it
takes time for the house price effects of HSR to become observable. It is true that house prices
would respond when the construction plan of an infrastructure is announced, or when it is first
put into use (e.g. Yen et al., 2018). However, the response is incomplete. According to the
theory of Hong and Stein (2002), if information diffuses gradually and trading cost is high,
then asset prices underreact in the short run. Housing market features slow information
diffusion and high transaction cost. Consistent with this theory, Billings (2011) find that the
house price effects of a transit line announced in 2000 were not present until 2003-2008. For
the same reason, we may still observe the impact of HSR on house price growth even several

5
 The coverage of Lianjia in Shanghai is also large. In 2019, 134,962 houses were transacted in the (primary or
secondary) housing market of Shanghai, according to Shanghai Real Estate Administration Bureau. For this year,
our sample includes 39,499 observations, which translates into a market share of 29%. If we only consider the
secondary market, the market share of Lianjia is even larger.
6
 For Beijing, Langfang, Shanghai, and Suzhou, the city centers are Tian An Men, Langfang Government,
People’s Square, and Suzhou Government, respectively.

 9
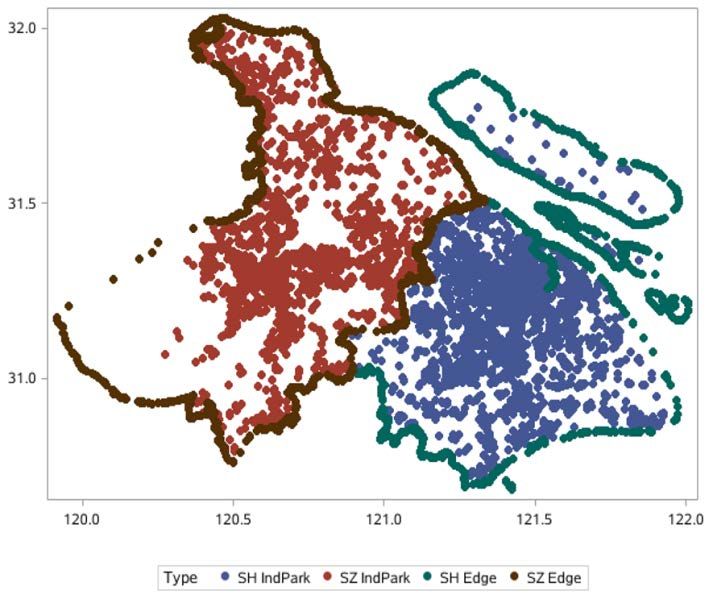
years after its introduction. In this sense, our study provides a conservative estimation for the
house price effects caused by HSR.

 Table 1 Summary statistics of house characteristics
 Shanghai Suzhou Beijing Langfang
 Price (10000 yuan) 383.69 233.79 369.40 152.55
 Size (m2) 84.76 95.42 82.93 82.49
 Room 2.04 2.49 2.01 1.92
 Parlor 1.37 1.71 1.15 1.08
 Banlou 0.90 0.86 0.55 0.29
 GoodDeco 0.17 0.42 0.38 0.33
 RelaFloor 3.06 3.06 3.04 3.04
 TotFloor 11.58 16.06 13.12 23.32
 Age (year) 17.04 16.06 16.10 6.21
 DCenter (km) 13.84 12.22 13.54 45.78
 DSubway (km) 1.21 2.27 1.02 N.A.
 DStation (10 km) 1.04 0.70 1.12 4.84
 Obs 201085 35988 584113 17026
 Sample period 2011-2019 2014-2019 2011-2019 2014-2019
Note. The table displays the averages of house characteristics. Price is the transaction price (in 10 thousand). The
definitions of other variables are summarized in Appendix C. At the bottom part of the table, we show the number
of observations and the sample period taken of each city.

4.2.3. POI data and classification of industrial parks
 We use the API service of AMap and Baidu Map, which are Chinese counterparts of
Google Maps, to obtain the longitude and latitude of point of interests (POIs). The API service
requires a “keyword” as a necessary input, and AMap and Baidu Map have different
efficiencies for different keywords. For a certain type of POIs, we try both AMap and Baidu
Map, and retain the set of results that are more complete and cleaner.
 In particular, we use AMap to obtain the locations of subway stations and industrial parks.
In Appendix A, Figure A1 shows the locations of industrial parks in Shanghai and Suzhou.
Figure A2 shows the locations of industrial parks in Beijing and Langfang. We classify
industrial parks into two groups: manufacturing industrial parks (MIPs) and service industrial
parks (SIPs). The classification is based on the names of industrial parks. In our POI dataset,
the name of an industrial park is the only thing that reveals its theme. For example, “Shanghai
Zhangjiang High-tech Zone” is a MIP; “Lujiazui Finance and Trade Zone” is a SIP. In
Appendix B, Table B1 and Table B2 display our lists for the keywords of MIPs and SIPs,
respectively. If the name of a park contains a keyword in the list of MIPs (SIPs, respectively),
then it is a MIP (SIP, respectively). If its name contains the keywords in both lists or in none
of the lists, then it belongs to the “Unclear” group. Table 2 displays the numbers of MIPs, SIPs,
and parks belonging to the “Unclear” group. Table 3 displays the summary statistics of houses’
distances to the nearest MIP or SIP, which are denoted as DMIP and DSIP, respectively. In the
four cities, the average distances range from 1 to 2 km. That is, industrial parks are surrounded
by houses, which makes it possible to infer the success of industrial parks by examining nearby

 10
house prices.

 Table 2 The number of industrial parks
 Shanghai Suzhou Beijing Langfang
 MIP 2041 1544 980 147
 SIP 812 267 535 28
 Unclear 2003 804 985 131
 Total 4856 2615 2500 306
Note. This table displays the numbers of manufacturing industrial parks (MIPs), service industrial parks (SIPs),
and the parks with unclear type (Unclear). The last row shows the total number of industrial parks.

 Table 3 Summary statistics of DMIP and DSIP
 Mean Std p25 p50 p75
 Shanghai DMIP 0.93 0.61 0.47 0.78 1.27
 DSIP 1.21 1.02 0.58 0.97 1.55
 Suzhou DMIP 0.97 0.62 0.49 0.81 1.33
 DSIP 2.07 1.46 0.91 1.69 2.95
 Beijing DMIP 1.20 0.81 0.60 1.04 1.61
 DSIP 1.42 0.92 0.76 1.28 1.82
 Langfang DMIP 1.68 1.00 1.00 1.43 2.15
 DSIP 2.19 1.44 1.00 2.17 2.85
Note. This table displays the mean, standard deviation, the 25 percentile, the median, and the 75th percentile of
 th

DMIP and DSIP, which are the distances to the nearest MIP and SIP, respectively.

 Further, we use Baidu Map to obtain the locations of Residential Zone Offices (RZO).
Residential Zone is a very small administration unit, and is called “Jie Dao” in Chinese.
Matching each house to the nearest RZO, we can control for RZO-fixed effects in our baseline
regressions. For example, houses in Beijing and Shanghai are matched to 142 and 121 RZOs,
respectively.

5. Empirical results
 We first conduct micro-level house price analysis for the two city pairs. Then we conduct
city-level GDP analysis for the manufacturing industry and the service industry.

5.1. House price analysis for two city pairs
 Shanghai-Suzhou is a core-periphery pair in the Yangtze River Delta (YRD), one of
China’s most developed regions. Beijing-Langfang is a pair in the Jing-Jin-Ji (JJJ) region,
which is also economically important. The development of YRD is more balanced than JJJ.
For example, in 2017, Shanghai contributed 18% of the jobs in YRD. In contrast, in 2018,
Beijing contributed 41% of the jobs in JJJ, according to China’s National Bureau of Statistics
(NBS).
 For each of the four cities, we run regression (1). The dependent variable is the natural
logarithm of the transaction price of house i, which was transacted in month t. On the right

 11
hand side, DMIP and DSIP are the distances (in km) to the nearest MIP and SIP, respectively.
Their coefficients indicate the house price premium of MIPs and SIPs at the beginning of our
sample period. For example, a negative coefficient of DMIP would indicate that house prices
decreases with the distance to MIPs. In other words, house prices are higher in the vicinity of
MIPs. This means a positive house price premium of MIPs.
 Time is the transaction year minus the starting year of our sample period. Hence, for
Shanghai and Beijing, it equals transaction year minus 2011; for Suzhou and Langfang, it is
transaction year minus 2014. The interactions of DMIP and DSIP with Time capture the time
trend of the house price premium of MIPs and SIPs, respectively. For example, a negative
coefficient of DMIP*Time would indicate that the house price premium of MIPs has been
increasing over time, because house prices near MIPs are becoming more and more expensive
relative to those farther away.
 DStation is the distance (in 10 km) to the nearest HSR station. Here we consider the three
largest HSR stations in Shanghai: Shanghai Hongqiao Railway Station, Shanghai Railway
Station, and Shanghai South Railway station. They contribute 70%, 21%, and 6% of the HSR
trains that stop at Shanghai. The triple-way interaction terms DMIP*Time*DStation and
DSIP*Time*DStation captures the impact of the HSR station on the house premium trend of
MIPs and SIPs. For example, a negative coefficient of DMIP*Time*DStation would indicate
that the house price premium of MIPs located far from HSR stations has grown faster than that
of MIPs near HSR stations. In other word, proximity to HSR stations is associated with a slower
growth in the premium of MIPs. This, in turn, indicates a negative impact of the HSR station
on the manufacturing industry.
 ln Prci ,t = intercept + β1 DMIPi + β 2 DMIPi * Timet + β3 DMIPi * Timet * DStationi
 + β 4 DSIPi + β5 DSIPi * Timet + β 6 DSIPi * Timet * DStationi + β 7 DStationi
 (1)
 + β8 DStationi * Timet + β9 DCenteri + β10 DSubwayi + β11Sizei + β12 Agei + β13 Roomi
 + β14 Parlori + β15 Banloui + β16GoodDecoi + β17 RelaFloori + β18TotFloori
 + β19 RelaFloori * TotFloori + Facei + Zonei + Yeart + ε i ,t
 In the regression, we control for the direct impact of HSR stations on house prices by
DStation. We also control for the time trend of this impact by DStation*Time. In addition, we
control for the distance to the city center (DCenter), distance to the nearest subway station
(DSubway), house size (Size), house age (Age), the number of bedrooms (Room), the number
of parlors (Parlor), building type (Banlou), interior decoration level (GoodDeco), the position
of a house in the apartment building (RelaFloor), and the total number of floors in the
apartment building (TotFloor). We also include the interaction between RelaFloor and Totfloor,
because buildings with less than 7 floors usually do not have elevators and thus higher floors
are less favorable. In contrast, for high-rise buildings with elevators, higher floors are more
favorable because of good views. Finally, we control for the direction to which a house faces
by the dummy vector Face, control for the residential-zone fixed effects by the dummy vector
Zone, and control for year fixed effects by the dummy vector Year. Standard errors are clustered
by year, given the importance of Time in the regression.
 If our hypotheses are true, then we expect that the coefficient of DMIP*Time*DStation is

 12
negative for the core city, but positive for the periphery city. Meanwhile, the coefficient of
DSIP*Time*DStation is positive for the core city, but negative for the periphery city.
 The results for Shanghai are displayed in Table 4 Column (1). The coefficients of
DMIP*Time and DSIP*Time are both negative, indicating that the house price premium of
MIPs and SIPs are both increasing over time. More importantly, the coefficient of
DMIP*Time*DStation is significantly negative. As a MIP becomes 10 km closer to the nearest
HSR station, the growth of the MIP’s house price premium would be reduced by 12.5% (i.e.,
0.0012/0.0096). Meanwhile, the coefficient of DSIP*Time*DStation is significantly positive.
As a SIP becomes 10 km farther from nearest HSR station, the growth of the SIP’s house price
premium would be reduced by 27.7% (i.e., 0.0023/0.0083). These results are consistent with
H1b and H2b, indicating that HSR has a negative effect on the manufacturing industry in
Shanghai, while having a positive effect on the service industry. In addition, the coefficients of
Dstation and its interaction with Time are both insignificant, which means that HSR stations
do not have a direct impact on house prices nearby. This is unsurprising, given that few
individuals would live in a core city (and bear the high housing cost) while working in a
periphery city.
 Then we look at Suzhou. Lianjia’s coverage in periphery cities started later than in core
cities. The transaction records of Suzhou starts in 2014. However, from 2014 to 2019, the
number of HSR trains that brings passengers from Suzhou to Shanghai increased from 292 to
560. The significant increase in HSR service frequency potentially enhanced the HSR effects
in Suzhou. When calculating DStation, we consider five HSR stations: Suzhou Station,
Kunshan South Station, Suzhou North Station, Suzhou Industrial Park District Station, and
Suzhou National Hi-Tech District Station. They, respectively, contribute 37%, 33%, 21%, 6%,
and 2% of the HSR trains that bring passengers from Suzhou to Shanghai. The last two stations
do not contribute a large proportion of HSR trains, but we still include them, because they are
located in two important Special Economic Districts (SED). In 2015, the two SEDs contributed
more than 34% of the export value of Suzhou, according to Wind database.
 We additionally control for DCoreCity, which is the distance (km) to the center of
Shanghai, i.e., People’s Square. We also include its interaction with Time. In the pre-HSR era,
proximity to the core city was valuable, which made house prices on the boundary between
Suzhou and Shanghai relatively expensive. But in the post-HSR era, this value may decline,
because people in periphery cities can easily reach the core city by taking a HSR train, instead
of driving for several hours. Therefore, we expect a positive coefficient of DCoreCity*Time,
i.e., people in Suzhou become more willing to buy houses far from the core city as time goes
by. 7
 The results of Suzhou are displayed in Table 4 Column (2). Here we use a sample period
of 2015-2019, because Room and Parlor are unavailable before 2015. The coefficient of
DMIP*Time*DStation is significantly positive, and the coefficient of DSIP*Time*DStation is

7 For the two periphery cities, we do not control for residential-zone fixed effects. The house transaction volume and the
market share of Lianjia in periphery cities are both smaller than in core cities. Controlling for these fixed effects would remove
a large proportion of variation in the data. This is especially true for Suzhou, which has as many as five HSR stations. The
variation of DStation is already small; if we are limited to one residential zone, the variation would become even smaller. We
control for local amenity by DCenter, DSubway, and DCoreCity.

 13
significantly negative. These results are consistent with H1a and H2a, indicating that HSR
benefits the manufacturing industry of Suzhou, while hurting its service industry. Moreover,
the coefficient of DCoreCity is significantly negative and the coefficient of DCoreCity*Time
is significantly positive. That is, house prices used to be higher in places that are closer to
Shanghai, but the premium of proximity to Shanghai has been declining overtime. This is
consistent with our expectation. If we drop Room and Parlor from the regression and use the
sample period of 2014-2019, the results are similar and available upon request.

 Table 4 Impact of HSR on the house price premium of industrial parks
 (1) Shanghai (2) Suzhou (3) Beijing (4) Langfang
 DMIP 0.1006*** -0.0564 -0.0085 0.0729**
 (0.0155) (0.0294) (0.0051) (0.0223)
 DMIP*Time -0.0096*** -0.0118 0.0032 **
 -0.0143**
 (0.0027) (0.0084) (0.0013) (0.0036)
 DMIP*Time*DStation -0.0012** 0.0187 **
 -0.0026 ***
 -0.0001
 (0.0004) (0.0051) (0.0006) (0.0007)
 DSIP 0.0270* 0.0015 0.0225 ***
 -0.0425***
 (0.0121) (0.0135) (0.0052) (0.0040)
 DSIP*Time -0.0083*** 0.0188 ***
 -0.0044 **
 0.0276***
 (0.002) (0.0031) (0.0015) (0.0018)
 DSIP*Time*DStation 0.0023*** -0.0145 ***
 0.0014 ***
 -0.0060***
 (0.0003) (0.0012) (0.0003) (0.0004)
 * ***
 DStation 0.0379 0.1730 0.1461 0.6592***
 (0.0351) (0.0679) (0.0362) (0.0506)
 ** ***
 DStation*Time 0.0037 -0.0326 0.0078 0.0083
 (0.0048) (0.0098) (0.0019) (0.0103)
 **
 DCoreCity -0.0288 -0.0299***
 (0.0075) (0.0043)
 **
 DCoreCity*Time 0.0051 0.0045***
 (0.0015) (0.0010)
 Other Controls Y Y Y Y
 Sample period 2011-2019 2015-2019 2011-2019 2014-2019
 Obs 190774 35893 568037 16576
 2
 R 78.68% 65.16% 77.13% 77.67%
Note. The dependent variable is the natural logarithm of transaction prices. DMIP and DSIP are the distances (in
km) to the nearest MIP and SIP, respectively. For Shanghai and Beijing, Time is transaction year minus 2011; for
Suzhou and Langfang, it is transaction year minus 2014. DStation is the distance (in 10 km) to the nearest HSR
station. For Suzhou, DCoreCity is the distance (km) to the center of Shanghai, i.e., People’s Square. For Langfang,
DCoreCity is the distance (km) to the center of Beijing, i.e., Tian An Men. The coefficients of other controlling
variables displayed in formula (1) are not reported. Numbers in parentheses are standard errors, which are
clustered by year. Significance levels of 10%, 5%, and 1% are marked by *, **, and ***, respectively.

 Next, we examine Beijing. The city has three HSR stations: Beijing South Station, Beijing
West Station, and Beijing Station. As shown in Table 4 Column (3), the results are similar to
those of Shanghai. That is, consistent with H1b and H2b, The coefficient of
DMIP*Time*DStation is significantly negative, and the coefficient of DSIP*Time*DStation is

 14
significantly positive. That is, HSR benefits the service industry of Beijing, but hurts its
manufacturing industry.
 Then we examine Langfang. The city only has one HSR station: Langfang Railway Station.
DCoreCity is redefined as the distance (km) to the center of Beijing, i.e., Tian An Men. The
results are given in Column (4). The coefficient of DSIP*Time*DStation is significantly
negative, indicating that HSR hurts the service industry of Langfang. This is consistent with
H2a.
 However, the coefficient of DMIP*Time*DStation is insignificant for Langfang. HSR does
not have a significant effect on the manufacturing industry there. This is understandable,
because the manufacturing industry of Beijing is relatively small. In 2006, the year before the
launch of HSR, the secondary industry GDP of Beijing was only 44% of that in Shanghai. 8
Therefore, there are not many manufacturing activities that can be relocated from Beijing to
Langfang. The relatively weak manufacturing industry of Beijing also means a low likelihood
for nearby manufacturing firms to benefit from input-output linkages with Beijing. Even for
manufacturing firms that decide to locate in JJJ, Langfang might not be the best destination.
Because of the air quality requirement of Beijing, the production activities of manufacturing
firms around Beijing are interrupted from time to time, which hurts their profitability. Places
farther from Beijing would be a better choice, such as Tangshan, which is another periphery
city in JJJ. In theory, agglomeration spillover may happen between two regions that are
relatively far away from each other (Lenaerts, 2021). For data availability reasons, we cannot
do a micro-level analysis for Tangshan, but there is some evidence that the manufacturing
industry of Tangshan has been growing. From 2006-2018, the share of GDP contributed by the
secondary industry increased from 59% to 61% in Tangshan. As a comparison, this number
decreased from 57% to 38% in Langfang.
 In general, this section finds that HSR benefits the service industry of core cities, while
hurting this industry in periphery cities. Meanwhile, HSR hurts the manufacturing industry in
core cities, while benefiting this industry in periphery cities. These findings indicate that HSR
facilitates a spillover effect from a core to its peripheries for the manufacturing industry, but a
siphon effect for the service industry.

5.2. City-level GDP analysis
 Now we directly examine the GDP of the secondary industry and the tertiary industry. We
consider all prefecture cities with GDP data in the Wind database. Our micro-evidence suggests
a siphon effect in the service industry and a spillover effect in the manufacturing industry.
Accordingly, we expect that HSR deters the growth of the tertiary industry GDP in a periphery
city, given that the core city has a strong tertiary industry. Meanwhile, HSR is expected to
stimulate the growth of the secondary industry in a periphery city, given that the core city has
a strong secondary industry.
 When we consider all prefecture cities in the country, the definition of core cities and
periphery cities become a critical issue. We separately consider the “developed region” and the

8 As a comparison, Beijing’s tertiary GDP was 106% of that in Shanghai.

 15
“hinterland region”. The developed region consists of three parts: YRD, JJJ, and Pearl River
Delta (PRD). The developed region accounted for 25% of the national GDP in 2018. Shanghai
is the core of YRD. Beijing is the core of JJJ. PRD has two cores: Guangzhou and Shenzhen. 9
These four cities are the first-tier cities in China. Other cities in the developed region are
periphery cities. For a periphery city in PRD, Guangzhou or Shenzhen, whichever closer, is its
core city.
 The region in China other than the developed region is the hinterland region. In this region,
we regard second-tier cities as core cities. Here second-tier cities refer to provincial capitals
and municipalities with independent planning status. There are 27 provincial capitals and 5
municipalities with independent planning status. Since one of the municipalities with
independent planning status is Shenzhen, we have a total of 31 second-tier cities (i.e. 27+5-1)
in the hinterland area. All cities other than the 31 cities are periphery cities. For a periphery
city, the nearest second-tier city is its core city.
 Then we conduct our tests separately for the developed region and the hinterland region.
We do not combine them together; otherwise, it will be hard to judge whether a second-tier city
should be a core city or a periphery city. In the developed regions, a provincial capital may be
a periphery city. For example, Shijiazhuang is the capital of Hebei Province, yet it is a periphery
city of Beijing. But in hinterland regions, a province capital is always a core city.
 We start with the developed region. We first consider the secondary industry of periphery
cities. In regression (2), the dependent variable is the cumulative growth rate of the secondary
industry GDP in city c from 2006 to 2018. Core cities are not included the regression. On the
right-hand side, the key variable is FreqHSR, which is the number of HSR trains (in hundred)
that stop in a city in 2019. It equals 0 if a city was not connected to the HSR network by that
time. This variable reflects the cumulative growth of HSR service frequency. The variables
lnCoreSecGDP06 and lnCoreTerGDP06, respectively, are the natural logarithm of the
secondary industry GDP and the tertiary industry GDP in the core city near city c in 2006. They
describe the initial condition of the core city. Based on our micro-level findings, we expect a
positive coefficient of lnCoreSecGDP06*FreqHSR. Intuitively, the spillover effect should be
larger when the core city has a strong manufacturing industry, such as Shanghai. In the
regression, we control for the natural logarithm of the distance to the core city (lnDisCore). We
also control for SecTier, which is a dummy that equals 1 if city c is a provincial capital or
municipality with independent planning status, and 0 otherwise.
 SecGDPg 0618c = intercept + β1 ln CoreSecGDP06c + β 2 ln CoreTerGDP06c
 (2)
 + β3 ln CoreSecGDP06c * FreqHSRc + β 4 ln CoreTerGDP06c * FreqHSRc
 + β5 FreqHSRc + β 6 ln DCoreCityc + β 7 SecTierc + ε c
 The results are displayed in Table 5 Column (1). The coefficient of FreqHSR is
significantly positive, suggesting an overall positive impact of HSR on the development of the
secondary industry in periphery cities. But the coefficients of the interaction terms are
insignificant.

9 JJJ and YRD include cities that are no more than 300 km from Beijing and Shanghai, respectively. PRD includes cities that
are no more than 300 km from either Guangzhou or Shenzhen.

 16
Table 5 HSR and industrial GDP in periphery cities
 Developed Hinterland
 (1) Secondary (2) Tertiary (3) Secondary (4) Tertiary
 lnCoreSecGDP06 1.7852** 0.9511* 0.5171 0.0312
 (0.3338) (0.3421) (0.6835) (0.556)
 lnCoreTerGDP06 0.0292 0.7844 -0.0135 0.1571
 (0.6951) (0.5057) (0.6807) (0.6022)
 lnCoreSecGDP06*FreqHSR -0.0975 0.1422** 0.4316** 0.1609
 (0.0625) (0.0317) (0.2079) (0.1924)
 lnCoreTerGDP06*FreqHSR -0.2430 -0.2304* -0.4701* -0.0979
 (0.1438) (0.0818) (0.2472) (0.2521)
 FreqHSR 2.7798* 0.6912 0.1220 -0.4479
 (0.9510) (0.5186) (0.9171) (0.8121)
 lnDCoreCity 0.1323 -0.2564 0.3489 0.1450
 (0.1833) (0.5177) (0.2985) (0.1461)
 SecTier 0.2702 0.3448
 (0.2551) (0.3542)
 Obs 51 51 239 239
 2
 R 36.66% 23% 47.51% 56.51%
Note. Columns (1) and (2) focus on periphery cities in the developed region. Columns (3) and (4) focus on
periphery cities in the hinterland region; the coefficients of dummies that control for province-fixed effects are
not reported. In Column (1) and (3), the dependent variable is the growth rate of the secondary industry GDP from
2006 to 2018. In Columns (2) and (4), the dependent variable is the growth rate of the tertiary industry GDP from
2006 to 2018. On the right hand side, lnCoreSecGDP06 and lnCoreTerGDP06 are, respectively, the natural
logarithm of the secondary industry GDP and the tertiary industry GDP of a city’s core city in 2006. FreqHSR is
the number of HSR trains (in hundred) that stop in the city, according to the timetable of 2019. The definitions of
other controlling variables are summarized in Appendix C. Numbers in parentheses are standard errors, which
are clustered by the core city. Significance levels of 10%, 5%, and 1% are marked by *, **, and ***, respectively.

 Secondly, we consider the tertiary industry. We replace the dependent variable with the
GDP growth rate of the tertiary industry from 2006 to 2018 (i.e. TerGDPg0618), and rerun
regression (2). The results are displayed in Table 5 Column (2). The coefficient of
lnCoreTerGDP06*FreqHSR is significantly negative. This means the negative effect of HSR
on the tertiary industry of a periphery city is more pronounced when its core city has a strong
tertiary industry. This is consistent with the siphon effect in the service industry.
 Then we consider hinterland regions. We modify regression (2) by dropping SecTier and
adding dummies that control for province-fixed effects. In Table 5 Column (3), the dependent
variable is the GDP growth rate of the secondary industry from 2006 to 2018. The coefficient
of the interaction between lnCoreSecGDP06 and FreqHSR is significantly positive. This means
that the positive effect of HSR on the secondary industry of a periphery city is more pronounced
when its core city has a strong secondary industry. This is consistent with the spillover effect
in the manufacturing industry. In Column (4), the dependent variable is the GDP growth rate
of the tertiary industry from 2006 to 2018. None of the variables involving FreqHSR has a
significant coefficient.

 17
In summary, this sub-section finds support that HSR leads to a siphon effect in the service
industry within the developed region, and a spillover effect in the manufacturing industry
within the hinterland region. Within the developed region, we do not find strong evidence for
a spillover effect in the manufacturing industry. This might be due to the trend that many
manufacturing firms are being relocated from the developed region to the hinterland region,
instead of moving within the developed region. Because of the rapid development of the HSR
network, core cities in the hinterland region also have good market access now. Within the
hinterland region, we do not find strong evidence for a siphon effect in the service industry. A
potential reason is that the service industry in core cities of the hinterland region is not as strong
as that of first-tier cities, so a siphon effect cannot be generated.

6. Additional tests and robustness check
 First, we show evidence from shared bike riding records that support our major conclusions.
Then we discuss about Tianjin, which is something between a core city and a periphery city in
JJJ. Finally, we show that our conclusions are robust if we replace Time with HSR service
frequency in the baseline regression.

6.1. Evidence from riding records of dockless shared bikes
 Some may be concerned that house price growth around an industrial park may not be
caused by increased employment in the park. Instead, it may be caused by gentrification or
other factors. To mitigate this concern, we refer to the riding records of dockless shared bikes.
Intuitively, if many riders reach an industrial park during morning rush hours, then the park
likely has a large employment.
 We obtain the riding records from Meituan Bike. Once known as Mobike, Meituan Bike
is one of the first bike sharing brands in China. It has maintained its status as a major player in
the bike sharing industry so far, accounting for about half of the market share. 10 Our sample
area consists of five regions in Shanghai, and the radius of each region is 5 km. 11 That is, the
rides in our sample all started in the five regions, but the ending points can be anywhere. The
centers of the five regions are five important subway stations: Zhongshan Park Station of
subway Line 2, Century Avenue Station of subway Line 6, Shanghai South Railway Station of
subway Line 1 and subway Line 3, Xinzhuang Station of subway Line 1, and Jiuting Station
of subway Line 9. Shanghai has more than 300 subway stations, and the five stations have the
7th, 13th, 10th, 4th, and 5th largest passenger volume. For people who work in the industrial parks
located in these five regions, the combination of subway and shared bike is a good
transportation choice.
 Figure 3 illustrates our sample area on a map of Shanghai. Although it seems to be small

10 We refer to the 2017 wave of China Household Finance Survey (CHFS). It covers 170 cities from 29 provinces of China,
and includes a section about bike sharing usage. Totally 1,453 urban respondents disclosed that they were shared bike users.
Among them, 804 chose Meituan Bike, which represented 55% of the shared bike users. The percentage for Shanghai is also
55%. Please see more details about CHFS in Gan et al. (2014).
11 Meituan Bike allowed us to choose five regions, with each region having a radius of no more than 5 km. We decide to

choose five regions around important subway stations. We try to make a balance between the passenger volume of the stations
and the density of residents nearby. We also try to avoid choosing overlapping regions, so as to maximize the geographic
coverage.

 18
relative to the total area of the city, it is located in the central city, which has high population
density. Actually, up to 37% of the house transactions done through Lianjia are located in this
sample area.

 Figure 3 Sample area of Meituan Bike data
Note. The blue dots mark the starting points of rides between 7:30-9:30 a.m. on 9 October 2017. For data
availability reasons, we do not have access to the records of rides that started in other regions. The red points
indicate the boundary of Shanghai.

 For each industrial park, we count the number of rides that arrived at a place less than 500
meters away from the center of the park during morning rush hour on working days. In
Shanghai, morning rush hour is 7:30-9:30 a.m. This number of rides should be positively
correlated with the size of employment in the park. Of course, its value is affected by the local
amenities around the park, such as spaces to park shared bikes, presence of bike lanes, market
coverage of Meituan Bike, etc. Therefore, we scale it by the number of rides that started at the
park during morning rush hour. We denote the resulting variable as Arrival. 12

 Table 6 Summary statistics of arrivals at industrial parks
 MIP SIP
 Mean Std Median Mean Std Median
 Arrival on 9 Oct 2017 1.51 2.47 1.04 1.69 1.72 1.17
 Arrival on 9 June 2020 1.96 2.84 1.06 2.28 3.05 1.15
 ArrivalGrow 0.31 0.85 0.07 0.34 1.24 0.02
Note. Arrival is the number of rides that end at an industrial park during morning rush hour, scaled by the number
of rides that start from the park. ArrivalGrow is the growth of Arrival from 9 Oct 2017 to 9 June 2020.

12 Some may be concerned that the scaling variable depends on the number of people that live around the industrial park,

which may introduce noise to Arrival. However, this is a minor issue, because all the five regions have many house units. To
illustrate this, we make use of the records of transportation card usage on 13 April 2015, an ordinary Monday. We look at the
last subway station where a passenger used his/her transportation card, and assume that the station is close to his/her home.
Then, for each subway station, we calculate the number of passengers whose homes are nearby. Among the 313 subway
stations of Shanghai, the five subway stations (which are at the centers of the five regions) have the 21st, 20th, 10th, 1st, and
3rd largest number of house units nearby.

 19
You can also read