Historical Channel-Planform Change of the Little Colorado River near Winslow, Arizona - Scientific Investigations Report 2014-5112

Page created by Roy Bowman
 
CONTINUE READING
Historical Channel-Planform Change of the Little Colorado River near Winslow, Arizona - Scientific Investigations Report 2014-5112
Prepared in cooperation with the Navajo Nation

Historical Channel-Planform Change of the Little Colorado
River near Winslow, Arizona

Scientific Investigations Report 2014–5112

U.S. Department of the Interior
U.S. Geological Survey
Historical Channel-Planform Change of the Little Colorado River near Winslow, Arizona - Scientific Investigations Report 2014-5112
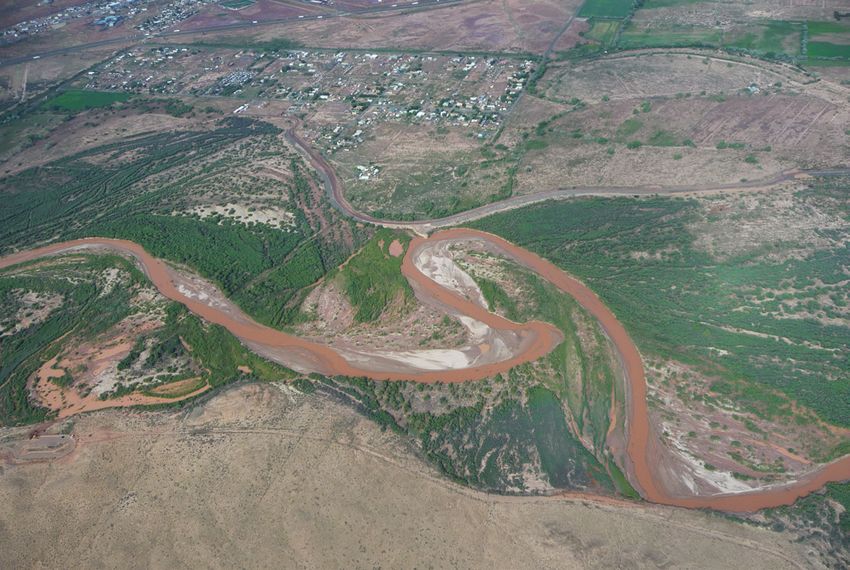
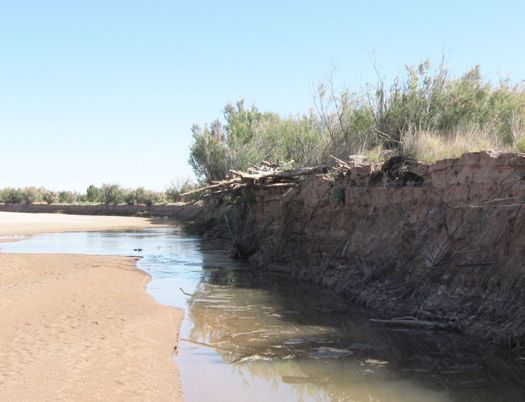
FRONT COVER
The Little Colorado River between Homolovi State Park and Winslow, Ariz., August 3, 2013. View westward; photograph
by Jon Mason, U.S. Geological Survey.
Historical Channel-Planform Change of the Little Colorado River near Winslow, Arizona - Scientific Investigations Report 2014-5112
Historical Channel-Planform Change of
the Little Colorado River near Winslow,
Arizona

By Debra Block

Prepared in cooperation with the Navajo Nation

Scientific Investigations Report 2014–5112

U.S. Department of the Interior
U.S. Geological Survey
U.S. Department of the Interior
SALLY JEWELL, Secretary

U.S. Geological Survey
Suzette M. Kimball, Acting Director

U.S. Geological Survey, Reston, Virginia: 2014

For more information on the USGS—the Federal source for science about the Earth,
its natural and living resources, natural hazards, and the environment—visit
http://www.usgs.gov or call 1–888–ASK–USGS

For an overview of USGS information products, including maps, imagery, and publications,
visit http://www.usgs.gov/pubprod

To order this and other USGS information products, visit http://store.usgs.gov

Suggested citation:
Block, Debra, 2014, Historical channel-planform change of the Little Colorado River near Winslow, Arizona:
U.S. Geological Survey Scientific Investigations Report 2014-5112, 24 p., 2 plates, http://dx.doi.org/10.3133/
sir20145112.

ISSN 2328-0328 (online)

Any use of trade, firm, or product names is for descriptive purposes only and does not imply
endorsement by the U.S. Government.

Although this information product, for the most part, is in the public domain, it also may contain
copyrighted materials as noted in the text. Permission to reproduce copyrighted items must be
secured from the copyright owner.
  iii

Acknowledgments
      This study was conducted with the permission of the Navajo Nation Department of
Minerals, the Navajo Nation Water Management Branch, and the Leupp and Birdsprings
Chapters of the Navajo Nation. Access to the Winslow levee was granted by Trent Larson of
Navajo County. The staff of Homolovi State Park graciously allowed access to the river channel
adjacent to the park. Tammy Rittenour of the Utah State University’s Luminescence Laboratory
analyzed the optically stimulated luminescence signals from late Pleistocene terraces adjacent
to the study area (fig. 1). Michael Marshall, of the USGS, provided guidance on the use of the
R statistical software. Colleagues in the USGS Arizona Water Science Center, particularly Dave
Anning, Don Bills, Brad Garner, Nancy Hornewer, Jamie Macy, and Jon Mason, contributed
their data and expertise in numerous invaluable discussions. I thank Kyle House, Paul Grams,
Chuck Powell, and Margaret Hiza Redsteer of the USGS for their detailed and helpful reviews
of the manuscript, and Joel Pederson, of the Utah State University, for his additional technical
review.
iv  

       Contents
       Abstract............................................................................................................................................................1
       Introduction.....................................................................................................................................................1
       Regional Setting and Study Area.................................................................................................................2
            Hydroclimate..........................................................................................................................................3
            Vegetation...............................................................................................................................................4
            Previous Work........................................................................................................................................4
       Methods...........................................................................................................................................................4
            Hydroclimatic Analysis.........................................................................................................................4
            Channel-Planform Analysis..................................................................................................................6
       Results ..............................................................................................................................................................8
            Hydroclimatic Change...........................................................................................................................8
            Channel-Planform Adjustment............................................................................................................8
       Discussion......................................................................................................................................................12
            Regional Hydroclimate........................................................................................................................12
            Vegetation and Channel Morphology...............................................................................................15
            Flood Record.........................................................................................................................................15
            Channel Response to Flow Events....................................................................................................16
            Flood-Hazard Assessment and Mitigation......................................................................................18
       Conclusion.....................................................................................................................................................20
       References Cited..........................................................................................................................................20
  v

Figures
1.	  Map of the Little Colorado River Basin, Arizona................................................................................2
2.	  Hydrographs for streamflow-gaging stations on the Little Colorado River...................................5
3. Local hydroclimatic data trends...........................................................................................................9
4.	  Active channel area from 1936 to 2010..............................................................................................10
5.	  Active channel width from 1936 to 2010............................................................................................10
6.	  Channel centerline migration distances and annualized migration rates...................................11
7.	  Cumulative centerline migration versus distance along Little Colorado River near
		 Winslow, Ariz................................................................................................................................11
8.	  Historical channel-migration ratio map.............................................................................................13
9.	  Aerial photographs showing sinuosity of avulsion zones..............................................................14
10. Photographs of active meander bend on the Little Colorado River near Winslow, Ariz...........15
11. Hydrographs for flood events at two streamflow-gaging stations on the Little Colorado
		River...............................................................................................................................................18
12. Aerial photographs showing geomorphologic changes and human modifications to the
          channel..........................................................................................................................................19

Tables
1. Aerial photographs used in channel analysis of Little Colorado River near Winslow, Ariz.......7
2. 	  Comparison of aerial photography record with flood record on the Little Colorado River
         near Winslow, Ariz.......................................................................................................................17

Plates
[Available online only at http://pubs.usgs.gov/sir/2014/5112/.]

1. Historical Channel-Planform Change Map of the Little Colorado River near Winslow,
		Arizona.
2. Map of Channel Migration Distance on the Little Colorado River between Winslow
		 and Leupp, Arizona.
Historical Channel-Planform Change of the Little Colorado
River near Winslow, Arizona

By Debra Block

Abstract                                                         (McMahon, 1979). Thus, the frequency distribution of dis-
                                                                 charge in dryland rivers is unlike that in humid rivers (Bull
      This study evaluates channel-planform adjustment on an     and Kirkby, 2002).
alluvial reach of the Little Colorado River and documents the          Flood-plain management of meandering dryland rivers
geomorphic evolution of the channel through an analysis of       like the Little Colorado presently relies on flood-frequency
aerial photographs and orthophotographs for the period           analyses, which incorporate an assumption of stationarity.
1936–2010. The Little Colorado River has adjusted to             Yet this assumption, under which system variables (for
the effects of an extreme flood in 1923 and a subsequent         example, annual streamflow) are statistically time invariant,
decline in peak discharge and mean annual flow by channel        is invalidated by the hydrologic variability intrinsic to
narrowing: the channel width and area of the river have          drylands (Webb and Betancourt, 1992). Mixed populations of
decreased by approximately 90 percent over the study period.     flood-generating storms further complicate flood-frequency
Although deposition historically exceeds erosion, lateral        analyses along dryland rivers (Dunne and Leopold, 1978),
migration exacerbates localized erosion, particularly near       and additional complexities result from changing climatic
hydraulic controls. Despite repeated cutoff and avulsion, the    trends in the Western United States (Barnett and others, 2008).
Little Colorado River has steadily increased in length and       Indeed, the current magnitude and ubiquity of hydroclimatic
sinuosity over a period of 74 years.                             change undermines any assumption of stationarity for water
      Changes in temperature and precipitation are likely        management globally (Milly and others, 2008).
affecting the discharge of the Little Colorado River near and          In contrast, this study presents an evaluation of the
downstream of Winslow, Ariz. Nonparametric methods of            geomorphic response to changing hydroclimatic conditions.
trend detection determine whether the probability distribution   Historical channel-planform change provides a context for
of temperature, precipitation, and peak streamflow has           flood-plain-management planning. Such change is measur-
changed over time. Time-series plots of temperature and          able on channel polygons mapped from aerial photography
precipitation show statistically significant trends at the       in a geographic information system (GIS). Channel-planform
99-percent-confidence level when evaluated with a                adjustment is a vital component of management-relevant land-
Mann-Kendall test. An increasing trend was indicated in mean     scape change in dryland fluvial environments.
daily minimum air temperature (Tmin), whereas decreasing               This study documents the channel-planform change of
trends were indicated in both annual precipitation (Pann) and    the Little Colorado River between the city of Winslow, Ariz.,
monsoon-seasonal precipitation (Pjas), as well as in peak        and the Navajo Nation community of Leupp (fig. 1), using
discharge.                                                       mapping and GIS analysis of aerial photography acquired
                                                                 between 1936 and 2010. Repeat mapping indicates a near-
                                                                 tenfold reduction in two-dimensional channel area and a
                                                                 comparable decrease in average channel width over a period
Introduction                                                     of 74 years. Channel narrowing has commonly been ascribed
                                                                 to changes in vegetation or hydrology. Riparian vegetation
     Fluvial processes in dryland regions differ substantially   does influence flow hydraulics and, therefore, morphology by
from those in humid temperate regions (Graf, 1988), primar-      increasing the coefficient of roughness, thereby inducing sedi-
ily with regard to when and how streamflow occurs. Whereas       ment deposition (Thorne, 1990). Yet where cutbank heights
arid- or semiarid-zone rivers are typically intermittent and     are greater than rooting depths, roots are largely ineffective in
ephemeral or have erratic flow regimes, humid-zone riv-          preventing lateral bank erosion, and thus may not be a factor
ers are mostly perennial. In drylands, fluvial processes are     in channel narrowing (Jacobson and Pugh, 1998). Channel
driven by precipitation. Because precipitation and runoff are    narrowing has also been attributed to reduced peak flows,
extremely variable in drylands, both temporally and spatially,   whether controlled by impoundment, diversion, groundwater
river behavior also is characteristically inconstant. In fact,   withdrawal, or climate (for example, Bradley and Smith, 1984;
the hydrologic variability in North American drylands, as        Wohl and others, 2009; Ollero, 2010; Cadol and others, 2011;
defined by the coefficient of variation of annual streamflow,    Dean and Schmidt, 2011; Perşoiu and Rădoane, 2011). Reduc-
is about twice that of the entire North American Continent       tions in discharge on the study reach of the Little Colorado
2   Historical Channel-Planform Change of the Little Colorado River near Winslow, Arizona

River (fig. 1) are explainable by changes in temperature and                                             headwaters originating in the White Mountain volcanic field of
precipitation. Localized hydroclimatic trends are statistically                                          east-central Arizona (fig. 1). The river course is ~565 km long,
significant and suggest decreasing water availability as a                                               with a descent of >2 km in elevation. In the ~90-km study
driver in channel narrowing.                                                                             reach between Winslow and Leupp, the Little Colorado River
     The purposes of the present work are (1) to present repeat                                          valley approximately parallels the regional strike of the sedi-
measurements of channel morphology from aerial photog-                                                   mentary Mesozoic strata that the river has eroded. Its broad
raphy, (2) to broadly assess the effect of riparian vegetation                                           valley cuts across the Triassic Moenkopi and Chinle Forma-
on local channelflow, (3) to evaluate previous assessments of                                            tions, which are covered by extensive alluvial and eolian
channel stability, and (4) to augment knowledge of climatic                                              deposits (Billingsley and others, 2013). Clay, silt, and fine-to-
influence on the geomorphology of the Little Colorado River                                              medium-grained sand dominate the channel banks and bed in
near Winslow, Ariz. (fig. 1). This study adds to understand-                                             the study reach of the river. Banks are steep, and relief varies
ing of the potential responses of dryland fluvial systems                                                on the channel bed. Parts of the channel contain multiple
under duress from water scarcity and projected hydrologic                                                thalwegs. Bedrock strata of the Moenkopi Formation crop out
variability.                                                                                             sporadically in the channel bed near Leupp and infrequently
                                                                                                         along the right bank near Winslow.
                                                                                                               Chevelon and Clear Creeks are perennial tributaries that
Regional Setting and Study Area                                                                          flow northeasterly toward their confluences with the Little
                                                                                                         Colorado River above Winslow (fig. 1). These tributaries drain
     The Little Colorado River is a major northwest-flowing                                              the highly fractured sandstone bedrock highlands to the south-
tributary of the Colorado River in northeastern Arizona, with                                            west of the Little Colorado River flood plain. Minor spring

                                                                                                                                                                  COLORADO

                                                                                                                                             er
                                                                                                                                   UTAH

                                                                                                                                          Riv
                                                                                                                             ado                         Navajo Nation
                                                                                                                          lor
                                                                                                                        Co
                                                                                                                           GRAND
                                                                                                                          CANYON                Hopi

                                                                                                                                      L it
                                                                                                                                       tle
                                                                                                                                           Co
                                                                                                                                                lor
                                                                                                                                                      ad
                                                                                                                                                        oR
                                                                                                                                                          ive
                                                                                                                                                             r
                                                                                  Black Mesa

                                         Hopi                                                                                  ARIZONA                            NEW MEXICO

                                         Tribal                                                                                           0      50 KILOMETERS
                                         Lands                                                                                            0            50 MILES
           Cameron
                                                                              h
           !                                                                as
                                                                           W
                                                                       a
                                                  sh

                                                                     cc
                                   sh

                                              i Wa

                                                                la
                                 Wa

                                                           Po             as
                                                                              h
                            e bito

                                           ib

                                                                        oW
                                        Ora

                                                                   it
                                nn                              dd
                           Di                                 Je
                                                                                               Navajo Nation
           Grand Falls !
                     Tolchico !
                                                      Lit
                          Leupp !                        tle
                                                                              Co
                                                                                lor
                                                          Winslow
                                                                                   ad
                                                     !
                                                                                     o
                                                                                    !           Riv
                                                                                                   er
                                        ek

                                          e                                 Holbrook
                                     r Cr
                               a
                            Cle

                                                          k
                                                      r ee
                                                    C
                                                   elon
                                              Chev

                                                                                                                                                                         Figure 1. Map of the
                                                                                                           Lyman Lake                                                    Little Colorado River
                                                                                                                                                                         Basin (outlined in gray)
                                                                                                                                                                         in northeastern Arizona,
0     25        50                      100 KILOMETERS                                                                                                                   showing location of study
                                                                                                                                                                         reach in the area between
                                                                                                                                                                         Winslow and Leupp.
Regional Setting and Study Area   3

and seep inflow rises from bedrock fractures in the chan-          and precipitation patterns–or the extremes of these patterns,
nel between the input of the two creeks. An artesian spring        climate variability represents differences in global weather
in Clear Creek contributes to a base flow of 4 to 5 ft3/s near     systems occurring over periods of years to decades (Hansen
Winslow (Don Bills, written commun., 2011), which dimin-           and others, 2006). Global patterns of atmospheric flow drive
ishes rapidly downstream, where flow depends on runoff from        oceanic-circulation patterns; general atmospheric and oceanic
rainfall and snowmelt. Tributaries northeast of the study area,    circulations generate weather patterns that uniquely characterize
the ephemeral Tusayan Washes—Dinnebito, Oraibi, Polacca,           regional climates. Regional precipitation is distinctly bimodal
and Jeddito—dissect and drain mesas that step downward to          and has been described in many reports (for example, Hereford
the west, carrying monsoon flow during the summer months.          and others, 2002; Webb and others, 2004). During the warm
      The Little Colorado River watershed drains an area of        season, precipitation occurs as the North American Monsoon
~70,000 km2 that comprises 18 subbasins (see http://water.         (NAM) brings in moisture from the east Pacific Ocean and the
usgs.gov/osw/streamstats/). Although the river is ephemeral or     Gulf of California, initiating convective thunderstorms (Adams
intermittent along most of its course, perennial reaches occur     and Comrie, 1997). The NAM is characterized by a pronounced
at the headwaters and for 21 km above the mouth, where the         increase in rainfall beginning in July and lasting through Sep-
river is spring fed. The Little Colorado River was perennial       tember. Monsoon rainfall is locally concentrated; a 10-km-wide
above Holbrook in the early 1930s (Harrell and Eckel, 1939)        convective storm cell has an areal extent of only ~100 km2 at
and above Winslow in the 1910s (Gregory, 1916). Flow is            any one time, and a lifespan of only several minutes to hours
partly regulated downstream of Lyman Lake, an irrigation           (Hirschboeck, 1988). Although intense monsoonal rainstorms
storage reservoir near the headwaters that is maintained by        over sparsely vegetated ground may generate locally high rates
snowmelt, for ~30 km. Below that point, groundwater dis-           of overland flow, runoff is generally patchy, and few storms
charge is affected by withdrawal from the C aquifer, (Cooley       produce significant channel flow. In contrast, cool-season
and others, 1969), named for the primary water-bearing unit        precipitation (Oct. 16–Apr. 15; see Hereford and others, 2002)
within the aquifer, the Coconino Sandstone, which underlies        typically results from early-fall tropical cyclones and winter
the entire surface-water drainage of the Little Colorado River     low-pressure-frontal systems (for example, Webb and Betan-
(Hart and others, 2002). Groundwater discharge from the C          court, 1992). These storms are associated with anomalous
aquifer is the source of base flow for parts of the Little Colo-   atmospheric-circulation patterns, can affect an area of 106 km2,
rado River and for Chevelon and Clear Creeks.                      and have a characteristic lifespan of 3–6 days (Hirschboeck,
      Groundwater development in the Little Colorado River         1988). Most flooding on the Little Colorado River occurs during
Basin was negligible before the 1940s (Hart and others, 2002).     the cool season.
Since then, pumping, as well as episodes of sustained drought,           Generally, the spatial and temporal variability in pre-
has caused groundwater levels to decline, although the effects     cipitation directly affects hydrologic response in semiarid
have been localized mostly near industrial sites in the south-     regions. High rates of evaporation and transmission loss
central part of the basin (Hart and others, 2002). Pool and        result in disconnected drainage networks in which the flow
others (2010) constructed a numerical flow model to evaluate       produced from runoff is spatially discontinuous or decreases
the hydrologic effects of groundwater withdrawal on regional       downstream. Results from a study of a densely gaged experi-
groundwater-flow systems. The observed predevelopment              mental watershed in southeastern Arizona indicate that sig-
(pre-1938) hydraulic head at 129 wells that tap the C aquifer      nificant differences in rainfall totals over short distances are
was comparable to simulated steady-state water-level altitudes     reflected in a rapidly decreasing correlation of streamgage
during development (1938–2006). Simulated variations in            pairs with increasing distance between gages (Osborn and
groundwater discharge could not be evaluated against observa-      others, 1979). Large uncertainties in runoff estimation can
tions, owing to insufficient long-term gage records. Simulated     result from even small-scale spatial differences in rainfall
groundwater budgets for the Little Colorado River Basin            (Faurès and others, 1995). Thus, broadly interpolated data
near Winslow, however, indicate that historical changes are        from the sparsely gaged watershed of the Little Colorado
dominated by variations in recharge rates, not by withdrawals      River is inadequate to model runoff response there.
(Pool and others, 2010). Possible future effects of groundwater          Goodrich and others (1997) observed that as semiarid
withdrawal on base flow derived from groundwater discharge         watershed scale increases, runoff response becomes even more
near Winslow are indeterminate, as are natural variations in       nonlinear because of the increasing importance of ephemeral
recharge. A recent monitoring study on Chevelon and Clear          channel losses and partial storm-area coverage. Runoff volume
Creeks was too brief to observe base-flow trends in these          markedly diminishes as the flood hydrograph progresses
tributaries (Brown and Macy, 2012).                                downstream between the streamflow-gaging stations near Win-
                                                                   slow and Cameron on the Little Colorado River, a distance of
                                                                   ~170 km. Losses from the flood hydrograph through infiltra-
Hydroclimate                                                       tion resulted in a downstream reduction in flow volume of
                                                                   14,580 ft3 for a single winter-storm event, a transmission loss
      Whereas climate change is a substantial and inexorable       of 38 percent between the streamflow gages (Block and Red-
alteration of a region’s average climatic conditions–temperature   steer, 2011), confirming that even synoptic storms of greater
4   Historical Channel-Planform Change of the Little Colorado River near Winslow, Arizona

areal extent than monsoons produce disparate flood hydro-           occurred under wet conditions and alluviation occurred under
graphs in the Little Colorado River Basin.                          dry conditions. Moreover, Hereford emphasized a climatic
                                                                    association with the mode of flood-plain construction until a
                                                                    geomorphic threshold, the elevation of the flood plain, was
Vegetation                                                          reached—the same process that Wolman and Leopold (1957)
                                                                    described in their treatise on flood-plain formation—whereby
      Flood-plain vegetation in the study area (fig. 1) has
                                                                    the flood-plain surface can become a terrace only by tectonic
changed strikingly over the historical record. The first writ-
                                                                    or climatic change that alters the regimen of the river. Her-
ten observations of the Little Colorado River were by 16th-
                                                                    eford suggested that overbank or vertical accretion was suc-
century Spanish explorers, who described “a fine, beautiful,
                                                                    ceeded by within-channel or lateral accretion in 1980, when a
and selected river almost as large as the Del Norte [Rio
                                                                    threshold flood-plain elevation was reached and high flows no
Grande], containing many groves of poplars [cottonwoods]
                                                                    longer overtopped channel banks.
and willows” (Luxan, 1583). When Capt. Lorenzo Sitgreaves
                                                                          Huckleberry (1996) mapped surficial deposits along the
explored the area in 1851, his party encountered extensive and
                                                                    leveed reach of the Little Colorado River at Winslow as a
often-impassable swamplands above Winslow (Sitgreaves,
                                                                    means to assess the recent aggradational history of the area,
1853). Two years later, A.W. Whipple’s expedition followed
                                                                    with implications for a levee breach that had occurred in 1993.
a parallel course. At the junction of Diablo Canyon (near
                                                                    He concluded that overall, aggradation was negligible in the
Leupp), Whipple (1856) wrote of thick groves of cottonwoods.
                                                                    leveed reach in the recent past (~1975–95), and noted that
He also remarked upon the river in the vicinity of Winslow
                                                                    aggradation was spatially limited by the elevation of alluvial
as a “net-work of channels, all bordered with alamos [cotton-
                                                                    deposits and by distance from the main channel. He also
woods]” (p. 76).
                                                                    determined that the older deposits were stabilized sufficiently
      By the 1930s, most native vegetation had disappeared:
                                                                    by vegetation and would resist erosion other than by “extraor-
“The willows have departed, and only a few gnarled cotton-
                                                                    dinary flood events.”All of his mapped alluvial surfaces were
woods remain of the once-extensive groves. The surround-
                                                                    deposited within the historical record.
ing hills that once bore a good stand of grama grass are now
                                                                          The Bureau of Reclamation (2003) conducted a geomor-
covered with a desert pavement of polished pebbles” (Colton,
                                                                    phic analysis, complemented by hydraulic and sediment-trans-
1937). In the 1930s, tamarisk, a native shrub of Eurasia, began
                                                                    port modeling, of the Little Colorado River between Holbrook
to noticeably colonize the southwestern flood plains (Robin-
                                                                    and Winslow (fig. 1), including the leveed reach. Using an
son, 1965). Although no systematic comparison of vegeta-
                                                                    assumed channel-forming flow rate of 5000 ft3/s, they cal-
tion was made in this study, the spread of tamarisk on the
                                                                    culated stable channel geometries for various suspended-
Little Colorado River flood plain is chronicled through aerial
                                                                    sediment concentrations and concluded that the geometry of
photography. Historical meander scars were rapidly colonized
                                                                    the river is well characterized by their model and thus that
by tamarisk. Currently, willows are supplanting tamarisk on
                                                                    the river is currently (2003) in a slightly degraded, but stable,
aggrading channel reaches in the study area (fig. 1).
                                                                    condition. They defined “stability” solely as the equivalence
                                                                    of the river’s transport capacity to the incoming sediment load.
Previous Work                                                       The general conclusion of their study is that future sediment
                                                                    aggradation will be insignificant.
      Hack (1942) applied the theory of climatic terraces to
the valleys of western Navajo and Hopi country. He divided
the alluvium of the Tusayan Washes, from Black Mesa to the
Little Colorado River (fig. 1), into three periods of deposition,   Methods
each preceded by a period of accelerated erosion. The alternat-
ing periods of deposition and erosion, Hack argued, resulted
from minor changes in stream gradient, which, in turn,              Hydroclimatic Analysis
resulted from climatic change. During periods of deposition
the grade was flattened and climatic conditions were wetter;              U.S. Geological Survey (USGS) streamflow-gaging
during periods of erosion the grade was steepened and climatic      stations on the Little Colorado River and its tributaries have
conditions were drier. Hack further suggested that the “epi-        provided discharge data intermittently since 1905. The stream-
cycles of erosion” were regionally contemporaneous.                 flow data used in this report are from the following main-stem
      Hereford (1984) analyzed the influence of climate on the      gages on the Little Colorado River: at Grand Falls (09401000),
geomorphology and alluvial stratigraphy of the Little Colo-         near Cameron (09402000), and near Winslow (09400350)
rado River in narrow bedrock-canyon reaches from Tolchico           (fig. 2). The period of record for the gage at Grand Falls
to Cameron. A time-stratigraphic analysis showed synchro-           began in November 1925; daily discharge data were recorded
nous deposition throughout his study area, which supports, as       through 1949 and intermittently between 1950 and 1995, after
Hack (1942) posited, regional climatic control over sedimen-        which the gage was discontinued. The gage near Cameron has
tation. In contrast to Hack, Hereford determined that erosion       been in continual operation since June 1947, and the gage near
400                                                                                                                              400                                                       400
                                                                         1948−2012        Cameron                                                                                                         2003−12     Cameron                                       2003−12       Winslow
                                                                   300                    09402000                                                                                                  300               09402000                                300                  09400350

                                                                   200                                                                                                                              200                                                       200

                                                                   100                                                                                                                              100                                                       100

           in cubic feet per second
                                                                                                                                                                                                                                  in cubic feet per second

                                                                                                                                                                         in cubic feet per second

          Median monthly discharge,
                                                                                                                                                                                                                                 Median monthly discharge,

                                                                                                                                                                        Median monthly discharge,
                                                                     0                                                                                                                                0                                                         0

                                                                                                                                                                                                          F
                                                                                                                                                                                                                                                                    F

                                                                                                                                                                                                          O
                                                                                                                                                                                                                                                                    O

                                                                         M

                                                                         Fe
                                                                                                                                                                                                           e
                                                                                                                                                                                                                                                                     e

                                                                         Ja
                                                                         Ju
                                                                         Ju
                                                                         Se
                                                                                                                                                                                                          Ja
                                                                                                                                                                                                          Ju
                                                                                                                                                                                                          Ju
                                                                                                                                                                                                                                                                    Ja
                                                                                                                                                                                                                                                                    Ju
                                                                                                                                                                                                                                                                    Ju

                                                                                                                                                                                                          Se
                                                                                                                                                                                                                                                                    Se

                                                                         Oc
                                                                         De
                                                                         Ap
                                                                         Au
                                                                                                                                                                                                            c
                                                                                                                                                                                                          De
                                                                                                                                                                                                          Ap
                                                                                                                                                                                                          Au
                                                                                                                                                                                                                                                                      c
                                                                                                                                                                                                                                                                    De
                                                                                                                                                                                                                                                                    Ap
                                                                                                                                                                                                                                                                    Au

                                                                         No
                                                                            l
                                                                                                                                                                                                          No
                                                                                                                                                                                                                                                                    No

                                                                                                                                                                                                             l
                                                                                                                                                                                                                                                                       l

                                                                         Ma
                                                                           a
                                                                                                                                                                                                          Ma
                                                                                                                                                                                                          Ma
                                                                                                                                                                                                                                                                    Ma
                                                                                                                                                                                                                                                                    Ma

                                                                             t
                                                                                                                                                                                                              t
                                                                                                                                                                                                                                                                        t

                                                                             r

                                                                            b
                                                                            n
                                                                                                                                                                                                              r
                                                                                                                                                                                                                                                                        r

                                                                                                                                                                                                             b
                                                                                                                                                                                                                                                                       b

                                                                            n
                                                                                                                                                                                                             n
                                                                                                                                                                                                                                                                       n

                                                                            p
                                                                             g
                                                                                                                                                                                                             p
                                                                                                                                                                                                                                                                       p

                                                                             v
                                                                             c
                                                                                                                                                                                                                                                                        g

                                                                              r
                                                                                                                                                                                                              v
                                                                                                                                                                                                              c
                                                                                                                                                                                                              g
                                                                                                                                                                                                                                                                        v
                                                                                                                                                                                                                                                                        c

                                                                                                                                                                                                               r
                                                                                                                                                                                                                                                                         r

                                                                              y
                                                                                                                                                                                                               y
                                                                                                                                                                                                                                                                         y
                                                                                                                                                                                                                                                              400
                                                                   900
                                                                                                                                                                                                                                                                    2005−12   Holbrook
                                                                         1927−49        Grand Falls
                                                                                                                                                                                                                                                              300              09397000
                                                                   800                    09401000

                                                                   700                                                                                                                                                                                        200

                                                                   600                                                                                                                                                                                        100

                                                                                                                                                                                                                                   in cubic feet per second
                                                                                                                                                                                                                                  Median monthly discharge,
                                                                   500                                     Cameron                                                                                                                                              0
                                                                                                          !
                                                                                                                                                                                                                                                                    M

                                                                                                                                                                                                                                                                    Fe
                                                                                                                                                                                                                                                                    Ja
                                                                                                                                                                                                                                                                    Ju
                                                                                                                                                                                                                                                                    Ju
                                                                                                                                                                                                                                                                    Se

                                                                                                                                                                                                                                                                    Oc
                                                                                                                                                                                                                                                                    De
                                                                                                                                                                                                                                                                    Ap
                                                                                                                                                                                                                                                                    Au

                                                                                                                                                                                                                                                                    No
                                                                                                                                                                                                                                                                       l

                                                                                                                                                                                                                                                                    Ma
                                                                                                                                                                                                                                                                      a

                                                                                                                                                                                                                                                                        t
                                                                                                                                                                                                                                                                        r

                                                                                                                                                                                                                                                                       b
                                                                                                                                                                                                                                                                       n

                                                                                                                                                                                                                                                                       n
                                                                                                                                                                                                                                                                       p
                                                                                                                                                                                                                                                                        g

                                                                                                                                                                                                                                                                        v
                                                                                                                                                                                                                                                                        c
                                                                                                                                                                                                                                                                         r
                                                                                                                                                                                                                                                                         y

                                                                                                      09402000
                                                                   400

                                                                   300

                                                                   200
                                                                                                                                      Lit
                                                                                                                                         tle
                                                                   100                                                ! Grand Falls                          Co

              Median monthly discharge, in cubic feet per second
                                                                                                                 09401000                                       lor
                                                                     0
                                                                                                                                                                   ad

                                                                         M

                                                                         Fe
                                                                         Ja
                                                                         Ju
                                                                         Ju
                                                                         Se

                                                                         Oc
                                                                         De
                                                                         Ap
                                                                         Au

                                                                         No
                                                                            l
                                                                                                                                                                      o

                                                                         Ma
                                                                           a

                                                                             t
                                                                             r

                                                                            b
                                                                            n

                                                                            n
                                                                            p
                                                                             g

                                                                             v
                                                                             c
                                                                              r
                                                                              y
                                                                   400
                                                                                                                                                                                                    Riv
                                                                         1936−82        Clear Creek
                                                                                                                                                                                                          er
                                                                                                                                   09400350 ! Winslow
                                                                   300                     09399000                                09399000 !
                                                                                                                                                         !              !
                                                                                                                                                                              Holbrook

                                                                                                                                     ek
                                                                                                                                       e                     09398000
                                                                   200                                                            r Cr

                                                                                                                               a
                                                                                                                                                                   09397000

                                                                                                                            Cle
                                                                                                                                                       eek
                                                                   100

                                                                                                                                                 Cr

         in cubic feet per second
        Median monthly discharge,
                                                                                                                                                elon
                                                                     0

                                                                         M

                                                                         Fe
                                                                         Ja
                                                                         Ju
                                                                         Ju
                                                                         Se

                                                                         Oc
                                                                         De
                                                                         Ap
                                                                         Au

                                                                         No
                                                                            l

                                                                         Ma
                                                                           a

                                                                             t
                                                                             r

                                                                            b
                                                                            n

                                                                            n
                                                                            p
                                                                             g

                                                                             v
                                                                             c
                                                                              r
                                                                              y
                                                                                                                                           Chev
                                                                   400
                                                                         1936−72     Chevelon Creek
                                                                   300                     09398000

                                                                   200
                                                                                                                              0               15              30                                      62 MILES
                                                                   100
                                                                                                                              0               25              50

         in cubic feet per second
                                                                                                                                                                                                     100 KILOMETERS

        Median monthly discharge,
                                                                     0

                                                                         M

                                                                         Fe
                                                                         Ja
                                                                         Ju
                                                                         Ju
                                                                         Se

                                                                         Oc
                                                                         De
                                                                         Ap
                                                                         Au

                                                                         No
                                                                            l

                                                                         Ma
                                                                           a

                                                                             t
                                                                             r

                                                                            b
                                                                            n

                                                                            n
                                                                            p
                                                                             g

                                                                             v
                                                                             c
                                                                              r
                                                                              y
Figure 2. Little Colorado River Basin, showing locations of streamflow-gaging stations (black dots), with associated hydrographs for continuous periods of record and plots
of bimodal precipitation runoff patterns observed for gages at Winslow, Grand Falls, and Cameron; snowmelt discharge peak for tributaries Clear and Chevelon Creeks; and a
monsoonal discharge peak for gage at Holbrook. Study reach is contained within the white box.
                                                                                                                                                                                                                                                                                              Methods  5
6   Historical Channel-Planform Change of the Little Colorado River near Winslow, Arizona

Winslow began recording data in December 2001. Aside from             scale. Aerial photographs from 1997, 2007, and 2010 were
the one near Winslow, the main-stem gage nearest the study            acquired as digital orthophotos, corrected for camera-tilt and
reach (fig. 1) is at Holbrook (09397000), ~55 km upstream of          terrain-relief distortion, with a 1-m ground sample distance
the study area. Data from this gage, however, show a seasonal         (GSD). The 1997 digital orthophoto quadrangles (DOQs)
discharge pattern that differs from those at the downstream           were used as the base or reference layer for all georeferenced
gages, and so are not a good proxy for the discharge down-            imagery. The GSD of each digital aerial photograph, calcu-
stream (fig. 2). Discharge data from streamflow-gaging sta-           lated from the original photographic scale and the scanning
tions on two tributaries to the Little Colorado River were also       resolution, is less than the 1-m GSD of the DOQ to which it
used in this report: on Clear Creek near Winslow (09399000)           was georeferenced.
and on Chevelon Creek near Winslow (09398000) (fig. 2),                     The number and distribution of GCPs used for geo-
both of which were in operation for varying periods of record         rectification varied; from 10 to 35 GCPs were used on each
beginning in 1905 but have since been discontinued.                   scanned aerial photograph for georectification to the 1997
      Because the discharge record for the streamflow-gaging          DOQs. The GCPs used are overwhelmingly soft edged and
station near Winslow is brief, and interstation runoff volumes        near to the ground because the study area (fig. 1) is a largely
are not directly correlative, an analysis of local temperature        undeveloped, minimally vegetated, low-relief flood plain.
and precipitation was undertaken to test for hydroclimatic            Because many of the features used as GCPs were eradicated
trends, using observations collected over a period of 98 years        by subsequent landscape change, GCPs could not be stan-
at a meteorological station in Winslow. Hydroclimatic data            dardized and some of the images required coregistration to
were analyzed by using the RStudio software, with R functions         previously georectified images. The GCPs selected in this
from the packages “Kendall” and “zyp.” A nonparametric                study are also concentrated near the river channel rather than
Mann-Kendall test allows for departures from normal distri-           distributed throughout the image, to minimize distortion in
bution and is based on rank correlation (Helsel and Hirsch,           the area of interest.
2002). Kendall’s rank-correlation coefficient τ is used to test             A second-order-polynomial transformation with a
for any monotonic dependence of Y (temperature, precipita-            least-squares-fitting algorithm was used for spatial registra-
tion, and discharge) on X (time). Kendall’s coefficient signi-        tion. Residual errors generated by the transformation are the
fies the correlation, or strength of association, between two         distance between the transformed location of the GCP and
continuous variables and is resistant to the effect of outliers.      the actual map-coordinate (x,y) location. The aggregate error
For time-series data, the significance of this correlation is that    for each image is the square root of the mean of squares of
it indicates the probability that the trend differs from the mean.    the residuals for each GCP and map-coordinate pair. Regis-
The hypothesis that Y depends on X is confirmed by two-sided          tration-error margins for georeferenced imagery depend on
p-values
Methods  7

Table 1.     Aerial photographs used in channel analysis of Little Colorado River near Winslow, Ariz.
[Total positional error calculated as the square root of the sum of the squares of the source registration error (1.2 m), the transformation registration error, and an
assumed digitizing error (3 m)1. For digitally orthorectifed photographs (1997), range of root-mean-square (rms) error is from the imagery header. For digitally
orthorectified photographs (2007 and 2010), average rms error is the error stated by the U.S. Department of Agriculture (USDA); for 2007 photographs error is
the accuracy specifications maximum; for 2010 photographs error is regional registration maximum from Geospatial Services Branch of the USDA.]

                                                                                                      Range of         Average
                                                                                                                                        Transform          Total
                                                                                                     root-mean-       root-mean-
               Photograph                                                                                                                 error +        positional
      Year                       Roll or quadrant                 Source                 Scale         square           square
                  date                                                                                                                 source error        error
                                                                                                        error            error
                                                                                                                                            (m)             (m)
                                                                                                         (m)              (m)

 1936         10/9/1936        --                       Soil Conservation              1:62,500       1.38–7.53           4.42             5.62              6.4
                                                          Service
 1953         9/11/1953        --                       U.S. Geological Survey         1:37,400       0.35–2.72           1.20             2.40              3.8

 1979–80 8/22/1979             --                       U.S. Geological Survey         1:24,000       0.21–0.97           0.65             1.85              3.5
         10/3/1980                                                                     1:30,000       0.62–1.25           0.95             2.15              3.7

 1992         4/28/1992        5144                     U.S. Geological Survey         1:40,000       0.37–1.71           0.94             2.14              3.7
              4/28/1992        5225                     National Aerial
              9/22/1992        5240                       Photography
                                                          Program
 1997         6/22/1997        9828                     U.S. Geological Survey         1 m GSD        0.55–2.50           1.20               --              3.2
              6/26/1997        9834                     National Aerial                 (ground
              6/27/1997        9836                       Photography                    sample
              10/16/1997       9845                       Program                      distance)
 2007         6/7/2007         3511041                  U.S. Department of             1 m GSD             --             5.00               --              5.8
              6/18/2007        3511042SW                  Agriculture
              6/19/2007        3511042SE                National Agriculture
              6/07/2007        3511050SW                  Imagery Program
              6/19/2007        3511050NW
              6/07/2007        3511051
              6/07/2007        3511059
 2010         6/26/2010        3511041SE    U.S. Department of                         1 m GSD             --             3.09               --              4.3
              6/26/2010        3511042        Agriculture
              6/26/2010        3511050      National Agriculture
              6/26/2010        3511051NW&SW   Imagery Program
              6/27/2010        3511041NW&SE
              6/29/2010        3511051NE&SE
              6/29/2010        3511059
  1
   Method follows Hapke and Reid (2007)

      Additional error is introduced during digitization of                          the sum of squares of the averaged rms error and the digitiz-
channel boundaries. To assess this error, Downward and others                        ing error. Total positional error for the georeferenced imagery
(1994) constructed a simple test of redigitizing the same chan-                      included an additional source-registration error of 1.2 m in
nel boundary position 50 times and looked at the frequency                           the calculation, which is the average rms error for the base
distribution of line displacement. By analyzing the variation in                     imagery (1997 DOQs) to which the scans were georeferenced
digitizing error, they established a value for channel-boundary                      (table 1).
disagreement required to identify actual channel movement                                  During onscreen digitization of channel boundaries
in their data. Their investigation established that the valid-                       in this study, the active channel was defined where banks
ity of quantified change requires that the sum of inherent and                       are clearly visible, or at abrupt linear changes in vegetation
introduced spatial error be lower than the amount of change                          density that locally parallel the thalweg. On point bars with
measured. A 3-m digitizing error, based on buffer analysis in                        distinctly stepped profiles, the channel boundary is defined by
ArcGIS, is assumed for this study.                                                   the topographic break of the uppermost tier where the concen-
      Total positional error for the change-detection margin                         tration of vegetation exceeds 10 percent by visual estimation.
on orthorectified imagery is calculated as the square root of                        Channel boundaries are drawn to reflect ongoing geomorphic
8   Historical Channel-Planform Change of the Little Colorado River near Winslow, Arizona

processes independent of flow conditions on the date of the        during February–May at Grand Falls, more than half of which
aerial photograph, and so are an approximation of bankfull         occurred in April. For the period of record of the streamflow-
stage.                                                             gaging station near Cameron, which begins in 1948, 51 per-
      Channel centerlines were generated from Thiessen             cent of total annual discharge occurs during February to May.
polygons defined by points located at 1-m intervals along the      When the discharge record of the gage near Cameron is exam-
digitized channel banks and islands (see “ET GeoWizards            ined for the period equivalent to the 21st-century discharge
function Build Thiessen Polygons,” http://www.ian-ko.com/).        record of the gage near Winslow (2003–12), the percentage of
Channel width was calculated at 20-m intervals, perpendicular      discharge occurring during February–May has declined to
to the centerline for each respective time slice. At meander       36 percent of the total annual discharge, with the great-
bends where a centerline orthogonal projected parallel to          est reduction occurring in April (fig. 2). Discharge records
streamflow direction, transects were adjusted to accommodate       indicate changes in runoff timing that reflect earlier-onset
channel curvature. Average widths were calculated by dividing      snowmelt.
the channel area by the length of its centerline, and agree with         Peak-discharge measurements show declining trends at
the widths calculated by digital transect.                         both the streamflow-gaging stations at Grand Falls and near
      Channel-migration distances were calculated at 10-m          Cameron (fig. 3). For the 34-year period of record (1926–59)
intervals between successive centerlines (see “ET GeoWizards       of peak streamflow measurements from the gage at Grand
function Point Distance,” http://www.ian-ko.com/). The ET          Falls, and the 66-year record (1947–2012) of peak-streamflow
GeoWizards tool measures the distance from points located at       measurements from the gage near Cameron, statistically sig-
intervals on a centerline to the closest point along the subse-    nificant downward trends occur in peak discharge at the rates
quent channel centerline. Median centerline migration was cal-     of -262.5 ft3/s per year and -72.5 ft3/s per year, respectively.
culated from the resulting distances. Distances were normal-             Declines in peak discharge coincide with an increase in
ized as a percentage of the total distance to indicate relative    average daily minimum temperature and a decrease in annual
degree of channel movement.                                        precipitation (fig. 3). Monotonic trends in mean daily mini-
                                                                   mum air temperature (Tmin), annual precipitation (Pann), and
                                                                   monsoon-seasonal (July–September) precipitation (Pjas) are
                                                                   indicated by the nonparametric Thiel-Sen slope. The rate of
Results                                                            change in Tmin for the period 1915–2012 is +0.02 °F annually,
                                                                   equivalent to an increase of 1.5 °F over the 98-year record of
                                                                   observation (fig. 3). The rate of change in precipitation for the
Hydroclimatic Change                                               period 1915–2012 is -0.513 mm/yr for the annual time series
                                                                   and -0.415 mm/yr for the monsoon-season time series.
      Median monthly hydrographs show seasonal discharge on
the Little Colorado River in response to regional precipitation
patterns (fig. 2). For the periods 1927–49 at Grand Falls and      Channel-Planform Adjustment
1948–2012 near Cameron, the median of mean monthly dis-
charge shows a bimodal distribution, with maximum discharge              The Little Colorado River meandered for 69 km between
occurring during spring snowmelt and a second discharge peak       Winslow and Leupp in 1936, a straight-line distance of only
occurring during the monsoon season (July–September). The          48 km (fig. 1). The river currently (2010) meanders for 91 km
shorter-term record near Winslow (2003–12) shows a compa-          between the same two points. At the upstream end of the study
rable pattern, again with maximum discharge occurring during       reach, near the Interstate Highway 40 and railroad bridges at
the months of snowmelt runoff.                                     Winslow, the river has moved only marginally during the span
      Snowmelt runoff in the study reach of the Little Colorado    of the aerial-photographic record. Engineering projects have
River (fig. 1) is produced primarily through input from Clear      restrained the channel since at least 1936 at Winslow, with
and Chevelon Creeks, with >600 m of relief between their           periodic dredging. The channel also was largely stable for the
headwaters and the confluences with the main stem. Run-            study period at the downstream end of the study reach, north-
off during February–May is ~98 percent of the total annual         west of Old Leupp, aside from a cutoff that occurred between
streamflow at Clear Creek for the continuous period of record      1936 and 1953 (pl. 2). There, the river flows in a strike valley
(1936–82) at that gage, and ~85 percent of the total annual        of the very shallowly dipping Moenkopi Formation, which
streamflow at Chevelon Creek for the continuous period of          crops out directly southwest of the channel and in the riverbed
record (1936–72) at that gage.                                     beneath the Navajo Highway 15 bridge at Leupp. Yet overall,
      For the main stem of the Little Colorado River, the          as the Little Colorado River migrated across its flood plain, it
earliest relevant record of continuous daily discharge mea-        has become narrower, longer, and more sinuous.
surements is from the streamflow-gaging station at Grand                 Lateral migration and deposition of sediment resulted in
Falls (1927–49), where runoff was at a historical maximum          increasing flood-plain construction over the historical record.
during the month of April. During the continuous period of         As the Little Colorado River migrated laterally, the total
record, 67 percent of the total annual streamflow occurred         active-channel area decreased progressively from 1936 to
Results  9

                                                     Little Colorado River at Grand Falls, AZ (09401000)                                                                                                       Little Colorado River near Cameron, AZ (09402000)
                                                                   Annual Peak Discharge                                                                                                                                     Annual Peak Discharge

                                                                                                                                                        Peak discharge, in cubic feet per second
                                                                         1926-1959                                                                                                                                                  1947-2012
Peak discharge, in cubic feet per second

                                                                                                                                                                                             25,000
                                     50,000      A                                                                            2-sided p-value =                                                            B                                         2-sided p-value =
                                                                                                                              0.016325                                                                                                               0.001725
                                                                                                                              Sen’s slope = -262.5                                                                                                   Sen’s slope = -72.5

                                     30,000                                                                                                                                                  15,000

                                     10,000                                                                                                                                                        5,000

                                                        1930    1935     1940              1945                              1950       1955                                                               1950       1960       1970      1980   1990         2000        2010

                                                                Winslow WSO AP (029439)                                                                                                                                   Winslow WSO AP (029439)
                                                                  Annual Precipitation                                                                                                                                   Monsoon Season Precipitation
                                                                       1915-2012                                                                                                                                                 1915-2012
                                                 C                                                                                                                                                         D
Precipitation, in millimeters

                                                                                                                                                        Precipitation, in millimeters
                                                                                                                              2-sided p-value =                                                     250                                                  2-sided p-value =
                                           400                                                                                0.002123                                                                                                                   0.001725
                                                                                                                              Sen’s slope = -0.513483                                                                                                    Sen’s slope = -0.414706

                                           300
                                                                                                                                                                                                    150

                                           200

                                                                                                                                                                                                     50
                                           100

                                                 1920           1940        1960                                         1980            2000                                                              1920           1940          1960      1980             2000

                                                                                                                                           Winslow WSO AP (029439)
                                                                                                                                 Yearly Average of Daily Minimum Temperature
                                                                                                                                                   1915-2012
                                                                                                                             E
                                                                                   Average minimum temperature, in °F

                                                                                                                        42

                                                                                                                        40

                                                                                                                        38
                                                                                                                                                                                                                      2-sided p-value =
                                                                                                                                                                                                                      0.001541
                                                                                                                                                                                                                      Sen’s slope = 0.015385
                                                                                                                        36
                                                                                                                                1920            1940                                               1960           1980           2000

    Figure 3. Monotonic trends in hydroclimatic data for the study area near Winslow, Ariz. (fig. 1). Solid line is Thiel-Sen slope; dashed
    line is LOWESS, which represents relation between variables as a nonlinear regression. A, Decline in peak discharge more rapid before
    1940. B, Steady decline in peak discharge begins after 1973 flood. C, Greater decline in annual precipitation after 1980. D, Steady decline
    in monsoon-seasonal precipitation parallels Sen’s slope. E, Steady increase in daily minimum temperature until 1960, when fluctuation in
    yearly average flattens trend.
10   Historical Channel-Planform Change of the Little Colorado River near Winslow, Arizona

   2010 (fig. 4). The river occupied >26 km2 of surface area in                                                                    from 381 m in 1936 to 33 m in 2010, has occurred, a reduction
   1936, when it flowed in a broad, largely unvegetated chan-                                                                      of >90 percent (fig. 5). Over the study period, the progres-
   nel through the study reach from Winslow to Leupp. By                                                                           sive decrease in channel width reversed once, in 1997, in the
   1953, more than half of the 1936 channel had been filled with                                                                   aftermath of anomalous flood conditions that occurred in 1993.
   sediment, while 35 percent of the active channel was newly                                                                      Despite a large flood in 2004, the river channel resumed narrow-
   eroded. By 2010, only ~4 percent of the active channel inter-                                                                   ing, as indicated by width measurements from 2007
   sected the 1936 channel. The percentage of the 1936 channel                                                                     (fig. 5). Another significant flood occurred in 2008, when the
   that was occupied decreased as the surface area occupied by                                                                     lateral extent of overbank flow exceeded 3 km, but the channel
   the river shrank. By 2010, the river occupied just 3 km2 of                                                                     was still narrower in 2010 (fig. 5).
   surface area and flowed through extensive stands of tamarisk.                                                                         Median centerline migration correlates positively with
         Progressive channel narrowing has accompanied the                                                                         decreasing channel width (fig. 6). The cumulative migra-
   process of lateral migration. Although the magnitude of the                                                                     tion curve for the period 1936–53 shows a relatively steady
   change in channel width varies throughout the study area (fig.                                                                  progression of lateral movement throughout the study reach
   1) for each time interval, an overall decrease in average width,                                                                (figs. 1, 7). The cumulative curve for the period 1953–79 also
Channel surface area, in square kilometers

                                                                                                                                      Year       Active Newly Extent of       Extent of Extent of Extent of
                                                                                                                                                channel eroded    1936          1936       1936      1936
                                             25
                                                                                                                        ••                      surface channel channel       channel    channel   channel
                                                                                                        • •                                       area   area   occupied    filled with occupied filled with
                                             20                                               •                                                  (km2)   (km2)   by river
                                                                                                                                                                  (km2)
                                                                                                                                                                             sediment
                                                                                                                                                                                (km2)
                                                                                                                                                                                         by river
                                                                                                                                                                                           (%)
                                                                                                                                                                                                  sediment
                                                                                                                                                                                                      (%)

                                             15                                                                                      1936        26.1       —      —           —          —           —
                                                                       •                                                             1953        18.8      6.7    12.1        14.0        46.5      53.5
                                             10                                                                                      1979        11.2      5.8      5.4       20.7        20.8      79.2
                                                                                                                                     1992         6.3      3.5      2.8       23.3        10.8      89.2
                                             5
                                                                                                                                     1997         7.4      4.1      3.2       22.9        12.4      87.6
                                                                                                                                     2007         3.3      1.9      1.4       24.8           5.2    94.8
                                             0     •                                                                                 2010         3.0      1.9      1.2       24.9           4.5    95.5
                                                  1936

                                                                      1953

                                                                                              1979

                                                                                                       1992
                                                                                                              1997

                                                                                                                       2007
                                                                                                                       2010

                                                                                       Year

                                                            Active channel area                                      1936 channel area
                                                                 Newly eroded channel course                    •      Deposits of lateral accretion
                                                                 Channel course occupied in 1936

    Figure 4. Decreasing active channel area divided into segments that were either newly eroded or overlapped 1936 channel course.
    As active channel migrated laterally, sedimentation progressively increased in 1936 channel by lateral accretion. Disruption of trends in
    1997 was likely due to significant and sustained flooding during January and February 1993.

                                                      ●
                                                                                                                                         Year        Average     Annualized      Width of prior    Width of
Average channel width, in meters

                                                                                                                                                     channel      change          measured           1936
                                                                                                                                                      width        (m/yr)          channel         channel
                                             300                                                                                                       (m)                           (%)             (%)
                                                                        ●                                                              1936             380.6        —                —               —
                                                                                                                                       1953             254.6       -7.4              66.9           66.9
                                             200
                                                                                                                                       1979             129.0       -4.8              50.7           33.9
                                                                                               ●                                       1992              70.9       -4.5              55.0           18.6
                                             100                                                                                       1997              87.5       +3.3             123.3           23.0
                                                                                                               ●
                                                                                                        ●                              2007              36.7       -5.1              42.0            9.7
                                                                                                                        ● ●
                                                                                                                                       2010              33.2       -1.2              90.4            8.7
                                                  0
                                                          1940      1950     1960    1970      1980   1990      2000     2010

    Figure 5. Average active channel width. Disruption of trend in 1997 was likely due to significant and sustained flooding during
    January and February 1993.
Results  11

                                                                                                                               140                                                                                                140

                                                                                                                                                                                                                                        Median centerline migration, in meters
                                                  Time           Maximum                 Median             Annualized
                                                 frame           centerline             centerline          migration          120                                                                                                120
                                                  (yrs)          migration              migration              rate                         •
                                                                    (m)                    (m)                (m/yr)           100                                                                                                100

                  1936–1953                                        664.7                     112.3              6.6            80
                                                                                                                                                                             •                                                    80

                  1953–1979                                        836.4                      75.8              2.9            60                                                                                                 60
                  1979–1992                                       1616.9                      38.8              3.0                         y = 0.4795x - 4.666
                                                                                                                                                  r = 0.95
                  1992−1997                                       1932.3                      18.5              3.7            40
                                                                                                                                                                                                      •                           40

                  1997–2007                                        226.5                      16.0              1.6
                  2007–2010                                        141.6                       4.0              1.3
                                                                                                                               20
                                                                                                                                                                                             •                •                   20

                                                                                                                                 300         250            200        150           100                   50
                                                                                                                                                                                                              •               0
                                                                                                                                                                                                                                  0

                                                                                                                                                       Average channel width, in meters

    Figure 6. Centerline migration distances and annualized migration rates for the Little Colorado River near Winslow, Ariz. for time
    frames corresponding to aerial photography. Gray box indicates maximum distance for channel relocation after avulsion. Annualized
    migration rates are reach averaged and based on median to minimize effect of abrupt channel changes. A decreasing trend is evident,
    except during periods of avulsion. A significant positive correlation exists between channel width (see fig. 5) and median centerline
    migration distance.

                                                 1,600
                                                                                                                                                                                               EXPLANATION
                                                                                                                                                                                   Cumulative Centerline Regression
                                                                                                                                                                                    migration  length       line
                                                 1,400                                                                                                                               curve      (km)       slope

                                                                                                                                                                                             1936−53           69             14.0
                                                                                                                                                                                             1953−79           74             13.9
                                                 1,200                                                                                                                                       1979−92           87             —
Cumulative centerline migration, in kilometers

                                                                                                                                                                                             1992−97           88             —
                                                                                                                                                N IO

                                                                                                                                                                                             1997−07           80                 2.8
                                                                                                                                            AVULS

                                                                                                                                                                                             2007−10           89                 0.7
                                                 1,000
                                                                                              F
                                                                                             CUTOF

                                                                                                                                                                                   300
                                                                                                                                                                                             1997–2007
                                                                                                                                                                                   250

                                                  800                                                                                                                              200

                                                                                                                                                                                   150
                                                                                                                                 FFO
                                                                                                                               CUT

                                                                                                                                                                                   100

                                                  600                                                                                                                              50
                                                                      N  IO

                                                                                                                                                                                    0
                                                                   AVULS

                                                                                                                                                                                         0       20       40        60   80             100

                                                                                                                                                                                   300
                                                  400
                                                                                                                                                                                             2007–10
                                                                                                                                                                                   250

                                                                                                                                                                                   200

                                                                                                                                                                                   150
                                                  200
                                                                                                                                                                                   100

                                                                                                                                                                                   50

                                                                                                                                                                                    0
                                                   0                                                                                                                                     0       20       40        60   80             100
                                                        0   10                20        30           40        50         60           70              80         90         100
                                                                                   Distance, in percent of total downstream centerline length

  Figure 7. Cumulative centerline migration versus distance along Little Colorado River near Winslow, Ariz. (fig. 1) showing where river
  was more or less prone to lateral migration. Centerline length is normalized to percentage of total. Steep slopes indicate abrupt change,
  such as cutoff or avulsion; moderate slopes indicate progressive meandering; and gentle slopes indicate minimal lateral migration. Inset
  graphs show cumulative curves at an enlarged scale for trend visibility.
12   Historical Channel-Planform Change of the Little Colorado River near Winslow, Arizona

shows a moderate meandering process with a regression-              ~13 cutoffs between 1953 and 1979, and ~20 cutoffs between
line slope (~14), comparable to the earlier time interval. In      1992 and 1997. Cutoffs tend to cluster because each occur-
contrast to the earlier curve, the cumulative curve for the        rence accelerates local system change (Stølum, 1996).
period 1953–79 shows more frequent and pronounced steps,                Measurements of channel-planform change in this study
indicating abrupt channel shifts or cutoffs; and the cumula-       exceed the sum of registration and digitization errors by
tive curve for the period 1979–92, shows a marked step             78–98 percent for each time step until 2007–10. Because of
trend with a conspicuous avulsion. Because the cumulative          the narrowness of the channel in 2010, the decrease in peak
curve for the period 1979–92 is decidedly nonlinear, a single      discharge, and the error margin for the imagery, the annualized
regression-line slope could not be fitted to it; the channel       average channel-migration rate is approximately equivalent
segment from ~15–55 percent of the downstream centerline           to the annualized error margin. However, 70 percent of the
distance is the only reach where moderate channel meander-         distance measurements are above the annualized error margin,
ing is occurring and has a slope of 6.5. The cumulative curve      and ~8 percent of the distance measurements show a lateral
for the period 1992–97 shows a stepped trend dominated by          migration of >25 m over the 3-year interval.
an avulsion and a major neck cutoff; the rest of the study
reach has a cumulative curve with minimal slope, indicating
minor lateral movement. The cumulative curve for the period
1997–2007 shows a steadily increasing slope at the scale of
                                                                   Discussion
the composite graph. An inset graph, scaled to accommodate
the reduced degree of lateral migration, shows distinct zones      Regional Hydroclimate
of activity (fig. 7). The initial ~40 percent of the channel has
a regression-line slope of 4.6, whereas the next 20 percent of           Climate projections are unequivocal in forecasting a
the channel has a regression-line slope of 0.98, the following     warmer and drier Southwest (Seagar and Vecchi, 2010).
30 percent of the channel has a regression-line slope of 3.5,      As concerns over water availability become more pressing,
and the last 10 percent of the channel has a regression-line       hydroclimatic trends and streamflow timing have been studied
slope of 0.75. The cumulative curve for the period 2007–10         extensively (for example, Stewart and others, 2005; Clow, 2009;
is similarly scaled on an inset graph for trend visibility         Vicuna and others, 2011; Hall and others, 2012). In the Western
(fig. 7). The initial 5 percent of the channel shows minimal       United States, regional storm-precipitation characteristics tend
activity, with a regression-line slope of 0.5. The next            toward a decrease in total mean storm precipitation and mean
~30 percent of the channel has a regression-line slope of 1.7      storm duration, with a concomitant increase in mean storm
and includes two small steps, and the rest of the channel has      intensity (Palecki and others, 2005). An increasing fraction of
a regression-line slope of 0.4. Cumulative centerline migra-       winter precipitation is also falling as rain rather than snow as the
tion curves correspond to the channel-migration-ratio map in       climate warms (Knowles and others, 2006). Yet the amount of
isolating where the Little Colorado River was more or less         effective precipitation decreases by ~50 mm for every 1 °C rise
mobile between 1936 and 2010 (fig. 8).                             in temperature in northeastern Arizona (Redsteer and others,
      Sinuosity of the Little Colorado River in the study area     2010). Measurements from 25 sites, including the Little Colo-
(fig. 1) increased from 1.4 in 1936 to 1.9 in 2010. During that    rado River Basin, show a decline in total mean annual snowfall
period, two major avulsions and numerous cutoffs occurred.         since 1931 (Redsteer and others, 2010). Lower snow accumula-
Localized sections of the study reach show high sinuosity          tions in winter mean less snowmelt runoff in spring, whereas
before avulsion, suggesting an apparent sinuosity threshold        higher temperatures are simultaneously causing an earlier
for avulsion. Sinuosity increased until an avulsion occurred,      onset of snowmelt (Stewart and others, 2005). An intensified
after which sinuosity initially decreased, but then increased      water cycle, owing to a warmer atmosphere, can paradoxically
again as the channel continued to narrow. Sinuosity was 2.6        heighten the likelihood of both drought and flooding.
and 2.4 for subreaches A and B, respectively, at or near the             General circulation models (GCMs) indicate that both dry
time of avulsion (fig. 9).                                         and wet extremes of the hydrologic cycle would be intensified
      The avulsion in subreach A occurred between 1979 and         as a result of rising temperatures. Extreme seasonal precipitation
1992, likely during the 1980 flood; the avulsion in subreach B     reversals have recently been observed in Arizona (Goodrich and
occurred between 1992 and 1997, likely during the 1993 flood.      Ellis, 2008). After the inception of a regional drought in 1996,
Before the channel avulsed to its new 4.8 km length, numer-        the historically dry winter of 2005-6 was preceded by record
ous cutoffs occurred in the ~10.5-km-long channel of subreach      precipitation in 2004-5. This anomalous wet-to-dry reversal has
A (distance measured from bifurcation to reattachment point).      affected the Little Colorado River Basin. The mean deviation
Although no significant cutoffs are evident on aerial photo-       of water year (WY) 2005 precipitation from the station average
graphs before the avulsion in subreach B, a meander-neck cut-      for climate division 2, which includes the Little Colorado River
off of ~1 km occurred nearly 2 km upstream of the bifurcation      Basin, was 566.5 mm. Three snow telemetry stations recorded
point. The avulsion in subreach B reduced the channel length       precipitation for WY 2005 (October 1, 2004 to September 30,
from 8.8 to 4.7 km. The two periods that encompass the 1978        2005) at 136 percent of the station average and 167 percent of
and 1993 floods show the most cutoffs in the study reach:          WY 2004 totals. Yet during the next winter, five of Arizona’s
You can also read