Historical Shoreline Change and Cultural Sites Kawela-Kahuku, O'ahu
←
→
Page content transcription
If your browser does not render page correctly, please read the page content below
Historical Shoreline Change and Cultural Sites
            Kawela-Kahuku, O‘ahu

 A THESIS SUBMITTED TO THE GLOBAL ENVIRONMENTAL SCIENCE
  UNDERGRADUATE DIVISION IN PARTIAL FULFILLMENT OF THE
             REQUIREMENTS FOR THE DEGREEE OF

                  BACHELOR OF SCIENCE

                             IN

             GLOBAL ENVIRONMENTAL SCIENCE

                        MAY 2010

                            By
                      Haunani H. Kane

                      Thesis Advisor
                     Charles H. Fletcher
I certify that this thesis, in our opinion, is satisfactory in
scope and quality as a thesis for the degree of Bachelor of
Science in Global Environmental Science.
Thesis Advisor
_____ ______________________________
Charles H. Fletcher
Department of Geology and Geophysics
iiAcknowledgements
Charles Fletcher provided support for me as an undergraduate researcher and
advised my senior thesis. Brad Romine taught me how to map shorelines, calculate rates,
and create my poster. Tiffany Anderson helped with understanding shoreline change rate
models. Matt Barbee helped with mapping issues. Neil Frazer, and Ayesha Genz helped
with matlab scripts. Jane Schoonmaker and the OCN 490 class provided their endless
support and critiques. Finally, thanks to OHA and SHPD for the cultural data, especially
Heidi Guth, Kai Markell, and Jason Jeremiah.
iiiAbstract
Hawaii’s beaches are a focus of modern lifestyle as well as cultural tradition.
Coastal erosion threatens areas that have served as burial grounds, home sites, and hold
other forms of cultural significance. To improve understanding of the convergence of
erosion patterns and historic uses, we mapped shoreline changes from Kawela Bay to
Kahuku Point. Shoreline change rates are calculated from historical photographs using
the single-transect (ST) and eigenbeaches (EX, EXT) methods to define the 50 and 100-
year erosion hazard zones. To ensure that shoreline change rates reflect long-term trends,
we include uncertainties due to short term shoreline position and other mapping errors. A
hazard zone overlay was compared to cultural data provided by the State Historic
Preservation Division and the Office of Hawaiian Affairs to identify threats to cultural
features. Cultural features identified in the study include burials, artifacts, Pohaku Puo`o,
and Punalua pond. A number of sites known to contain burials and cultural artifacts were
found within the erosion hazard zones.
Keywords:
Coastal erosion, shoreline change, erosion rate, EX, EXT, ST, single-transect
ivLIST OF TABLES
Table 1. Uncertainties in Shoreline Positions.………………………...…………………..7
Table 2. Kawela-Kahuku Cultural Features..………………………...…………………..13
vLIST OF FIGURES
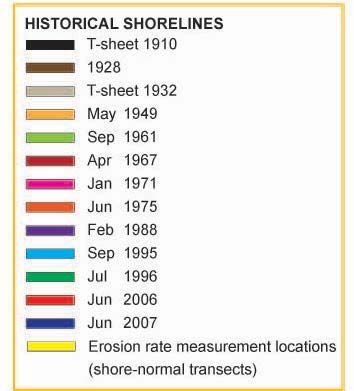
Figure 1. Historical Shorelines…………………………………..……………………….6
Appendix 1: FIGURES
Figure 2. Kawela-Kahuku, O‘ahu, Hawaii………………………...…………………….16
Figure 3. Kawela ST Hazard…………………………………….……………………….17
Figure 4. Kawela EX/EXT Hazard ………….…………………….…………………….18
Figure 5. Kawela Cultural Features ……..……………………….……………………...19
Figure 6. Turtle Bay ST Hazard …………………………………………………………20
Figure 7. Turtle Bay EX Hazard………………………………….………………….......21
Figure 8. Turtle Bay EXT Hazard ……………………………..………………….……..22
Figure 9. Turtle Bay Development ……………………………...………………………23
Figure 10. Kahuku Pt. ST Hazard ……...………………...……...………………………24
Figure 11. Kahuku Pt. EX/EXT Hazard …………………..…………………………….25
viTABLE OF CONTENTS
ACKNOWLEDGEMENTS………...…...………………………………………………..iii
ABSTRACT...……………...…………………………………………………….………iv
LIST OF TABLES………………………………………………………………………...v
LIST OF FIGURES …………………………………………………………………...…vi
INTRODUCTION
Iwi ………………………………………………………………..……………….1
Sea Level Rise ………………………………………………..…………………...2
Previous Work …………………………………………………………………….3
Physical Setting …………………………………………….......…………………7
MATERIALS AND METHODS
Mapping Historical Shorelines……………………………………..……………..4
Uncertainties in Shoreline Position…………………………………..…...…........6
Calculating Shoreline Change Rates………………………………….……..........8
Cultural Information …………………………………………………..……….....9
Hazard Images ……………………………………………………………..........10
RESULTS
Kawela …………………………………………………………….....….............10
Turtle Bay……………………………………………..………………………….11
Kahuku ………………………………………………………………..……........12
CONCLUSIONS ……………………………………………………………..……........13
REFERENCES ……………………………..…………………………………………...26
viiINTRODUCTION
Hawai‘i’s beaches are valuable because they are the focus of modern lifestyle as
well as cultural tradition. In recent decades beaches on O‘ahu, Hawai‘i have narrowed or
been lost due to erosion (Fletcher et al 1997). Coastal erosion is likely to expand and
accelerate as sea level rises. Land vulnerable to erosion may contain cultural featurest
such as burial sites, Hawaiian artifacts, former home sites, and others. Currently there is
no management protocol to deal with erosion threats to cultural assets. This study
evaluates chronic erosion threats to cultural assets on O‘ahu’s north coast in the area from
Kawela Bay to Kahuku Point.
Iwi
Dunes have long been important burial sites (Markell 2009). Chronic erosion
unearths iwi, or bones, thereby exposing them to potentially inappropriate treatment by
an unknowing public. With continued and accelerated sea-level rise this problem will
become more widespread. Hawaiians believe their existence is divided equally between
their ‘uhane, or spirit, and their mana, or power. When a Hawaiian passes, the ‘uhane
leaves the body for the afterlife, and the mana remains with the iwi. It is for this reason
that Hawaiians place such high value on protocol with respect to the treatment of iwi. The
word iwi is repeated throughout the Hawaiian language exemplifying its importance. For
example kulāiwi literally means “plains of the bone” and is used in the Hawaiian
language to refer to ones’ homeland.
It is not uncommon for shoreline change to expose iwi. For instance Markell
(2009) reports that iwi are frequently “washed out” along roadways that hug the beaches
in Ka‘a‘awa, Kualoa, Hā‘ula, and Waimānalo. At Kahala, near the Hunakai street beach
1access, seawall construction and shifting sands are believed to be responsible for the
exposure of iwi belonging to two individuals. At this site the iwi are incorporated into a
calcareous grainstone (Markell pers comm, 2009). The iwi of approximately 70
individuals at Hāmākua Poko and Kū΄au on the north shore of Maui became exposed
after a high wave event in the 1990’s. Kahuku and Mōkapu, O‘ahu, Waiehu, Maui and
Mo‘omomi, Moloka‘i are some of the largest known coastal burial sites, and are believed
to contain thousands of iwi. Coastal erosion is known to occur in these areas.
Iwi or other burial remains that are unearthed, including those resulting from
coastal erosion, are considered an “inadvertent discovery”. The State Historic
Preservation Division (SHPD) is given jurisdiction over all burial materials 50 years old
or older. After consulting the appropriate ethnic organizations, the landowner, and any
known lineal or cultural descendants, SHPD is responsible for determining whether
human skeletal remains will be preserved in situ or relocated. In addition, the
development of a preservation plan is a minimum requirement for permitted land
disturbance. A preservation plan articulates the proper management and protection of all
burial sites, including, but not limited to, buffers, landscaping, and access by known
lineal or cultural descendents (DLNR, 2006). Although SHPD has yet to develop
protocols specific to coastal erosion, the number of exposed iwi is likely to increase in the
future and this is a concern.
Sea Level Rise
A 1m rise in global average sea level is projected by the year 2100 (Fletcher,
2009). As sea level rises, coastal environments including beaches will begin to migrate
landward and upward. A 1m rise in sea-level may drive shoreline retreat as much as 100
2m inland. Beaches may adjust to sea-level rise without much change in beach width as
long as there continues to be a sufficient sand source located landward of the beach.
However, much of Oahu’s coastline is highly developed and sand dunes have been
removed, thus backshore sand may be scarce. Homes, roads, iwi and other cultural sites
will become increasingly threatened as the shoreline retreats due to sea-level rise.
Current shoreline change rate models, including those used in this study have yet to
account for the projected 1m rise in sea level, however it is important to understand how
this process may affect coastal areas.
Previous Research
Shoreline change rates have been determined by the Coastal Geology Group at
UH Mānoa for the islands of Kaua‘i, O‘ahu, and Maui. Based upon these rates, stricter
shoreline setbacks have been established for Kaua‘i and Maui.
Jurisdiction over Hawai‘i’s coast is split between the state and the counties, which
can make proper management of shorelines difficult. Typically, the state has authority
over the beach, while the counties govern the dunes. Despite the efforts being made by
SHPD, the counties, and the state, there has yet to be a movement to couple data and
management under a single process. The use of shoreline change rates to predict which
cultural areas may be potentially threatened by coastal erosion can allow for better
treatment of coastal cultural sites.
Physical Setting
The study area consists of Kawela Bay, Turtle Bay, and Kahuku Point, located on
the north shore of O‘ahu (Figure 2). Kawela Bay Beach lies between two limestone
headlands, and is typically characterized by small waves due to protection by a shallow
3reef at the mouth of the bay. The shoreline at Turtle Bay is largely composed of exposed
limestone shelf with a ‘perched’ calcareous beach above the water line. Several small
beaches are found between limestone headlands and beach rock is prevalent. Kahuku
Point is the northern-most tip of the island of O‘ahu. Kaihalulu Beach extends from
Turtle Bay resort to Kahuku Point. Kaihalulu Beach is similar to Turtle Bay. Shoreline
position is highly variable at these beaches and limestone outcrops are intermittently
exposed and buried by seasonal shifts in sand. The entire study area is exposed to north
and west swells during winter months and trade wind waves year-round.
MATERIALS AND METHODS
Mapping Historical Shorelines
This study closely adheres to the methods of Fletcher et al. (2003) and Romine et
al. (2009). Historical shorelines are digitized from 0.5 m orthorectified aerial photo
mosaics and NOAA NOS topographic surveyor maps (T-sheets) from 1910-2007. PCI
Geomatics’ Geomatica Orthoengine software (2007) is used to orthorectify and mosaic
images. The orthorectification process geometrically corrects aerial photographs and T-
sheets so that these images are uniformly scaled and can be measured as a map. The most
recent aerial photographs acquired for the study area are from 2007. The orthorectified
2007 aerial photographs serve as the master images and are used to orthorectify all of the
older images. The PCI program also reduces error that may result from lens distortion,
Earth curvature, refraction, camera tilt, radial distortion, and terrain relief. The root mean
square (RMS) positional errors that are produced from the orthorectification process are
based upon how the orthorectification model for each year differs from the master image
4(2007 image) and a digital elevation model (DEM). Only RMS values less than 2 m are
accepted for the aerial photographs, and RMS values less than 4 m are accepted for T-
sheets.
This study uses the low water mark (LWM) as a proxy for the shoreline. The
LWM refers to the beach toe or the base of the foreshore. The vegetation line was also
mapped in this study so that historical changes in beach width between the LWM and
vegetation line may also be observed and calculated. The 1910 and 1932 T-sheets map
the high water mark (HWM), as a shoreline proxy rather than the LWM. To correct this
difference the HWM is migrated to the LWM using an offset calculated from
measurements taken during beach profile surveys at Sunset Beach, O‘ahu (Romine et al.,
2009). No beach profile surveys have been taken in the study area and Sunset Beach
serves as the nearest beach with profile data. After mapping the historical shoreline for
each time period, they are all displayed together on the master image (Figure 1).
5Figure 1. Historical Shorelines. LWMs from a portion of the study area are color coded
by year. Yellow transects are points where shoreline change is measured.
Uncertainties in Shoreline Position
The methods of Romine et al. (2009) are used to calculate seven sources of
uncertainty that are included in the shoreline change models. The seven sources of
uncertainty account for the high variability of shoreline positions as well as any mapping
errors. The seven sources of error include Digitizing Error (Ed), Pixel Error (Ep),
Seasonal Error (Es), Rectification Error (Er), Tidal Error (Etd), T-sheet Plotting Error (Ets),
T-sheet Conversion Error (Etc) (table 1.). The total positional uncertainty, Et is the root
sum of squares of individual errors: Et=(Ed2+Ep2+Es2+Ert2+Etd2+Ets2+Etc2) 1/2.
6Table 1. Uncertainties in Shoreline Position
Uncertainty Source
Ed, Digitizing Error
Ep, Pixel Error, aerial photos
Ep, Pixel Error, T-sheets
Es, Seasonal Error
Er, Rectification Error
Etd, Tidal Error
Ets, T-sheet Plotting Error
Etc, T-sheet Conversion Error
Et, Total Positional Error
The Digitizing Error, Ed accounts for variability in interpreting shoreline position
when measured by several experienced analysts at the Coastal Geology Group, UH
Manoa. Pixel Error, Ep is a direct result of the resolution or the pixel size of the
orthophotomosaics and T-sheets. The Seasonal Error, Es is a measure of the variability
between winter and summer shoreline positions (LWM) along a single transect used at
the Sunset Beach profile. The Recitification Error, Er is a measure of the variability
between orthorectified aerial photographs, and t-sheets to the master orthorectified image
and DEM. Tidal Fluctuation Error, Etd, accounts for possible fluctuations in shoreline
position due to tides. T-Sheet Plotting Error, Ets results from the use of the HWM as a
proxy for shoreline position when mapping T-sheets. Conversion Error for T-sheets, Etc
accounts for uncertainty that may arise when migrating the T-sheet HWM to represent a
contemporaneous LWM.
7Calculating Shoreline Change Rates
Distances between shorelines are measured as transects spaced 20 m along the
shore (Figure 1). Shoreline change rates are calculated from the time series of historical
shoreline positions using the single-transect (ST) and eigenbeaches (EX, EXT) method.
The ST method has been used in previous studies as well as coastal planning to calculate
shoreline change rates for the islands of O‘ahu, Kaua‘i, and Maui. The ST method
calculates a shoreline change rate and uncertainty at each shoreline transect using
weighted least squares regression. Weighted least squares regression fits a trend line to
the time series of historical shoreline positions by giving positions with higher
uncertainty less of an influence on the trend line than shoreline positions with smaller
uncertainty (Fletcher et al., 2003; Genz et al., 2007). The resulting slope of the trend line
is the shoreline change rate. Recent work by Frazer et al. (2009) has identified three main
shortcomings of the ST methods. The ST method is an unparsimonious model and tends
to over-fit data by using more parameters than necessary. Secondly, the ST model only
takes into consideration shoreline change data at a single transect and as a result ST
shoreline change rates at each transect vary independently of the other transects along the
shore. Thus ST shoreline change rates don’t account for the sharing of sand along the
shore, which is an important characteristic of beaches. Finally the ST method tends to
have high uncertainty as a result of modeling shoreline change independently at each
transect.
Frazer et al. (2009) and Genz et al. (2009) have developed the EX and EXT
models to model shoreline change rates in the alongshore as well as the cross shore
direction. Like the ST method, the EX and EXT methods use linear regression to fit a
8line with time and cross-shore shoreline change. The EX and EXT methods also take
into consideration data from all transects along a beach, which accounts for the sharing of
sand between transects. The EXT method identifies and calculates rate variations or
acceleration of shoreline change rates in time. This is an important feature because
shoreline change may not be constant. The uncertainties produced by the EX and EXT
methods are lower than the uncertainties produced by the ST method.
Cultural Information
Cultural information was obtained from the Office of Hawaiian Affairs (OHA)
and the State Historic Preservation Division (SHPD). Shape files provided by OHA are
used to identify and locate ahupua‘a or Hawaiian land divisions, burials, and cultural
deposits found within the study area. All original shape files were orthorectified using
the same UTM projection as this study. Kai Markell was interviewed on August 18, with
regard to the significance of iwi to the Hawaiian culture. Kai has served as the head of
Native Rights Land and Council at OHA, and he has also worked at SHPD. The
Archaeological Mitigation Plan for the Turtle Bay Resort as well as SHPD burial reports
are used to gather more information pertaining to the components of the identified
cultural sites. These documents identify the number of burials found at each site, the
types of artifacts found, and how Hawaiians have historically used the areas labeled
cultural deposits.
Hazard Images
Erosion hazard zones are determined for the Kawela, Turtle Bay, and Kahuku Pt.
study sites. Potentially threatened cultural features are identified as those that fall within
the erosion hazard zones. Erosion hazard zones are constructed by projecting ST, EX, and
9EXT shoreline erosion rates and uncertainties 50 and 100 years. In areas with no
acceleration in shoreline erosion rates EX & EXT hazard zones are the same.
RESULTS
Kawela
Three cultural features are identified in the Kawela area. These cultural features
include the Pahipahiālua Beach Park Burial 03765, Punaulua, and the Kawela Bay
Subsurface Cultural Feature (Figures 3, 4). A fishing shrine is also known to exist along
the Pahipahiālua Beach Park, however its exact location is unknown and as a result could
not labeled in this study (O’Hare and Hammat 2006). Further inland of Pahipahiālua
Beach Park, along the western point of Kawela Bay is Punaulua pond. This brackish pond
is fed by a freshwater spring and is believed to have once attracted Ulua or crevalle fish.
Extending from the middle to the eastern portion of Kawela Bay is the Kawela Bay
Subsurface Cultural Deposit 2899. PHRI was contracted by the Turtle Bay Resort to
conduct an intense cultural survey on the Kawela Bay Subsurface Cultural Deposit 2899.
PHRI identified midden, Hawaiian artifacts, and a total of 5 burials. The Kawela Bay
Subsurface Cultural Deposit 2899 is divided into four main regions and labeled A, B, C,
D (Figure 5). The highest density of artifacts and midden were found in area D, while
area C contained the highest density of subsurface features. It is believed that areas C and
D were once used to manufacture fishing gear. The shoreline that fronts areas C and D is
referred to Wakiu and was once known for its large schools of moi and its fishpond
(O’Hare and Hammat 2006).
10The 50 and 100 year Kawela ST erosion hazard lines are projected from the 2007
vegetation line. The hazard zone extends landward of the Pahipahiālua Beach Park
Burial (Figure 3, 4). The 50 and 100 year Kawela ST erosion hazard incorporate portions
of the Kawela Bay Subsurface Cultural Deposit 2899 within the hazard zone. Due to
the lack of acceleration in shoreline change rates, the EX and EXT models produce the
same hazard projections. Due to the lower uncertainty associated with the EX and EXT
hazard zones, a smaller portion of Cultural Deposit 2899 falls within the EX and EXT
hazard zone in comparison to the ST hazard zone. Punaulua doesn’t appear to fall within
the ST, EX, or EXT hazard zones.
Turtle Bay
The Turtle Bay area contains a single culture feature, Burial 4488 (Figures 6, 7,
8). Burial 4488 consist of iwi from a total of 5 individuals. These iwi were found near the
stables at the Turtle Bay resort during a sand mining project.
The Turtle Bay area is the only study site that showed acceleration of shoreline
change in time, and thus produce different EX and EXT erosion hazard zones. All models
project the erosion hazard line seaward of Burial 4488 (Figures 6, 7, 8). The ST erosion
hazard zone has the highest uncertainty, and as a result is the only erosion hazard zone to
include Burial 4488.
Construction of the Turtle Bay Resort was completed in May of 1972. Figure 9 is
used to compare changes in shoreline before, during, and after the construction of the
Turtle Bay Resort. In the 1967 photo the area that is now occupied by the Turtle Bay
Resort was once covered in vegetation and also contained a stream. By 1971
construction in this area removed vegetation, the stream, and manipulated the sand dunes.
11The 2007 aerial image gives a modern day perspective of the Turtle Bay Resort and the
extent of construction that has taken place.
Kahuku Point
In March and April of 1986, PHRI conducted an intensive archaeological survey
at the Kahuku Pt. Cultural Deposit 2911. The Kahuku Pt. Cultural Deposit is located
makai or seaward of the Kahuku Pt. sand dunes (Figure 10 & 11). This cultural deposit
contains 4 burials, Hawaiian artifacts, midden and is the site of a former Hawaiian
settlement. Approximately 90 m inland of Kahuku Point is a brackish water pond known
as Kukio Pond. This pond is believed to have been used to cultivate taro, and once served
as a fishpond. Kukio Pond still remains today however it is believed to have formerly
been much larger. According to long-time resident Mrs. John Kaleo the area between
Kukio pond and the coast surrounding Kahuku point was used as a burial site. Her former
family and relatives have all been buried in this area.
There is no acceleration in the shoreline change rates at Kahuku Pt and as a result
EX and EXT erosion hazard projections are identical. Fifty year ST, EX and EXT
erosion hazard zones all include the entire southwestern portion of Cultural Deposit 2911.
The 100 year ST, EX, and EXT erosion hazard lines all fall landward of the southwestern
portion of Cultural Deposit 2911.
12Table 2. Kawela-Kahuku Cultural Features
Cultural Threatened?
Cultural Site Location
Significance
Pahipahiālua Beach Park -Single Burial 50 yr ST, EX, EXT
Burial Kawela -Pahipahiālua
03765 -Fishing shrine
-Freshwater spring No
Punaulua
Kawela that attracted Ulua,
00258
or crevalle fish.
-5 burials 50 yr ST, EX, EXT
Kawela Bay Subsurface
-Hawaiian artifacts
Cultural Deposit Kawela
-Former Hawaiian
2899
Settlement
Burial 100 yr ST
Turtle Bay -5 burials
4488
-4 burials 50 yr ST, EX, EXT
Kahuku Pt. Cultural -Hawaiian artifacts
Deposit Kahuku Pt. -Former Hawaiian
2911 Settlement
-Kūki`o Pond
CONCLUSIONS
ST, EX, and EXT shoreline change rates and uncertainties may be used to project
future erosion hazard zones. Potentially threatened cultural sites are identified as those
that fall within the erosion hazard zones. The ST, EX and EXT models allow for
potentially threatened cultural sites to be identified before erosion events occur.
Pahipahiālua Beach Park Burial 03765, Kawela Bay Subsurface Cultural Deposit 2899,
and Kahuku Pt. Subsurface Cultural Deposit 2911 are all found to be vulnerable to
coastal erosion in the next 50 years. Burial 4488 may become vulnerable in 50 years
based upon the ST model only. Punaula 00258 is located further inland on a raised
carbonate structure and is the only cultural feature that all models agree will not be
threatened by erosion within the next 100 years.
13The Turtle Bay area is the only study site that produced an EXT model, which
indicates that the shoreline change rates in this area are accelerating in time. Acceleration
in erosion rates at Turtle Bay may be due to the construction of the Turtle Bay Resort.
Aerial photographs from 1971 show that construction in this area removed nearly all of
the vegetation, covered a stream, and manipulated the sand dunes. According to the
Archaelogical Mitigation Plan for the Turtle Bay Resort (2006), a sand mining operation
also took place near the area labeled Burial 4488. Present day Turtle Bay area is nearly
entirely covered with Hotel structures, and cultivated vegetation. All of these factors
may have negatively impacted sand sources and thus accelerated erosion rates in this
area.
This study is the first to incorporate both shoreline change data and cultural data.
Currently there is no protocol to deal with coastal erosion threats to cultural sites. The use
of erosion hazard zones to identify vulnerable culture features can be a coastal
management tool. Using the data provided in this study, managers can rank the
vulnerability of the threatened cultural features based upon cultural significance and the
time in which the feature may become threatened. Proper protocol may then be developed
to appropriately manage the assets such as possible relocation and preservation of cultural
features.
Currently SHPD is given jurisdiction over all iwi and burial goods 50 years and
older. Any inadvertently discovered iwi that are found at the Turtle Bay Resort are
relocated to a reinternment site located on the Turtle Bay Resort Property. If Hawaiian
artifacts with no burial association are discovered on public land they also fall under the
jurisdiction of DLNR, and usually SHPD. Hawaiian artifacts found on private land are
14considered to be property of the landowner and may or may not be preserved based upon
the discretion of the landowner. Thus it is important that the public as well as state and
county agencies are aware of coastal erosion so that they may make informed decisions.
15REFERENCES
Clark, J. 2005. Beaches of O‘ahu.Honolulu: UH Press, pp.100-104.
Fletcher, C.H.; Rooney, J.J.B; Barbee, M.; Lim, S.-C., and Richmond, B.M., 2003. Mapping
shoreline change using digital orthophotogrammetry on Maui, Hawaii. Journal of
Coastal Research, Special Issue No. 38, pp. 106-124.
Fletcher, C.H.; Boyd, R., Grober-Dunsmore; R., Neal W.J.; Tice, V., 1998. "Beach Erosion
and Loss." On the Shores of Paradise. Honolulu: UH Press, pp. 1-20.
Fletcher, C.; Mullane, R.; Richmond, B., 1997. Beach loss along armored shorelines on
Oahu, Hawaiian Islands. Journal of Coastal Research, 13, 209-215.
Frazer, L.N.; Genz, A.S., and Fletcher, C.H., 2009. Toward parsimony in shoreline change
prediction (I): new methods. Journal of Coastal Research, 25(2), 366-379.
Genz, A.S.; Frazer, L.N., and Fletcher, C.H., 2009. Toward parsimony in shoreline change
prediction (II): applying statistical methods to real and synthetic data. Journal of
Coastal Research, 25(2), 380-404.
Markell, K., Personal Interview, 18 August 2009.
O’Hare, C.R, and Hammat, H.H., 2006. Archaeological Mitigation Plan for the Turtle Bay
Resort. Cultural Surveys Hawaii, Inc. pp. 1-111.
Romine, B.; Fletcher, C.H.; Frazer L.N.; Genz, A.; Barbee, M., and Lim, S.-C., 2008.
Historical Shoreline Change, Southeast O`ahu, Hawaii`; Applying Polynomial
Models to Calculate Shoreline Change Rates. Journal of Coastal Research. 25(6),
pp. 1236-1253.
26You can also read