Using Google Earth to map gully extent in the West Gippsland region (Victoria, Australia)
←
→
Page content transcription
If your browser does not render page correctly, please read the page content below
19th International Congress on Modelling and Simulation, Perth, Australia, 12–16 December 2011
http://mssanz.org.au/modsim2011

       Using Google Earth to map gully extent in the West
             Gippsland region (Victoria, Australia)
                                J. McInnes a, O.Vigiak a and A.M. Roberts a
 a
     Department of Primary Industries, Future Farming Systems Research Division, Rutherglen Centre, RMB
                        1145 Chiltern Valley Road, Rutherglen, VIC 3685, Australia.
                                     Email: jane.mcinnes@dpi.vic.gov.au

Abstract: Mapping gullies over large areas requires detailed aerophotos. Google Earth (GE) provides free
access to high resolution satellite imagery, but is the quality good enough to map gullies reliably? The aim of
this work was to evaluate the accuracy with which gullies in the West Gippsland region could be mapped
using GE images. The area comprised the LaTrobe, Thomson and Avon catchments and extended over 11130
km2 in Victoria, south-eastern Australia. GE images available for the West Gippsland area at the time of the
study were from three sources: Cnes/Spot Image of 2.5 m ground resolution, Digital Globe of 0.6 m
resolution, and GeoEye of 0.5m resolution. Gullies were identified and digitized from GE images, then
transferred to GIS. After digitization of a pilot area (192 km2), on both forested and agricultural land, an
initial field survey was conducted in December 2010 to improve interpretation of GE images. The pilot study
showed that large canopy cover in plantations and native forest precluded observation of gullies beneath.
Gullies under forest canopy could only be recognized on areas felled or burnt before the image was taken.
Following the pilot area evaluation, gully mapping in West Gippsland was restricted to agricultural land;
forest and plantation areas, covering 64 % of the catchment, were excluded. A second, more extensive field
survey was conducted in January 2011 on 39 transects to assess the accuracy (absence/presence) of the gully
map on agricultural land. Gullies totaling 2385 km were mapped in agricultural areas across the region. Most
gullies (87%) were located along drainage lines and were connected to streams. It was sometimes difficult to
separate gully from streambank erosion. Following field observations, streams were defined as drainage lines
of third or greater order (Strahler method), whereas incised first and second order drainage lines were
classified as gullies. Gully density on agricultural land increased from West to East across the West
Gippsland region, varying from 0.59 km/km2 in the LaTrobe catchment, to 0.65 km/km2 in the Thomson and
0.86 km/km2 in the Avon catchment. The field survey showed that 26% of gullies observed were not mapped
from GE images, whereas 13% of mapped gullies were not confirmed by the field survey. Mapping errors
were correlated to image resolution, with higher errors associated with coarser resolution images. During the
survey, 12 representative cross-sections of gullies were measured by recording the maximum depth, width,
and taking a perpendicular photograph. Gullies were generally small and inactive, having a median cross
section of 2.7 m2 (1.7-4.1 m2 interquartile range). By assuming an exponential decay of gully wall retreat in
the gully stabilization phase, current gully erosion rate of active gullies was assessed at 0.02 m2/y. Together
with the revised gully network extent, suspended sediment load originated by gully erosion in the region was
estimated at 10.6 kt/y. This estimate is higher than reported in previous research, due in part to the higher
gully density found in this study, as well as to differences in defining gully and streams and in erosion rate
estimates. Conditions in the West Gippsland region were not ideal for appraisal of gully erosion using GE
images because of the large extent of forest areas and the small gully system occurring in agricultural land. A
major limitation of the method was that image resolution was too coarse to distinguish between active or
inactive gully areas. Despite the limits highlighted, the use of GE images allowed appraisal of gully extent
over a very large area in relatively short time and at no cost for image acquisition. An application of the
method in agricultural catchments with older, larger gully systems, such as frequently found in South-east
Australia, would be likely to result in much lower errors than found this case study. We conclude that
interpretation of GE images for rapid appraisal of gully extent on large areas is a useful approach particularly
where old, well developed gully systems are prevalent in agricultural/cleared land. Further work, confirmed
by field survey verification, would be useful.

Keywords: Gully erosion, Google Earth, West Gippsland

                                                   3370
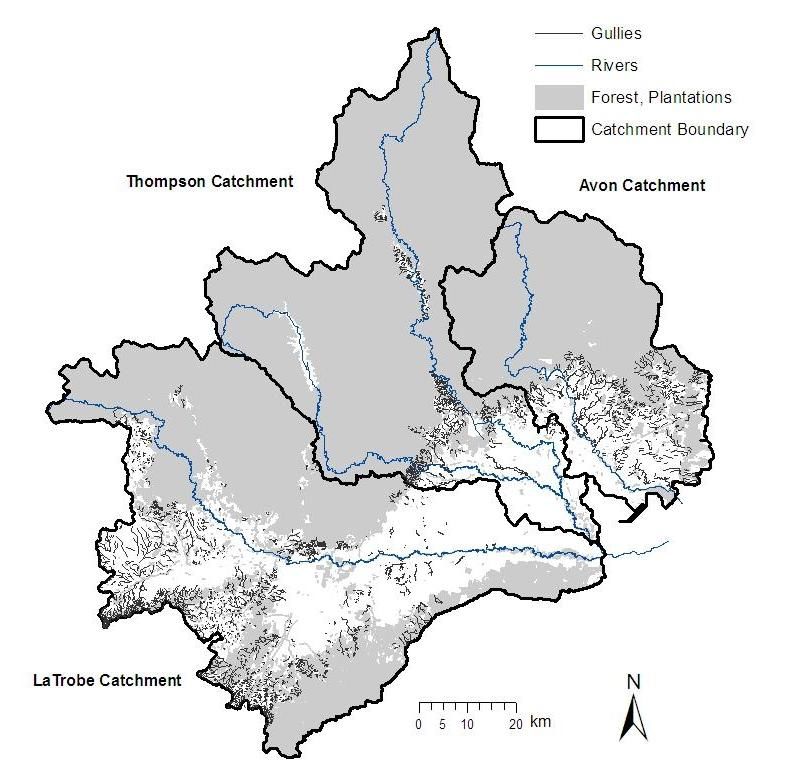
McInnes et al., Using Google Earth to map gully extent in the West Gippsland region (Victoria, Australia) 1. INTRODUCTION Gully erosion in South Eastern Australia is an important contributor of sediments and nutrients to waterways (Prosser et al., 2001; Wilkinson et al., 2009). The amount of suspended sediment generated by gully erosion can be assessed as (Whitford et al., 2010): S = lrt ρΔ (1) where S is the suspended sediment load of the gully system (t/y); l is the total length (m) of gully network; rt is the erosion rate (i.e. annual increase of gully cross section by retreat of sidewalls; in m2/y) at time t (usually contemporary); ρ is the density of sediments (t/m3); and ∆ is the fraction of gully wall particles contributing to suspended sediments, i.e. of diameter < 63 μm (Rustomji, 2006). This approach is widely adopted in semi-distributed sediment budget models, such as SedNet (Prosser at al., 2001; Hancock et al., 2007; Wilkinson et al., 2009) and CatchMODS (Newham et al., 2004). The application of Eq. (1) requires assessing the extent of the gully system l and the current gully erosion rate rt. Gully mapping over extensive areas requires access to good quality aerophotographs (Whitford et al., 2010; Desprats et al., 2011). The availability of very high resolution satellite imagery, such as Geo-Eye, QuickBird or Ikonos, is providing new avenues for quick appraisal of gully network over large areas. In the Mediterranean region, Shruthi et al. (2011) has successfully extracted gully erosion features using very high resolution Ikonos and Geo-Eye-1 images and semi-automatic image analysis techniques. In another Mediterranean catchment, Desprats et al. (2011) detected 84.1% of permanent and ephemeral gullies by visual interpretation using Quickbird. Detection of linear erosion features depends on the ground resolution of the imagery in relation to the feature width, with easier detection of features that are wider than the image ground resolution. Timing of the image is also important, particularly for small or ephemeral features that may be erased by tillage operations or covered by vegetation canopies (Desprats et al., 2011). Because of shadow effects on panchromatic aerophotos or images, the width/depth ratio of the gully is also important: shallow and large gullies are easier to detect than narrow and deep ones (Giménez et al., 2009). Acquisition of very high ground resolution satellite images remains however expensive. Conversely, Google Earth (GE) provides free access to very high resolution satellite images, albeit with a reduced spectral and spatial resolution (Potere, 2008). In Australia, GE imagery ground resolution is usually 2.5 m or better; and horizontal position accuracy has been estimated at 22.6 m RMSE (Potere, 2008). Such high resolution imagery provides an appealing data source for mapping permanent gully systems that prevail in Southeast Australia (Wasson et al., 1998). This study aimed at evaluating the accuracy with which permanent gullies in the West Gippsland region in Victoria, south-eastern Australia, could be mapped using GE images. 2. METHODS 2.1. The West Gippsland region The West Gippsland region covers an area 11130 km2 in Victoria, south-eastern Australia and encompasses the LaTrobe, Thomson and Avon catchments (Figure 1). The three rivers drain to Lake Wellington, which is the westernmost lake of the iconic Gippsland Lakes, an area of national and international ecological importance. Altitude ranges from sea level at the lake to 1720 m in the Alpine region in the north. The Strzelecki range in the south-west of Latrobe catchment reaches lower altitudes (
McInnes et al., Using Google Earth to map gully extent in the West Gippsland region (Victoria, Australia)

Gully erosion in the region has been previously estimated to contribute in the order of 4.3 kt/y of sediment to
the Gippsland Lakes (Hancock et al., 2007). Information regarding gully extent was limited to a study that
estimated gully density in Victoria based on aerophotointerpretation and surveys conducted in the 1970s and
1980s (Ford et al., 1993; Victorian Resources Online, 2011) and a detailed, local study in the southern hills of
the LaTrobe river (Rutherfurd, 1994).

2.2.   Gully mapping
GE images available for the West Gippsland area at the time of the study dated from 2009 to 2010 and were
of three sources: Cnes/Spot images of 2.5 m ground resolution, DigitalGlobe of 0.6 m resolution, and Geo-
Eye of 0.5m resolution. To facilitate the recognition of gullies, a stream network layer at scale 1:25000
(Corporate Geospatial Digital Library, 2010) and a subcatchment map were imported into GE. The
subcatchment map divided the regions in subcatchments to approximately 40 km2 in size, derived from a 20-
m pixel Digital Elevation Model (DEM) using automatic catchment delineation tools (ArcGIS). The
subcatchment map was used to help track the process of gully recognition. Gullies were recognized in the GE
images and delineated.
Whitford et al. (2010) proposed a simple gully classification system according to connectivity, size, and
activity of erosion. A gully is assumed as being connected to a stream or waterway if its mouth reaches the
stream network, and disconnected if the sediments are deposited in fans away from the stream network. Size
relates to the width of the gully, >5m in width being classified as a major gully and
McInnes et al., Using Google Earth to map gully extent in the West Gippsland region (Victoria, Australia)

Following the pilot evaluation, gully mapping in West Gippsland was restricted to agricultural land. A
second, more extensive field survey was conducted in January 2011 on 39 transects to assess the accuracy of
gully detection (presence or absence) of the final map over the whole region. Again, locations at which
gullies crossed the road transects were recorded with GPS and compared to the map. In addition, land use
adjacent to the gully, and gully erosion activity were recorded.

2.3.    Assessment of gully erosion in the region
In order to apply eq. (1) and assess gully erosion sediment loads, the current gully erosion rate rt was
assessed using the method developed by Whitford et al. (2010). The method assumes that a gully system
evolves through three phases: initiation, stabilization and accretion (Wasson et al., 1998). During the
initiation phase, which may last 20-30 years, erosion rate is very high and erratic, but in the following
stabilization phase erosion rate is assumed to decline exponentially over time. During the stabilization phase,
by assuming an exponential decay function, the cross section of a gully and its approximate age can be used
to assess the current rate of erosion in terms of annual enlargement of gully cross section (m2/y, Whitford et
al., 2010).
Because the gully system in the region was likely to have started around the 1890s (Sargeant, pers. comm.),
the current erosion rates are assumed as being well within the stabilization phase. During the January 2011
survey, 12 representative gully cross sections were measured by recording maximum depth and width, and by
taking a picture perpendicularly to the main gully direction. The pictures were analyzed using ImageJ
(Rasband, 2011) to measure the cross section area (Whitford et al. 2010). The density of sediments ρ was
assumed = 1.6 t/m3; and the fraction Δ of gully wall sediments contributing to suspended sediments was
assumed = 0.5 after Hancock et al. (2007).

3.     RESULTS

3.1.    Gully mapping
The pilot field survey
(Figure 2) showed that of 66
gullies observed in the field,
only 34 were mapped. The
error sources were several.
Some errors were due to an
incorrect location of the
gully head: for example, a
gully might have been
mapped as starting in a
paddock, while it actually
extended further upstream
to a road intersection.
Closer inspection of the
image showed that the gully
head was detectable but
hard to recognize without
some local knowledge. As a
result of the pilot study, the
image interpretation skills
of the operator improved. A
second, more important
source of error was linked to
the land use of the area.
Gullies under forest and
wood plantations were            Figure 3. The gully map of the West Gippsland region generated by Google
almost undetectable (80%                                Earth image interpretation.
unmapped), whereas gullies
in agricultural land were more easily recognized (40% unmapped).
After the pilot study, gully mapping in the West Gippsland region was conducted solely on agricultural (i.e.
non forested) land, and resulted in 2385 km of gullies mapped (Figure 3). Gully density increased from east

                                                    3373
McInnes et al., Using Google Earth to map gully extent in the West Gippsland region (Victoria, Australia)
to west catchments, most likely as a result of soil type differences (e.g. Ford et al., 1993), despite a lower
rainfall gradient from west to east. Overall, gully density on agricultural land was 0.65 km/km2 (Table 1).
Table 1. Gully length and density mapped in non forested land in three West Gippsland catchments
LaTrobe Thomson Avon
Length (km) Connected 1385 428 560
Disconnected 2 0.5 7
2
Density (km/km ) 0.59 0.65 0.86
The January 2011 survey showed that of the 160 gullies found in the field, 120 (75%) were correctly mapped
using GE images. The survey also showed that 26% of gullies were not mapped from the GE images; the
presence of 13% of mapped gullies from GE was not confirmed by the field survey. These errors combined
indicate that the gully map is likely to underestimate gully extent even in agricultural land.
Mapping errors increased with decreasing resolution from Geo-Eye (0.5 m ground resolution; error 20%); to
DigitalGlobe (0.6 m resolution; error 25%); to Cnes/Spot images (ground resolution 2.5 m; error of 32%).
Figure 4 (left) shows an example of a road transect and gully mapping on images of different resolution.
Figure 4. The left hand side of the figures shows an example of road transect (black line) used to verify
gully mapping (red lines) using GE images. The image ground resolution ranges from 0.5 m in the lower
right corner (Geo-Eye, with slightly darker green shades) to 2.5 m (Cnes/Spot) in the left and upper
parts. A typical gully is depicted on the right hand side of the Figure.
3.2. Assessment of gully erosion
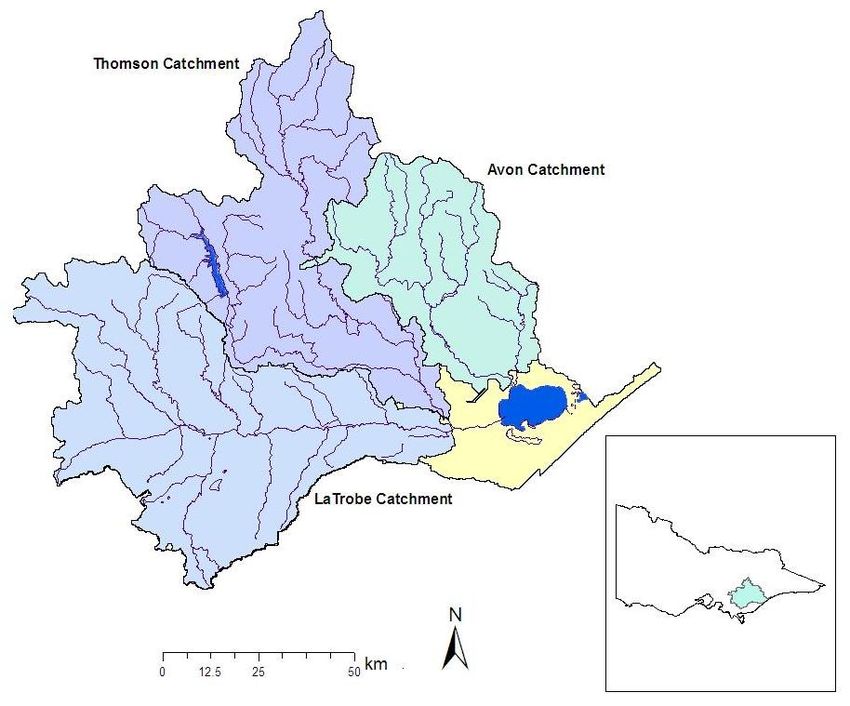
Surveyed gullies were generally small, mostly V shaped, with relatively stable banks due to high vegetation
cover (e.g. Figure 4). The median width of the 12 sampled gullies was 4.7 m, and median depth was 0.5 m.
Gullies were therefore mostly shallow and wide, and the minimum width/depth ratio was 3.6. The median
cross section was 5.7 m2 (interquartile range 1.7-4.1 m2). Assuming an exponential rate of decay of gully
erosion during the stabilization phase (Whitford et al., 2010), the current (1990-2010) rate of sidewall erosion
was estimated at 0.02 m2/y for active gullies. However, the gully system was relatively stable (80% inactive,
from field survey), and erosion rates for these inactive gullies are likely to be an order of magnitude lower
than active ones (Whitford et al., 2010).
3374McInnes et al., Using Google Earth to map gully extent in the West Gippsland region (Victoria, Australia)
Given the 2385 km of gully network mapped with GE in West Gippsland, the suspended sediment load
originated by gully erosion with eq. (1) was estimated at 10.6 kt/y, more than double that reported previously
(4.3 kt/y; Hancock et al., 2007).
4. DISCUSSION
The error in mapping gullies found in this study was substantial (25%), 10% higher than reported by Desprats
et al. (2011) with similarly high resolution imagery. Our study confirms the importance of resolution of
imagery on map accuracy (Desprats et al., 2011). As GE images are updated frequently in terms of improving
image quality, this source of error should reduce with time. Gully detection is maximized when the image is
taken at times of low ground cover (Desprats et al. 2011). In this region, images taken at the beginning of
autumn (March/April), when pasture cover is at lowest levels, would be best suited for gully detection as well
as for conducting field surveys. Even the identification of gullies in the field was difficult due to high grass
cover along the road sides and in pastures at the time of the survey (Dec-Jan). Unfortunately, timing of GE
images is beyond our control; although dates of GE images are nowadays provided for some platforms, this
information is not homogeneous across a region, and access to image archives is still limited. This remains a
major limitation of using GE images for land use studies (Potere, 2008).
Aero-photo interpretation is subject to personal perception (e.g. Shruthi et al., 2011). Visual image
interpretation depends on the operator’s local knowledge and recognition skill. This study relied on a single
operator to map gullies to give consistency in mapping accuracy, but the operator had no previous local
knowledge of the area. Conversely, Desprats et al. (2011) image interpretation had followed extensive local
surveys, so was informed by high local knowledge. Thus mapping errors could be reduced if conducted by
people with substantial local knowledge. Shruthi et al. (2011) found that semi-automatic feature extraction
led to higher gully mapping accuracy than visual interpretation. Similarly, Desprats et al. (2011) obtained
high map accuracy with semi-automated techniques of feature extraction and interpretation. Such techniques
may be used to improve GE imagery analysis as well. This warrants further research.
Gully mapping in the pilot area included forested areas. Gullies were detected on cleared/felled sites that
were otherwise of difficult access, but could not be detected under intact forest cover. This limit is not
restricted to GE imagery, but affects any aero-photograph technique (Desprats et al., 2011). The field survey
confirmed the presence of old and large gullies that mostly develop along the drainage lines in forested areas.
Although gullies appeared to be stable and not actively eroding, not accounting for gullies in forested areas
may lead to serious underestimation of gully erosion sediment loads.
Despite being limited to agricultural land, the GE gully map updates previous information on gully erosion in
the region (Ford et al., 1993; Victorian Resources Online, 2011), which is also limited to non public land.
The GE map confirmed the east-west increase in gully density across the region, and the high gully densities
in the Thompson-Macalister and Avon catchment foothills. However, gully densities were higher than
previously reported. Importantly, the GE gully map highlights extensive gully erosion in the west and
southern hills of the LaTrobe catchment, thus enlarging the Rutherfurd (1994) dataset in this catchment.
The contribution of gully erosion to sediment loads in waterways does not only depend on gully extent; gully
connectivity to waterways, size and activity status are important factors (Whitford et al., 2010). Gully erosion
activity and gully size could not be assessed from GE images. However, even connectivity was difficult to
assess from GE imagery: given the prevalent pasture land cover in the region, detection of depositional fans
at the gully mouth was difficult, so connectivity relied to the quality of the stream network GIS layer used to
support the analysis. The field survey proved essential to verify gully mapping accuracy and to add
information on gully size and degree of erosion activity.
The sediment load budget assessed in this study was double that reported in Hancock et al. (2007). The larger
extent of gullies may explain in part the different estimates despite the erosion rate being smaller than in
Hancock et al. (2007). A major source of discrepancy between the two studies may also lie in the
classification of gully versus streambank erosion; it is likely that several gullies mapped in this study
correspond to small streams in Hancock et al. (2007) study.
5. CONCLUSIONS
The gully map produced for the agricultural land on the West Gippsland region using GE imagery
underestimated gully presence by approximately 15%; nevertheless it represents an improved and updated
dataset over previous information of gully extent in the region. This new information was obtained at low
cost and in a relatively short time.
3375McInnes et al., Using Google Earth to map gully extent in the West Gippsland region (Victoria, Australia)
The largely forested catchments in combination with the small gully system prevalent in the region were not
ideal conditions for mapping gullies using GE. Given the ever increasing quality of GE images, application
of the method in agricultural catchments with older, larger gully systems, as frequently found in South-east
Australia, will likely result in higher accuracy than found in this study. The application of semi-automated
techniques of feature extraction and interpretation my further improve accuracy and speed of data generation;
this warrants further research.
The free availability of geo-referenced images makes Google Earth a valuable and cheap source of landscape
information that can be used for a first rapid appraisal of landscape processes. Field verification remains
essential to assess map accuracy and provide information on the size and activity of the gully system.
ACKNOWLEDGEMENTS
Contribution to GE interpretation and field survey by Emerson Tung is acknowledged. We thank Nick
Dudley (DPI) for assistance in the field.
REFERENCES
Corporate Geospatial Data Library. (2010). hydro25 layer. www.land.vic.gov.au (Accessed 10/12/2010)
Desprats, J.F., Raclot, D., Rousseau, M., Cerdan, O., Garcin, M., Le Bissonais, Y., Ben Slimane, A., Fouche,
J., and Monfort-Climent, D. (2011). Mapping linear erosion features using high and very high resolution
satellite imagery. Land Degradation and Development, doi: 10.1002/ldr.1094
Ford, J.W., Martin, J.J., Rengasami, P., Boucher, S.C., and Ellington, A. (1993). Soil sodicity in Victoria.
Australian Journal of Soil Research, 31, 869-909.
Giménez, R., Marzolff, I., Campo, M.A., Seeger, M., Ries, J.B., Casali, J., and Álvarez-Mozos, J. (2009).
Accuracy of high-resolution photogrammetric measurements of gullies with contrasting morphology.
Earth Surface Processes and Landforms, 34, 1915-1926.
Google EarthTM. www.earth.google.com
Hancock G., Wilkinson, S., and Read, A. (2007). Sources of sediment and nutrients to the Gippsland Lakes
assessed using catchment modelling and sediment tracers. CSIRO Land and Water Science Report 70/07.
Newham, L.T.H., Letcher, R.A., Jakeman, A.J., and Kobayashi, T. (2004). A framework for integrated
hydrologic, sediment and nutrient export modelling for catchment scale management. Environmental
Modelling and Software, 19, 1029-1038.
Potere, D. (2008). Horizontal positional accuracy of Google earth’s high resolution imagery archive. Sensors,
8, 7973-7981.
Prosser, I.P, Rutherford, I.D., Olley, J.M., Young, W.J, Wallbrink, P.J., and Moran, C.J. (2001). Large-scale
patterns of erosion and sediment transport in river networks with examples from Australia. Marine and
Freshwater Research, 52, 81-99.
Rasband, W.S. (2011). ImageJ, U. S. National Institutes of Health, Bethesda, Maryland, USA,
http://imagej.nih.gov/ij/, 1997-2011. (Accessed 9/03/2011)
Rustomji, P. (2006). Analysis of gully dimensions and sediment texture from southeast Australia for
catchment sediment budgeting. Catena, 67, 119–127.
Rutherfurd, I. D. (1994). Incised streams of Victoria with special reference to tributaries of the Latrobe River.
A draft report to DCNR and LWRRDC, Cooperative Research Centre for Catchment Hydrology.
Shruthi, R.B.V., Kerle, N., and Jetten, V. (2011). Object-based gully feature extraction using high spatial
resolution imagery. Geomorphology, 134, 260-268.
Strahler, A.N. (1957). Quantitative analysis of watershed geomorphology. Transactions of the American
Geophysical Union, 38, 913-920.
Victorian Resources Online. (2011). Distribution of gully erosion in Victoria.
http://www.dpi.vic.gov.au/dpi/vro/vrosite.nsf/pages/lwm_land_deg_gully_dist (accessed 7.10.2011)
Wasson, R., Mazari, R., Starr, B., and Clifton, G. (1998). The recent history of erosion and sedimentation on
the Southern Tablelands of southeastern Australia: sediment flux dominated by channel incision.
Geomorphology, 24, 291–308.
Whitford, J., Newham, L.T.H., Vigiak, O., Melland, A., and Roberts, A. (2010). Rapid assessment of
contemporary rates of gully erosion and suspended sediment yields in data-poor catchments.
Geomorphology, 118, 330-338.
Wilkinson, S.N., Prosser, I.P., Rustomji, P., and Read, A.M. (2009). Modelling and testing spatially
distributed sediment budgets to relate erosion processes to sediment yields. Environmental Modelling and
Software, 24, 489-501.
Zonum. (2010). www.zonums.com (Accessed 19.12.2010)
3376You can also read