Human footprint and protected areas shape elephant range across Africa
←
→
Page content transcription
If your browser does not render page correctly, please read the page content below
Report

Human footprint and protected areas shape elephant
range across Africa
Highlights                                                               Authors
d   229 African elephants were tracked across forest, Sahel,             Jake Wall, George Wittemyer, Brian
    savanna, and bushveld sites                                          Klinkenberg, ..., Fiona Maisels, Jelle
                                                                         Ferwerda, Iain Douglas-Hamilton
d   Protected areas and the human footprint both constrain
    elephant range size                                                  Correspondence
d   62% of the African continent is potential elephant habit, of         jake@maraelephantproject.org
    which elephants use 17%
                                                                         In brief
d   85% of potential elephant habitat lies outside current               Using GPS tracking from 229 African
    protected areas                                                      elephants across Sahel, forest, savannah,
                                                                         and bushveld sites, Wall et al. show that
                                                                         protected areas and the human footprint
                                                                         are the main factors affecting elephant
                                                                         range size. A habitat suitability model
                                                                         shows that 62% of Africa is potentially
                                                                         habitable, but elephants occupy just 17%
                                                                         of the 18 million square kilometers.

           Wall et al., 2021, Current Biology 31, 1–9
           June 7, 2021 ª 2021 The Authors. Published by Elsevier Inc.
           https://doi.org/10.1016/j.cub.2021.03.042                                                      ll
Please cite this article in press as: Wall et al., Human footprint and protected areas shape elephant range across Africa, Current Biology (2021), https://
doi.org/10.1016/j.cub.2021.03.042
ll
OPEN ACCESS
Report
Human footprint and protected areas
shape elephant range across Africa
Jake Wall,1,2,16,* George Wittemyer,2,3 Brian Klinkenberg,4 Valerie LeMay,5 Stephen Blake,6,7,8,9 Samantha Strindberg,6
Michelle Henley,10,11 Fritz Vollrath,3,12,13 Fiona Maisels,6,14 Jelle Ferwerda,15 and Iain Douglas-Hamilton3,12
1Mara Elephant Project, PO Box 2606, Nairobi, Kenya, 00502
2Department of Fish, Wildlife and Conservation Biology, Colorado State University, 1474 Campus Delivery, Fort Collins, CO 80523, USA
3Save the Elephants, PO Box 54667, Nairobi, Kenya, 00200
4Lab for Advanced Spatial Analysis, Department of Geography, University of British Columbia, 1984 West Mall, Vancouver B.C., Canada,
V6T 1Z2
5Department of Forest Resources Management, Faculty of Forestry, University of British Columbia, Forest Sciences Centre #2045–2424 Main
Mall, Vancouver, B.C., Canada, V6T 1Z4
6Global Conservation Program, Wildlife Conservation Society, 2300 Southern Boulevard, Bronx, NY 10460, USA
7Max Planck Institute of Animal Behavior, Am Obstberg 1, 78315 Radolfzell, Germany
8Biology Department, Saint Louis University, Biology Extension Building, 1008 S. Spring Ave. St. Louis, MO 63103, USA
9WildCare Institute, Saint Louis Zoo, 1 Government Drive, Saint Louis, MO 63100, USA
10Applied Behavioural Ecology and Ecosystem Research Unit, School of Environmental Sciences, University of South Africa, Private Bag X5,
Florida 1710, South Africa
11Elephants Alive, PO Box 960, Hoedspruit 1380, South Africa
12Department of Zoology, Oxford University, Oxford OX1 3PS, UK
13Mpala Research Centre, PO Box 555 - 10400, Nanyuki, Kenya
14School of Natural Sciences, University of Stirling, FK9 4LA, Scotland, United Kingdom
15University of Twente, Faculty of Engineering Technology, PO Box 217, 7500 AE Enschede, the Netherlands
16Lead contact
*Correspondence: jake@maraelephantproject.org
https://doi.org/10.1016/j.cub.2021.03.042
SUMMARY
Over the last two millennia, and at an accelerating pace, the African elephant (Loxodonta spp. Lin.) has been
threatened by human activities across its range.1–7 We investigate the correlates of elephant home range
sizes across diverse biomes. Annual and 16-day elliptical time density home ranges8 were calculated by us-
ing GPS tracking data collected from 229 African savannah and forest elephants (L. africana and L. cyclotis,
respectively) between 1998 and 2013 at 19 sites representing bushveld, savannah, Sahel, and forest biomes.
Our analysis considered the relationship between home range area and sex, species, vegetation productivity,
tree cover, surface temperature, rainfall, water, slope, aggregate human influence, and protected area use.
Irrespective of these environmental conditions, long-term annual ranges were overwhelmingly affected by
human influence and protected area use. Only over shorter, 16-day periods did environmental factors, partic-
ularly water availability and vegetation productivity, become important in explaining space use. Our work
highlights the degree to which the human footprint and existing protected areas now constrain the distribu-
tion of the world’s largest terrestrial mammal.9,10 A habitat suitability model, created by evaluating every
square kilometer of Africa, predicts that 18,169,219 km2 would be suitable as elephant habitat—62% of
the continent. The current elephant distribution covers just 17% of this potential range of which 57.4% falls
outside protected areas. To stem the continued extirpation and to secure the elephants’ future, effective and
expanded protected areas and improved capacity for coexistence across unprotected range are essential.
RESULTS exceed protected area boundaries.11–13 Many elephant popula-
tions inhabit regions that are undergoing rapid anthropogenic
African elephants have suffered major decreases in their change, such as increases in logging, roads, agriculture, pasto-
geographic range and numbers across most of the continent ralism, charcoal extraction, degradation of pristine areas, and
because of continued killing for ivory, habitat loss, and the growth compression of elephants into protected areas. These changes
of human populations and their associated pressures.1–7 African might often result in increased human-elephant conflict.14 Under-
savannah elephants (Loxodonta africana) and African forest ele- standing elephant space use and the drivers of ranging patterns is
phants (Loxodonta cyclotis) can live in most ecosystems in Africa, critical to future conservation and land use planning efforts.
from semi-deserts to tropical swamp forests and from lowlands to In this study, we examined the correlates of the home ranges
montane habitats. Elephants typically have large ranges that of 229 individual elephants across Africa. Using data collected at
Current Biology 31, 1–9, June 7, 2021 ª 2021 The Authors. Published by Elsevier Inc. 1
This is an open access article under the CC BY-NC-ND license (http://creativecommons.org/licenses/by-nc-nd/4.0/).Please cite this article in press as: Wall et al., Human footprint and protected areas shape elephant range across Africa, Current Biology (2021), https://
doi.org/10.1016/j.cub.2021.03.042
ll
OPEN ACCESS Report
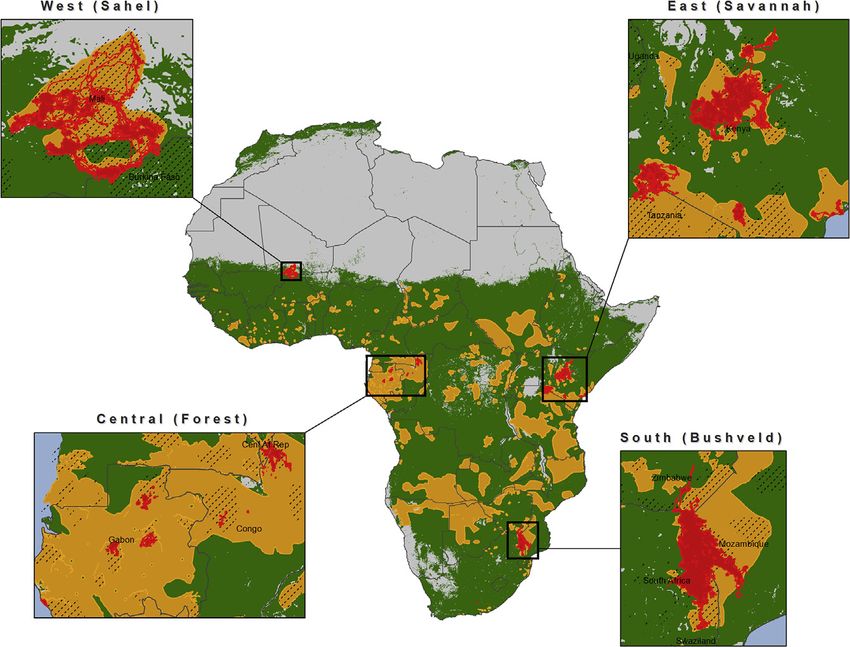
Figure 1. A habitat suitability model for
elephants
From the range of conditions encountered by the
tracked elephants over 16-day periods, an HSM
was extrapolated to each kilometer square grid of
Africa (shown in green). Currently, 18,169,219 km2
is suitable range for elephants, which is 62% of the
whole continent but for extreme deserts, cities,
and high mountain tops. Of the HSM, 85% falls
outside of protected areas. It was the likely range
of elephants two millennia before the present. The
current elephant range (orange) is 3,132,238 km2,
according to the African Elephant Specialist
Group,5 of which 57% falls outside of protected
areas. The combined elliptical time-density 90th
percentile ranges (red), of our sample of 229
collared elephants is 72,113 km2. The protected
area boundaries (black hatched areas on the inset
maps) are from the World Database on Protected
Areas (WDPA).15
range size, annual ranges followed this
pattern: Sahel (median = 426.8 km2,
IQR = 319.1–586.7 km2), bushveld (me-
19 sites across the 4 primary biomes located in Africa—Sahel dian = 231.4 km2, IQR = 157.6–350.6 km2), savannah (median =
(west), forest (central), savannah (east), and bushveld (south)— 125.8 km2, IQR = 84.4–206.9 km2), and then forest (median =
we relate space use to sex, species, and remotely sensed envi- 64.6 km2, IQR = 25.2–131.3 km2). Sixteen-day elephant range
ronmental and anthropogenic variables. We asked three ques- sizes followed a similar pattern: Sahel (median = 25.1 km2,
tions about continental ranging patterns of African elephants. IQR) = 14.2–45.4 km2), bushveld (median = 24.6 km2, IQR =
Question 1: how do elephant home ranges vary in size across 13.6–45.6 km2), savannah (median = 16.4 km2, IQR = 9.7–
sexes, species, and biome? Question 2: how influential are (i) in- 27.2 km2), and finally forest (median = 11.1 km2, IQR = 6.51–
dividual (sex and species); (ii) biotic (vegetation productivity 18.70 km2).
and tree cover); (iii) abiotic (surface temperature, rainfall, The single largest annual ETD range was 1,130.3 km2 (a male in
water, and slope); and (iv) anthropogenic (aggregate human in- Kruger, South Africa). The single smallest annual ETD range was
fluence and protected area use) factors on elephant range 8.4 km2 (a female in Loango, Gabon). The single largest 16-day
size? Question 3: how much suitable elephant habitat remains ETD range was 598 km2 (a male in Gourma, Mali); the single small-
across Africa and how much of this suitable habitat is currently est 16-day ETD range was 0.16 km2 (a male in Laikipia, Kenya).
occupied? Our top models of 16-day and annual ranges, based on the
Elliptical time-density (ETD)8 90th percentile range areas were Corrected Akaike’s Information Criterion (AICc)16,17 weights (Ta-
calculated at 19 sites, representing the major biomes where Af- ble 1), designed to address question 2 (how influential are individ-
rican elephants are found (Figure 1). The area covered by these ual, biotic, abiotic, and anthropogenic factors on elephant range
combined individual ranges was 72,113 km2, approximately size?), demonstrated that factors influencing space-use differed
2.1% of the current, estimated total continental range of African across these two temporal scales. At annual timescales, only in-
elephants (i.e., ‘Known’ + ‘Possible’ = 3,366,405 km2).5 A total of dividual and anthropogenic factors were retained in the final
31% (22,289 km2) of measured individual ranges fell outside of model (Table 1; Figure 2). The top annual range model had an
protected areas, primarily in East and West Africa. AICc weight of 0.829 compared with that of the next highest
In answer to question 1 (how do elephant home ranges vary in ranked model, which had a weight of 0.124 (Table 1). Range
size across sexes, species, and biome?), male elephant annual size decreased with increasing protected area intersection (PAI)
ranges (median = 189.6 km2, interquartile range (IQR) = 112.5– and human footprint index (HFI) (Figure 2). Range sizes of
288.8 km2) were larger than for females (median = 153.0 km2, L. cyclotis were again smaller than those of L. africana and annual
IQR = 108.4–255.1 km2); however, 16-day female ranges ranges of males were larger than those of females (Table S6).
(median = 19.9 km2, IQR = 11.7–32.6 km2) were marginally In contrast, the top 16-day range model included all individual,
larger than for males (median = 18.4 km2, IQR = 10.2–34.5 km2). biotic, abiotic, and anthropogenic factors except sex (Table 1).
Between species, savannah elephants had larger annual This model had an AICc weight of 0.604 compared with 0.221
(median = 172.9 km2, IQR = 112.8–281.0 km2) ranges than did for the next highest AICc-ranked model (Table 1), and the only dif-
forest elephants (median = 64.6 km2, IQR = 25.2–131.3 km2), ference between the top two models being the exclusion of the
and also had larger 16-day ranges (median = 19.3 km2, IQR = sex parameter, demonstrating 16-day ranges were not signifi-
11.0–33.5 km2) than did forest elephants (median = 11.1 km2, cantly affected by the sex of the animal. Range size increased
IQR = 6.5–18.7 km2). Across biomes, in order of decreasing with higher values of permanent water intersection (WATER),
2 Current Biology 31, 1–9, June 7, 2021Please cite this article in press as: Wall et al., Human footprint and protected areas shape elephant range across Africa, Current Biology (2021), https://
doi.org/10.1016/j.cub.2021.03.042
ll
Report OPEN ACCESS
Table 1. Annual and 16-day model selection
Timescale Model name Specification AICc delta weight
annual m_anthro_indv LOG(RANGE) SPECIES + PAI + HFI + SEX 373.8 0.00 0.829
annual m_anthro LOG(RANGE) PAI + HFI 377.6 3.80 0.124
annual m_full LOG(RANGE) SPECIES + PAI + HFI + SEX + 380.5 6.64 0.030
NDWI + TRMM + NDVI + SLOPE + WATER
16-day m_biotic_abiotic_ LOG(RANGE) SPECIES + WATER + PAI + 18,662.5 0.00 0.604
anthro_species NDVI + HFI + LST + SLOPE + TRMM + TREE
16-day m_full LOG(RANGE) SPECIES + WATER + PAI + 18,664.5 2.01 0.221
NDVI + HFI + LST + SLOPE + TRMM +SEX + TREE
16-day m_biotic_abiotic_ LOG(RANGE) WATER + PAI + NDVI + HFI + 18,665.0 2.49 0.174
anthro_sex LST + SLOPE + TRMM + TREE + SEX
Model selection table showing the top three models defining competing hypotheses of the relationship between log-transformed annual and 16-day
elephant range areas and environmental, anthropogenic, and endogenous covariates. The top selected annual model (m_anthro_indv) contains only
anthropogenic, sex, and species covariates, whereas the top selected 16-day model (m_biotic_abiotic_anthro_species) contains abiotic, biotic,
anthropogenic, and species covariates (coefficient values presented in Table S6).
normalized difference vegetation index (NDVI), land surface tem- behaviors; females move in family units, focus on rearing young,
perature (LST), and tropical rainfall monitoring mission estimated and tend to take fewer risks than more solitary males who also
precipitation rates (TRMM), whereas it decreased with increasing move further during their musth period.30,31 These differences
PAI, HFI, topographic slope (SLOPE), and percent tree cover in size and sociality can manifest as markedly different foraging
(TREE) (Figure 3; Table S6). Model outputs also showed that and spatial strategies,32,33 which our analysis shows in sex-
range sizes of L. cyclotis were smaller than those of L. africana based differences in annual elephant range sizes (Figure 2; Table
(Figure 3; Table S6), as summarized above. S6). However, over shorter 16-day durations, sex differences in
To answer question 3, (how much suitable elephant habitat re- ranging area were not apparent (Figure 3; Table S6).
mains across Africa and how much of this suitable habitat is In addition to sexual differences, elephants are highly individ-
currently occupied?), we calculated the min-max range of covar- ual in their space-use,11,34 as represented by the high contribu-
iate values encountered by any subject within the 16-day ranges tion of the individual ID random effects to the overall variance.
across the continent (Table S5) and used these as inputs in an Despite such variation, forest elephants had overall smaller
elephant habitat suitability model (HSM) (Figure 1). The HSM pre- ranges than savannah elephants. This difference likely reflects
dicts a potential elephant distribution of 18,169,219 km2 (i.e., less need to move far in the more productive forest biome. In
62% of the African land mass). The habitats suitable for ele- addition, frugivory is common and highly nutritious.35,36 Greater
phants cover almost the whole of Africa, with the exception of productivity, or more specific knowledge of fruiting tree loca-
extreme habitats such as the Sahara, Danakil, Kalahari, and Na- tions, and the seasonal nature of fruiting appears to drive more
mib deserts; cities; towns; and high mountain tops. Of the HSM focused space-use among forest elephants.
area, just 17.2% is occupied by the African Elephant Specialist
Group of the International Union for Conservation of Nature’s Biotic, abiotic, and anthropogenic drivers of range size
(IUCN) map of ‘‘known and possible ranges.’’ We found that two anthropogenic factors—human footprint and
protected area intersection—were dominant in explaining annual
DISCUSSION range sizes. These covariates were also instrumental in models
of 16-day range sizes, for which environmental factors were
Here, we provide a trans-continental comparative analysis of included in the top model. This demonstrates that the areas
elephant ranging behavior on the basis of GPS tracking data where elephants are located (represented by the annual range
across a diversity of habitats, from rainforest to savannahs, and area) are primarily structured by human presence and activity
arid semi-deserts in Africa, covering nearly the full range of condi- on the landscape, and it is only within those ranges that other
tions experienced by savannah and forest elephants. By assessing environmental conditions start to influence elephant spatial
covariates thought to drive movements, across 19 distinct sites patterns. The dominance of anthropogenic factors in affecting
and hundreds of individuals, this study provides a comprehensive wildlife movement is increasingly common in species-level
assessment for African elephants of their current space-use. Our analyses.4,9,11,37–40
analysis was made possible by the advent of the global scale Previous work suggests that there might be thresholds of hu-
remote-sensing Google Earth Engine platform28 combined with man density above which elephants and humans cannot
our own custom analysis tools29 (www.movementecology.net) to coexist.14 Our analysis identified HFI thresholds above which
calculate elephant ranges over multiple temporal scales and link no collared elephants ranged (i.e., an HFI of 31.5 was the highest
each range area with a series of remotely sensed covariates. of any 16-day range value). These thresholds differed by loca-
tion, which we attribute to differences in elephants’ perception
Sex, species, and site variation in elephant range size of risk to local human behavior. At different locations, human
African elephants show a high-degree of sexual dimorphism land-use and tolerance of elephants vary, as does the degree
(males 5/3 the size of females) and differing sexually based social of enforcement of legal protection. A high human footprint in
Current Biology 31, 1–9, June 7, 2021 3Please cite this article in press as: Wall et al., Human footprint and protected areas shape elephant range across Africa, Current Biology (2021), https://
doi.org/10.1016/j.cub.2021.03.042
ll
OPEN ACCESS Report
365
315
Range Area (Sq.Km)
265
215
165
115
65
15
0 5 10 15
HFI
365
315
Range Area (Sq.Km)
265
215
165
115
65
15
0.00 0.25 0.50 0.75 1.00
PAI
Female.Forest Elephant
Male.Forest Elephant
Female.Savannah Elephant
Male.Savannah Elephant
Figure 2. Annual elliptical time-density (ETD) 90th percentile range model
Variation in range sizes for both savannah and forest, and male and female elephants in relation to HFI) and PAI. Savannah elephants have larger ranges than
forest elephants, and in both species, males have larger ranges than females. In both species, and for both sexes, range sizes decrease as HFI and PAI increase.
We used the top selected annual range model (Table 1) to predict elephant range sizes (solid lines) across the support of a given continuous covariate (Table S5)
while holding all other continuous covariates at their mean values. Model 95th percentile confidence intervals (dashed lines) were simulated by using random
draws from the model parameter multivariate normal distribution.
4 Current Biology 31, 1–9, June 7, 2021Please cite this article in press as: Wall et al., Human footprint and protected areas shape elephant range across Africa, Current Biology (2021), https://
doi.org/10.1016/j.cub.2021.03.042
ll
Report OPEN ACCESS
25 25 25
Range Area (Sq.Km)
Range Area (Sq.Km)
Range Area (Sq.Km)
20 20 20
15 15 15
10 10 10
5 5 5
0.0 0.2 0.4 0.6 0.8 0 20 40 60 80 0 20 40 60 80
NDVI TREE WATER
25 25 25
Range Area (Sq.Km)
Range Area (Sq.Km)
Range Area (Sq.Km)
20 20 20
15 15 15
10 10 10
5 5 5
0 30 60 90 120 10 20 30 40 50 0.0 2.5 5.0 7.5 10.0 12.5
TRMM LST SLOPE
25 25
Range Area (Sq.Km)
Range Area (Sq.Km)
20 20
15 15 Forest Elephant
Savannah Elephant
10 10
5 5
0 10 20 30 0.00 0.25 0.50 0.75 1.00
HFI PAI
Figure 3. 16-Day elliptical time-density (ETD) 90th percentile range model
Variation in range sizes for both savannah and forest Elephants in relation to eight covariates. Range increases are associated with increases in NDVI,18,19
permanent water availability (WATER),20 rainfall (TRMM),21 and LST.22 TREE23,24 has little effect on elephant range. Elephant range decreases are associated with
increases in slope (SLOPE),25 the HFI,15,26,27 and the PAI. We used the top selected model (Table 1) to predict elephant range sizes (solid lines) across the support
of each successive continuous covariate (Table S5) while holding all other covariates at their mean values. Model 95th percentile confidence intervals (dashed
lines) were simulated by using random draws from the model parameter multivariate normal distribution.
an elephant range also implies that people have easy access to out of the top model for annual range). Similar relationships have
elephant range, which might facilitate killing for ivory. This human been found in other, population-specific studies of elephants,
predation itself might drive changes in elephant behavior; for which is thought to stem from dry season tethering to permanent
example, both forest and savannah elephants become more water in arid and savannah systems.47 Relatedly, water availabil-
nocturnal in response to poaching.41,42 ity was positively associated with range size, suggesting where
Our analysis demonstrated that range sizes were smaller for water was largely available, elephants ranged more broadly.
individuals whose ranges were contained more within protected These relationships were weaker in forest sites, where water is
areas, at both the annual and the 16-day time scales. Elephants plentiful and not a limiting factor. Increased rainfall at the 16-
often choose protected areas on account of the greater safety day resolution was also associated with larger range sizes, though
therein. In addition, protected areas might often supply undis- the effect was less than that of permanent water availability. Over-
turbed habitat and safe access to water.43 Some protected all, this is consistent with results from other studies showing ele-
areas also constrain elephant distribution by fences, such as phants range more broadly when water and food are more widely
the Kruger National Park and private conservancies both in available in the rainy season.48–50 Interestingly, elephant range
South Africa and Kenya, though we lacked a data layer on fences sizes also increased with temperature. We speculate that this
to analyze this variable across Africa. Finally, protected areas might be related to evapotranspiration, given its correlation with
can promote a high human footprint along their boundaries,44,45 temperature, which can amplify seasonal contrasts in water avail-
which could also add to compression of elephant ranges within ability and productivity. Sixteen-day range size decreased with
protected areas. topographic slope, probably reflecting the avoidance of steep
Within the annual range of the elephants studied, short-term slopes because of the difficulty of moving across steep terrain
16-day range use was driven by a diversity of environmental co- and the energy required to do so.51
variates in addition to human factors. In contrast with theoretical
models suggesting that movement, and ultimately space-use, Geographical and historical conditions underpinning
should be lower where forage availability is higher,46 elephants elephant range use
increased their movement and range sizes with increasing pro- From the 16-day analysis, using the range of covariates under
ductivity over the shorter 16-day periods (although NDVI dropped which the tracked elephants live, we derived a habitat suitability
Current Biology 31, 1–9, June 7, 2021 5Please cite this article in press as: Wall et al., Human footprint and protected areas shape elephant range across Africa, Current Biology (2021), https://
doi.org/10.1016/j.cub.2021.03.042
ll
OPEN ACCESS Report
model by using Google Earth Engine to measure the conditions implemented.11,56 Development scenarios that accommodate
in each kilometer square in Africa. It amounted to a potential the spatial needs of wildlife leaving large, low-human-impact
elephant range of 18,169,219 km2 covering 62% of the entire areas of intact habitat, and especially formally protected areas,
continent, excepting extreme habitats such as the Sahara, Ka- are urgently needed.57 In the face of increasing human pres-
lahari, and Danakil deserts, urban areas, and high mountain- sures, proactive landscape planning at the local, national, and
tops. This represents areas likely occupied historically, high- continental scales are critical, as well as fostering an ethic of
lighting that this generalist species can occupy the majority of human-elephant coexistence if the future of elephants is to
ecosystems in Africa. By contrast, the African Elephant be secured. Is that too much to ask, in order to protect and
Specialist Group of IUCN’s map of ‘‘known and possible conserve this signature animal even in a world where human
ranges’’ today shows a range of 3,129,540 km2 or 17.2% of well-being is paramount?
the projected potential range that elephants probably once
occupied. Of the habitat suitability model, 85% falls outside STAR+METHODS
of protected areas whereas 57.4% of the Specialist Group’s
elephant range map falls outside of protected areas, suggest- Detailed methods are provided in the online version of this paper
ing elephants need areas larger than currently allocated for and include the following:
wildlife.
The existence of elephants in North Africa was well-known in d KEY RESOURCES TABLE
classical times. The Phoenician navigator Hanno (500 BCE) d RESOURCE AVAILABILITY
saw elephants on the Atlantic coast of Africa. Herodotus (484– B Lead contact
413 BCE) wrote of elephants in mountainous and thickly wooded B Materials availability
land to the West of Lake Triton (in present day Tunisia). The re- B Data and code availability
cord of extirpation of North African elephants was evident in d EXPERIMENTAL MODEL AND SUBJECT DETAILS
the first century AD when Pliny the Elder wrote that ‘‘an ample B Ethics statement
supply of teeth (ivory) can now scarcely be found outside of In- B Extended acknowledgments
dia, the rest in our part of the world (North Africa) yielding to its B Forest
appetite for luxury.’’1 Previously, North African elephants were B Savannah
found from present day Agadir to Tunis. Our habitat suitability B Sahel
model indicates that almost exactly the same stretch of the Med- d METHOD DETAILS
iterranean littoral where elephants once existed is still suitable B GPS collar data
habitat today. B Study sites
At the other end of the continent, Europeans first settled in the B Elliptical time-density ranges
Cape in the 17th century where elephants abounded. In the next B Covariates
250 years, hunting for ivory caused their near extinction from the d QUANTIFICATION AND STATISTICAL ANALYSIS
southern tip of the continent to the Zambezi river.2 Our model B Model specification
shows all of this stretch of Southern Africa, except for the Kala- B Model selection
hari Desert, remains suitable habitat. B Habitat suitability model
In West Africa, from the genetic analysis of ivory recovered
from a Portuguese shipwreck in the 16th century, there is evi- SUPPLEMENTAL INFORMATION
dence of a reduction in genetic diversity compared with the
genome of modern elephants,52 and this is attributed to the Supplemental information can be found online at https://doi.org/10.1016/j.
cub.2021.03.042.
excessive killing of West African elephants. Likewise, in East
Africa in the 19th century, large areas were emptied of ele-
ACKNOWLEDGMENTS
phants because of the ivory and slave trade.53 Given the
disparity between suitable elephant range and their actual The authors thank the European Commission (EC-MTKD-CT-2005-029893—
range today, our data suggest that habitat incompatibility is un- SEARS, Spatial Economics and Remote Sensing of Elephant Resources) for
likely to have been the cause of the elephant decline. It was funding a key meeting, and the Department of Zoology, Oxford University,
most likely driven historically by human beings through exces- for hosting it. The research was also supported financially by a Canadian Na-
sive killing for ivory. tional Science and Research Council (NSERC) PGSD3 (348450) award. The
data were contributed by numerous colleagues researching elephant move-
Our analysis demonstrates the fundamental role that humans
ments across Africa. We thank the range state governments, research author-
currently play in shaping African elephant ranges at the conti- ities, and wildlife departments from Congo, Gabon, Central African Republic,
nental scale. The human footprint is increasing at an acceler- Mali, Kenya, and South Africa. We also thank the African Elephant Conserva-
ated rate and expected to double by 2050 (https://population. tion Fund of the United States Fish and Wildlife Service (USFWS); the United
un.org/wpp/Publications/), with between 50%–70% of the States Agency for International Development Central Africa Regional Program
planet already experiencing anthropogenic disturbance.10,54 for the Environment (USAID CARPE); the Especes Phares Project; the Central
Fragmentation of wildlife habitats by humans has resulted in African Protected Areas Network of the European Union; Operation Loango;
the Wildlife Conservation Society (WCS), Save the Elephants; the World
only 7% of wildlife habitat patches being larger than
Wide Fund For Nature-US; the Society for Conservation and Development;
100 km.2,55 Clearly, if elephants are to persist in Africa, the the Columbus Zoo; the Mara Elephant Project; the Safaricom Foundation;
spatial infrastructure driving socioeconomic development the Darwin Initiative; the WILD Foundation; Paul van Vlissingen; Caroline Tis-
(e.g., roads and railways), must be strategically planned and dall; Susannah Rouse; the Sidekick Foundation; University of South Africa
6 Current Biology 31, 1–9, June 7, 2021Please cite this article in press as: Wall et al., Human footprint and protected areas shape elephant range across Africa, Current Biology (2021), https://
doi.org/10.1016/j.cub.2021.03.042
ll
Report OPEN ACCESS
(UNISA), and the Wildlife and Environmental Society of South Africa; the scien- 11. Blake, S., Deem, S.L., Strindberg, S., Maisels, F., Momont, L., Isia, I.-B.,
tists who collaborated; and the guardians of national parks and national re- Douglas-Hamilton, I., Karesh, W.B., and Kock, M.D. (2008). Roadless wil-
serves across Africa. derness area determines forest elephant movements in the Congo Basin.
PLoS ONE 3, e3546.
AUTHOR CONTRIBUTIONS 12. Douglas-Hamilton, I., Krink, T., and Vollrath, F. (2005). Movements and
corridors of African elephants in relation to protected areas.
J.W. helped conceive the study, ran analyses, wrote analysis code, helped Naturwissenschaften 92, 158–163.
collect tracking data in West and East Africa, and co-wrote manuscript.
13. Wall, J., Wittemyer, G., Klinkenberg, B., LeMay, V., and Douglas-Hamilton,
G.W. helped conceive the study, helped with analyses, helped collect tracking
I. (2013). Characterizing properties and drivers of long distance move-
data in East Africa, and co-wrote manuscript. B.K. helped conceive the study,
ments by elephants (Loxodonta africana) in the Gourma, Mali. Biol.
helped with analyses, and edited the manuscript. V.L. helped with statistical
Conserv. 157, 60–68.
analyses and edited the manuscript. S.B. helped conceive the study, helped
collect tracking data in Central Africa, and edited manuscript. S.S. helped 14. Hoare, R.E., and Du Toit, J.T. (1999). Coexistence between people and el-
conceive the study, helped with statistical analyses, and edited manuscript. ephants in African savannas. Conserv. Biol. 13, 633–639.
M.H. helped conceive the study, helped with analyses, performed all fund- 15. IUCN and UNEP-WCMC (2013). The World Database on Protected Areas
raising and data collection in Southern Africa, and edited manuscript. F.V. (WDPA) (www.protectedplanet.net, Accessed: Aug 30, 2013) (Protected
helped conceive the study, helped with funding, and co-wrote the manuscript. Planet).
F.M. helped collect tracking data in Central Africa and edited manuscript. J.F. 16. Burnham, K.P., and Anderson, D.R. (2002). Model Selection and
helped conceive the study, helped with funding, and helped with analyses. MultiModel Inference: A Practical Information-Theoretic Approach,
I.D.-H. helped conceive the study; helped with tracking data collection and Second Edition (Springer-Verlag New York, Inc.).
funding in West, East, and South Africa; and co-wrote the manuscript.
17. Akaike, H. (1974). A New Look at the Statistical Model Identification. IEEE
Trans. Automat. Contr. 19, 716–723.
DECLARATION OF INTERESTS
18. Huete, A., Didan, K., Miura, T., Rodriguez, E.P., Gao, X., and Ferreira, L.G.
(2002). Overview of the radiometric and biophysical performance of the
The authors declare no competing interests.
MODros. Inf. Serv. vegetation indices. Remote Sens. Environ. 83,
195–213.
Received: December 29, 2020
Revised: February 5, 2021 19. NASA LP DAAC (2017). MODros. Inf. Serv. MCD43A4 (NDVI): MODros. Inf.
Accepted: March 11, 2021 Serv./Terra and Aqua Nadir BRDF-Adjusted Reflectance Daily L3 Global
Published: April 1, 2021 500 m SIN Grid. Version 5 (NASA EOSDros. Inf. Serv. Land Processes
DAAC, USGS Earth Resources Observation and Science (EROS)
REFERENCES Center). https://lpdaac.usgs.gov.
20. Pekel, J.-F., Cottam, A., Gorelick, N., and Belward, A.S. (2016). High-res-
1. Plinius Secundus Maior, C., Mayhoff, K.F.T., and Maior, C.P.S. (1906). olution mapping of global surface water and its long-term changes. Nature
Naturalis Historiae (Teubner). 540, 418–422.
2. Bryden, H.A. (1903). The Decline and Fall of the South African Elephant. 21. NASA GSFC (2017). Tropical Rainfall Monitoring Mission (TRRMM)
Fortnightly Review 73, 100–108. 2F3B42 3-Hour 0.25-degree product. Version 7. (NASA Goddard Space
3. Douglas-Hamilton, I. (1987). African elephants: population trends and their Flight Centre. https://trmm.gsfc.nasa.gov/.
causes. Oryx 21, 11–24. 22. NASA LP DAAC (2017). MODros. Inf. Serv./Terra MOD11A2 Land
4. Maisels, F., Strindberg, S., Blake, S., Wittemyer, G., Hart, J., Williamson, Surface Temperature/Emissivity 8-Day L3 Global 1 km SIN Grid.
E.A., Aba’a, R., Abitsi, G., Ambahe, R.D., Amsini, F., et al. (2013). Version 5 (NASA EOSDros. Inf. Serv. Land Processes DAAC, USGS
Devastating decline of forest elephants in central Africa. PLoS ONE 8, Earth Resources Observation and Science (EROS) Center). https://
e59469. lpdaac.usgs.gov.
5. Thouless, C.R., Dublin, H.T., Blanc, J.J., Skinner, D.P., Daniel, T.E., Taylor, 23. Carroll, M., Townshend, J., Hansen, M., DiMiceli, C., Sohlberg, R., and
R.D., Maisels, F., Frederick, H.L., and Bouche , P. (2016). African Elephant Wurster, K. (2011). MODros. Inf. Serv. Vegetative Cover Conversion and
Status Report 2016: An update from the African Elephant Database Vegetation Continuous Fields. In Land Remote Sensing and Global
(Occasional Paper Series of IUCN Species Survival Commission, No. 60 Environmental Change: NASA’s Earth Observing System and the
IUCN/SSC African Elephant Specialist Group. Science of ASTER and MODros. Inf. Serv, B. Ramachandran, C.O.
6. Robson, A.S., Trimble, M.J., Purdon, A., Young-Overton, K.D., Pimm, S.L., Justice, and M.J. Abrams, eds. (Springer-Verlag), p. 873.
and van Aarde, R.J. (2017). Savanna elephant numbers are only a quarter 24. NASA LP DAAC (2017). MODros. Inf. Serv. MOD44B: MODros. Inf. Serv./
of their expected values. PLoS ONE 12, e0175942. Terra Vegetation Continuous Fields Yearly L3 Global 250 m SIN Grid.
7. Wittemyer, G., Northrup, J.M., Blanc, J., Douglas-Hamilton, I., Omondi, Version 5.1 (NASA EOSDros. Inf. Serv. Land Processes DAAC, USGS
P., and Burnham, K.P. (2014). Illegal killing for ivory drives global Earth Resources Observation and Science (EROS) Center). https://
decline in African elephants. Proc. Natl. Acad. Sci. USA 111, 13117– lpdaac.usgs.gov.
13121. 25. Kobrick, M., and Crippen, R. (2013). NASA Shuttle Radar Topography
8. Wall, J., Wittemyer, G., LeMay, V., Douglas-Hamilton, I., and Klinkenberg, Mission 1 arcsecond Global Digital Elevation Model (HDF-EOS).
B. (2014). Elliptical Time-Density model to estimate wildlife utilization dis- 26. Sanderson, E.W., Jaiteh, M., Levy, M.A., Redford, K.H., Wannebo, A.V.,
tributions. Methods Ecol. Evol. 5, 780–790. and Woolmer, G. (2002). The Human Footprint and the Last of the Wild.
9. Tucker, M.A., Böhning-Gaese, K., Fagan, W.F., Fryxell, J.M., Van Moorter, Bioscience 52, 891.
B., Alberts, S.C., Ali, A.H., Allen, A.M., Attias, N., Avgar, T., et al. (2018). 27. Venter, O., Sanderson, E.W., Magrach, A., Allan, J.R., Beher, J.,
Moving in the Anthropocene: Global reductions in terrestrial mammalian Jones, K.R., Possingham, H.P., Laurance, W.F., Wood, P., Fekete,
movements. Science 359, 466–469. B.M., et al. (2016). Sixteen years of change in the global terrestrial
10. Barnosky, A.D., Hadly, E.A., Bascompte, J., Berlow, E.L., Brown, human footprint and implications for biodiversity conservation. Nat.
J.H., Fortelius, M., Getz, W.M., Harte, J., Hastings, A., Marquet, Commun. 7, 12558.
P.A., et al. (2012). Approaching a state shift in Earth’s biosphere 28. Hansen, M.C., Potapov, P.V., Moore, R., Hancher, M., Turubanova, S.A.,
486, 52–58. Tyukavina, A., Thau, D., Stehman, S.V., Goetz, S.J., Loveland, T.R., et al.
Current Biology 31, 1–9, June 7, 2021 7Please cite this article in press as: Wall et al., Human footprint and protected areas shape elephant range across Africa, Current Biology (2021), https://
doi.org/10.1016/j.cub.2021.03.042
ll
OPEN ACCESS Report
(2013). High-resolution global maps of 21st-century forest cover change. African elephants: a contribution to conservation behavior. Behav. Ecol.
Science 342, 850–853. Sociobiol. 61, 1919–1931.
29. Wall, J. (2014). ArcMET: Movement Ecology Tools for ArcGIS. In 49. Western, D., and Lindsay, W.K. (1984). Seasonal herd dynamics of a
Symposium on Animal Movement and the Environment. savanna elephant population. Afr. J. Ecol. 22, 229–244.
30. Rasmussen, H.B. (2005). PhD Thesis: Reproductive tactics in male 50. Young, K.D., Ferreira, S.M., and Van Aarde, R.J. (2009). Elephant
African savannah elephants (Loxodonta africana) (Oxford spatial use in wet and dry savannas of southern Africa. J. Zool.
University). 278, 189–205.
31. Taylor, L.A., Vollrath, F., Lambert, B., Lunn, D., Douglas-Hamilton, I., and 51. Wall, J., Douglas-Hamilton, I., and Vollrath, F. (2006). Elephants avoid
Wittemyer, G. (2020). Movement reveals reproductive tactics in male ele- costly mountaineering. Curr. Biol. 16, R527–R529.
phants. J. Anim. Ecol. 89, 57–67. 52. de Flamingh, A., Coutu, A., Sealy, J., Chirikure, S., Bastos, A.D.S.,
32. Shannon, G., Page, B.R., Duffy, K.J., and Slotow, R. (2006). The role of Libanda-Mubusisi, N.M., Malhi, R.S., and Roca, A.L. (2020). Sourcing
foraging behaviour in the sexual segregation of the African elephant. Elephant Ivory from a Sixteenth-Century Portuguese Shipwreck. Curr.
Oecologia 150, 344–354. Biol. 621–628.
33. Lindsay, K. (2011). Habitat Use, Diet Choice, and Nutritional Status 53. Alpers, E.A. (1975). Ivory and Slaves: Changing Pattern of International
in Female and Male Amboseli Elephants. In The Amboseli Elephants: Trade in East Central Africa to the Later Nineteenth Century (University
A Long-term perspective on a long-lived mammal, C.J. Moss, H. of California Press).
Croze, and P. Lee, eds. (The University of Chicago Press), 54. Bar-On, Y.M., Phillips, R., and Milo, R. (2018). The biomass distribution on
pp. 51–73. Earth. Proc. Natl. Acad. Sci. USA 115, 6506–6511.
34. Bastille-Rousseau, G., and Wittemyer, G. (2019). Leveraging multidimen- 55. Ibisch, P.L., Hoffmann, M.T., Kreft, S., Pe’er, G., Kati, V., Biber-
sional heterogeneity in resource selection to define movement tactics of Freudenberger, L., DellaSala, D.A., Vale, M.M., Hobson, P.R., and Selva,
animals. Ecol. Lett. 22, 1417–1427. N. (2016). A global map of roadless areas and their conservation status.
35. Campos-Arceiz, A., and Blake, S. (2011). Megagardeners of the forest - Science 354, 1423–1427.
the role of elephants in seed dispersal. Acta Oecol. 37, 542–553. 56. Laurance, W.F., Clements, G.R., Sloan, S., O’Connell, C.S., Mueller,
36. Schuttler, S.G., Blake, S., and Eggert, L.S. (2012). Movement Patterns and N.D., Goosem, M., Venter, O., Edwards, D.P., Phalan, B., Balmford,
Spatial Relationships Among African Forest Elephants. Biotropica 44, A., et al. (2014). A global strategy for road building. Nature 513,
445–448. 229–232.
37. Barnes, R.F.W., Barnes, K.L., Alers, M.P.T., and Blom, A. (1991). Man de- 57. Laurance, W.F., and Arrea, I.B. (2017). Roads to riches or ruin? Science
termines the distribution of elephants in the rain forests of northern Gabon. 358, 442–444.
Afr. J. Ecol. 29, 54–63. 58. Lee, P.C., Sayialel, S., Lindsay, W.K., and Moss, C.J. (2012). African
38. Bastille-Rousseau, G., Wall, J., Douglas-Hamilton, I., Lesowapir, B., elephant age determination from teeth: Validation from known individuals.
Loloju, B., Mwangi, N., and Wittemyer, G. (2019). Landscape-scale Afr. J. Ecol. 50, 9–20.
habitat response of African elephants shows strong selection for 59. Worton, B.J. (1989). Kernel Methods for Estimating the Utilization
foraging opportunities in a human dominated ecosystem. Ecography Distribution in Home-Range Studies. Ecology 70, 164–168.
43, 149–160.
60. Mohr, C.O. (1947). Table of equivalent populations of North American
39. de Boer, W.F., van Langevelde, F., Prins, H.H.T., de Ruiter, P.C., Blanc, J., small mammals. Am. Midl. Nat. 37, 223–249.
Vis, M.J.P., Gaston, K.J., and Douglas-Hamilton, I. (2013). Understanding
61. Gao, B.C. (1996). NDWI - A normalized difference water index for remote
spatial differences in African elephant densities and occurrence, a conti-
sensing of vegetation liquid water from space. Remote Sens. Environ. 58,
nent-wide analysis. Biol. Conserv. 159, 468–476.
257–266.
40. Roever, C.L., van Aarde, R.J., and Chase, M.J. (2013). Incorporating mor-
62. NASA LP DAAC (2017). MODros. Inf. Serv. MCD43A4 (NDWI): MODros.
tality into habitat selection to identify secure and risky habitats for
Inf. Serv./Terra and Aqua Nadir BRDF-Adjusted Reflectance Daily L3
savannah elephants. Biol. Conserv. 164, 98–106.
Global 500 m SIN Grid. Version 5 (NASA EOSDros. Inf. Serv. Land
41. Breuer, T., Maisels, F., and Fishlock, V. (2016). The consequences of Processes DAAC, USGS Earth Resources Observation and Science
poaching and anthropogenic change for forest elephants. Conserv. Biol. (EROS) Center). https://lpdaac.usgs.gov.
30, 1019–1026.
63. NASA LP DAAC (2017). MODros. Inf. Serv. MCD43A4 (EVI): MODros. Inf.
42. Ihwagi, F.W., Thouless, C., Wang, T., Skidmore, A.K., Omondi, P., and Serv./Terra and Aqua Nadir BRDF-Adjusted Reflectance Daily L3 Global
Douglas-Hamilton, I. (2018). Night-day speed ratio of elephants as indica- 500 m SIN Grid. Version 5 (NASA EOSDros. Inf. Serv. Land Processes
tor of poaching levels. Ecol. Indic. 84, 38–44. DAAC, USGS Earth Resources Observation and Science (EROS)
43. Loarie, S.R., Aarde, R.J.V., and Pimm, S.L. (2009). Fences and artificial Center). https://lpdaac.usgs.gov.
water affect African savannah elephant movement patterns. Biol. 64. Carter, N., Williamson, M., Gilbert, S., Lischka, S., Prugh, L., Lawler, J.,
Conserv. 142, 3086–3098. Metcalf, A., Jacob, A., Beltrán, B., Castro, A.J., et al. (2019). Integrated
44. Douglas-Hamilton, I. (1972). On the ecology and behaviour of the African spatial analysis for human-wildlife coexistence in the American West.
elephant. https://www.worldcat.org/title/on-the-ecology-and-behaviour- Environ. Res. Lett. 15, 021001..
of-the-african-elephant-the-elephants-of-lake-manyara/oclc/17554601. 65. de Beer, Y., and van Aarde, R.J. (2008). Do landscape heteroge-
45. Wittemyer, G., Elsen, P., Bean, W.T., Burton, A.C.O., and Brashares, J.S. neity and water distribution explain aspects of elephant home
(2008). Accelerated human population growth at protected area edges. range in southern Africa’s arid savannas? J. Arid Environ. 72,
Science 321, 123–126. 2017–2025.
46. Charnov, E.L. (1976). Optimal foraging, the marginal value theorem. Theor. 66. Grainger, M., Aarde, R., and Whyte, I. (2005). Landscape heterogeneity
Popul. Biol. 9, 129–136. and the use of space by elephants in the Kruger National Park, South
47. Redfern, J.V., Grant, R., Biggs, H., and Getz, W.M. (2003). Surface-Water Africa. Afr. J. Ecol. 43, 369–375.
Constraints on Herbivore Foraging in the Kruger National Park, South 67. Gelman, A., and Hill, J.C. (2007). Data analysis using regression and multi-
Africa. Ecology 84, 2092–2107. level/hierarchical models (Cambridge University Press).
48. Wittemyer, G., Getz, W.M., Vollrath, F., and Douglas-Hamilton, I. (2007). 68. Zuur, A.F., Ieno, E.N., Walker, N.J., Saveliev, A.A., and Smith, G.M. (2009).
Social dominance, seasonal movements, and spatial segregation in Mixed effects models and extensions in ecology with R M. Gail, K.
8 Current Biology 31, 1–9, June 7, 2021Please cite this article in press as: Wall et al., Human footprint and protected areas shape elephant range across Africa, Current Biology (2021), https://
doi.org/10.1016/j.cub.2021.03.042
ll
Report OPEN ACCESS
Krickeberg, J.M. Samet, A. Tsiatis, and W. Wong, eds. (Springer New 71. Schabenberger, O., and Pierce, F.J. (2001). Contemporary statistical
York). models for the plant and soil sciences (CRC Press).
69. Pinheiro, J.C., and Bates, D. (2000). Mixed effects models in S and S-Plus 72. West, B., Welch, K.B., and Galecki, A.T. (2007). Linear Mixed Models: A
(Springer Verlag). Practical Guide Using Statistical Software, First Edition (Chapman &
70. Pinheiro, J.C., and Bates, D. (2013). R Documentation (Package: nlme - Hall/CRC).
Linear Mixed-Effects Models) lme function (URL: http://stat.ethz.ch/ 73. R Core Team R. (2018). R: A Language and Environment for Statistical
R-manual/R-patched/library/nlme/html/lme.html, Accessed: Nov 4, Computing (R Foundation for Statistical Computing. URL: http://www.
2014). r-project.org).
Current Biology 31, 1–9, June 7, 2021 9Please cite this article in press as: Wall et al., Human footprint and protected areas shape elephant range across Africa, Current Biology (2021), https://
doi.org/10.1016/j.cub.2021.03.042
ll
OPEN ACCESS Report
STAR+METHODS
KEY RESOURCES TABLE
REAGENT or RESOURCE SOURCE IDENTIFIER
Software and Algorithms
ArcMET: Movement Ecology Tools for ArcGIS Wall et al.8 www.movementecology.net
analysis_worksheet.ipynb This Paper https://github.com/walljcg/panafel
RESOURCE AVAILABILITY
Lead contact
Further information and requests for information and data related to this analysis should be directed to the lead contact: Jake Wall
(jake@maraelephantproject.org or walljcg@gmail.com).
Materials availability
This study did not generate any materials.
Data and code availability
Given the sensitive nature of the location of elephants due to the ongoing illegal killing of elephants for ivory, tracking data will be
made available upon written request to the lead author rather than made public. Analysis code used in this study is available at:
https://github.com/walljcg/panafel.
EXPERIMENTAL MODEL AND SUBJECT DETAILS
Ethics statement
All elephant captures were carried out according to the practice and authorisation of the veterinary services of the relevant range
states.
Extended acknowledgments
We thank the Google Earth Engine and Outreach teams for their support and funding in this work, in particular, Rebecca Moore, Ta-
nya Birch, Sean Askay, David Thau and Tyler Erickson. We also thank the Esri Conservation Programme especially David Gadsden,
Charles Convis, Steve Beckwitt and Esri East Africa who made Esri software available for our research.
Forest
Funding and logistical assistance
The African Elephant Conservation Fund of the United States Fish and Wildlife Service (USFWS); United States Agency for Interna-
tional Development Central Africa Regional Program for the Environment (US-AID CARPE); the Especes Phares Project and the Cen-
tral African Protected Areas Network of the European Union; Operation Loango; Wildlife Conservation Society (WCS), Save the
Elephants; World Wide Fund For NatureWWF-US; the Society for Conservation and Development, and the Columbus Zoo.
Permissions and collaboration
The research authorities and wildlife departments from Congo, Gabon, and Central African Republic; Veterinarians who put collars on:
Billy Karesh, Sharon L. Deem and Mike Kock. Congo/CR/Gabon tracking team members: Gregoire Mambeleme, Eric Mossimbo, Lamba
Michel, Zomimputu, Loya, Sylvan Imalimo and Mammadou Gassagna; Data collectors (Gabon): Ludovic Momont, Nerissa Chao, Julian
Eastwood, Erica Spotswood; Logistics: Mike Fay, Bryan Curran, Djoni-Djimbi Bourges, Paul and Sarah Elkan, Kate Abernethy, Nigel
Orbell, Lee White, Tommy Smith, Lisa Steel, Allard Blom, Pauwel deWachter, Mark Ella Akou, and Patrick Koumbi.
Savannah
We thank the Kenyan Office of the President of the Republic of Kenya, the Samburu, Isiolo and Narok County governments, the Kenya
Wildlife Service for collaboration including veterinary services, and Save the Elephants and Mara Elephant Project for data and field
operations. We thank the following individuals: from KWS Patrick Omondi, Matthew Mutinda, Francis Gakuya, Geoffrey Chege, from
Save the Elephants, Frank Pope, Ben Okita, Lucy King, Festus Ihwagi, David Daballen, Chris Leadismo, Benjamin Loloju, Nelson
Mwangi, Gilbert Sabinga, David Kimanzi, Jerenimo Lepirei, Wilson Lelukumani, and Barnerd Lesowapir. From the Mara Elephant
e1 Current Biology 31, 1–9.e1–e4, June 7, 2021Please cite this article in press as: Wall et al., Human footprint and protected areas shape elephant range across Africa, Current Biology (2021), https://
doi.org/10.1016/j.cub.2021.03.042
ll
Report OPEN ACCESS
Project we thank Marc Goss, Wilson Sairowua, Zakayo Naeku, Jackson Maitai, Madeleine Goss, Richard Roberts, and the Fehsen-
feld family for contribution of both data and funding. We also thank Dr. Henrik Rasmussen from Savannah Tracking Ltd.
Sahel
Data Collection
Save the Elephants; Funding: Save the Elephants & the WILD Foundation; We also thank the Wildlife Conservation Society, El Media
Doumbia, Vance Martin, Susan Canney, Mike Deutsch, the Save the Elephants collaring team in 2008, the Government of Mali and
African Parks Foundation.
METHOD DETAILS
GPS collar data
Tracking data were collected from elephants inhabiting 19 distinct geographic sites from six elephant range states (Figure 1,
Table S1, Data S1). The sites studied cover four African biomes: Savannah (East Africa), Forest (Central Africa), Sahel (West Africa),
and Bushveld (South Africa). Individual elephants were fitted with GPS radio collars (Tables S1 and S2).
GPS collar deployment was focused on elephants inhabiting IUCN category I and II protected areas in each site, generally thought
to represent better protected populations. Immobilization and collar fitting followed national procedures established by the national
veterinary services in each country. During capture, the gender of each elephant was recorded, and ages were estimated where
possible based on body size and molar progression58 although ages were not used in the analysis. Collated datasets we believe
represented the full range of each explanatory variable (Tables S5).
18 different types of GPS radio collars were used. Collars transmitted data remotely through satellite or local mobile phone net-
works or were manually downloaded and processed. Different duty cycles were used because of limitations of collar battery life rela-
tive to data collection objectives in the different study systems and ranged from 15 to 2,400-min intervals, with most animal locations
sampled every 60-min (Table S2).
In total, 254 individual adult elephants were tracked: 120 females and 134 males; 220 savannah and 34 forest elephants, resulting in
3,219,375 positions recorded between 1998 and 2013. Collar datasets had a median of 7,417 positions and Interquartile Range (IQR)
of between 2,245 and 19,173 positions per individual. Average tracking duration was 590 days per individual, with 171 (68%) indi-
viduals having greater than one year of data and 109 having multi-year datasets. Prior to analysis, these data were filtered keeping
only those datasets with a minimum of 12 h sampling (i.e., no separation in successive data points greater than 12 h) resulting in
2,947,767 analyzed locations representing 108 females and 121 males included in analyses (Table S1, Data S1).
Study sites
The six sites in Central Africa were in predominantly high canopy tropical forest with on average > 1,400 mm of rainfall annually. West
Africa was represented by one site the Gourma in Mali–ranging from Sahelian (110 mm annual rainfall) to Sudano-savannah vege-
tation (600 mm annual rainfall). East African savannah systems with annual rainfall varying between 200 to 800 mm per year were
represented by nine sites. South African bushveld, with annual rainfall averaging 600 mm, was represented by three sites.
Elliptical time-density ranges
We calculated range areas at two temporal scales: sequential 16-day periods and sequential annual periods, resulting in 10,319 (16-
day) and 302 (annual) Elliptical Time-Density (ETD) range areas. The ETD method accounts for the time between fixes and the overall
speed-distribution of the animal to generate an estimated spatial utilization distribution,8 from which we calculated the area where the
animal spent 90% of its time during the tracking period. This range estimator adheres closely to the observed locations (occurrence
estimation), where smoothing around the observed locations represents plausible areas of occurrence within the time interval of
observed locations. We used this method to ensure our regression analysis of covariates in an elephant’s range represented the
area the animal likely occurred rather than potentially could have used (as represented by other range methods with more liberal
smoothing algorithms such as Bivariate Gaussian Kernel Density estimation). Second, this method adjusts interpolation between
fixes based on the sampling resolution and biologically derived movement parameters, ensuring comparable representation across
tracking records with different sampling regimes and error rates. Speed distributions for each animal were parameterized using a
two-parameter Weibull distribution fit using maximum likelihood methods. The 90th percentile speed-distribution value was used
as the upper speed cut-off.8
For comparison of the ETD areal estimates with traditional methods (more commonly found in the published literature) we also
calculated 90th percentile Kernel Density Estimate (KDE)59 and Minimum Convex Polygon (MCP)60 range areas (Table S3). Compar-
ison of ETD with other utilization distribution estimators found the ETD method had lower overall error in representing space-use at
the 90th percentile range area.8
Covariates
For each ETD range polygon and its associated time span, we extracted a series of covariate information derived from satellite im-
agery and other spatial datasets (Table S4). Raster calculations were made using the Google Earth Engine (GEE) remote sensing plat-
form28 at a resolution of 0.25 km2. We averaged across time and space the values of raster pixels to obtain a single mean value for
Current Biology 31, 1–9.e1–e4, June 7, 2021 e2Please cite this article in press as: Wall et al., Human footprint and protected areas shape elephant range across Africa, Current Biology (2021), https://
doi.org/10.1016/j.cub.2021.03.042
ll
OPEN ACCESS Report
each covariate for each ETD range for each time span. Specifically, we extracted information on vegetative properties of the land-
scape using the Moderate-resolution Imaging Spectro-radiometer (MODIS) Normalized Difference Vegetation Index (NDVI),18,19
Normalized Difference Water Index (NDWI),61,62 Enhanced Vegetation Index (EVI),18,63 and percent tree cover (TREE).23,24 Abiotic
features, namely slope derived from NASA’s Shuttle Radar Topography Mission (SLOPE),25 land surface temperature (LST),22 rainfall
(TRMM),21 and permanent water availability (WATER)20 were also extracted in GEE. Finally, we extracted information on the overlap
between range and protected area boundaries (PAI) (as defined by the World Database on Protected Areas (WDPA)15) and the Human
Footprint Index (HFI),26,27 an index of the aggregate influence of human population density, built-up areas, night-time lights, land use,
coastlines, roads, railroads, and navigable rivers. See Table S4 for further details on model covariates.
Data were categorized according to species (Savanah elephants L. africana or Forest elephants L. cyclotis), sex (Male or Female),
the site where an animal was collared (Table S1), and the individual animal identifier.
Given the scale of this analysis, we relied on coupling movement data with relatively high resolution, standardized global datasets
facilitated by the Google Earth Engine analytical environment.28 While these data offer powerful, standardized information enabling
such a broad, continental scale analysis, we were still missing some finer resolution layers on different anthropogenic and environ-
mental variables that could not be compiled systematically across the diversity of ecosystems in this study. In particular, we were not
able to assemble comprehensive spatial metrics of risk to elephants. As discussed in relation to variable range sizes found in areas of
high human impact, understanding the tolerance of local people to elephants is critical to understanding ranging behavior, but such
spatially explicit information on human perception is rare.64 While several systems in this study have fenced boundaries, a factor
known to restrict normative elephant movement behavior and space use, we lacked systematic information on fences across all stud-
ied populations. We also lacked high quality layers on the vegetation community, including tree fruiting phenology, relying on a coarse
tree cover layer, which we found had a positive impact on range size. The spatial configuration of the vegetation community is widely
recognized as influential on range geometry and size.65,66 While we incorporated permanent water in our analysis, seasonal or
ephemeral water sources are more difficult to characterize, limiting inference on some of the more dynamic aspects of this important
abiotic correlate of movement.
Given the dominant influence of land use change on habitat and species loss, the projected human population growth and land use
plans in Africa will be the critical challenge for wildlife conservation in the future. Increasing the resolution, availability, and accuracy of
global landscape layers will facilitate assessment of the impacts of human population expansion on wildlife, as well as identifying
approaches to mediate such impacts by identifying those areas with the greatest long-term conservation viability.
QUANTIFICATION AND STATISTICAL ANALYSIS
We developed sets of linear mixed-effects models, with individual id as a random effect, at both the 16-day and annual timescales
relating the effects of covariates to range area to answer Question 1 (How do elephant home ranges vary in size across sexes, spe-
cies, and biome?), and Question 2 (How influential are individual, biotic, abiotic and anthropogenic factors on elephant range size?).
Models were classified according to: i) indv – models containing individual factors of sex or species, ii) anthro – models containing
anthropogenic factors of protected area use and the human footprint, iii) biotic – models containing variables related to the biotic
environment including vegetation indices and tree cover, iv) abiotic – models containing variables related to the abiotic environment
including slope, temperature, rainfall and water, v) full – models containing all model variables, or; vi) mixed - models that contained
variables from a combination of driver categories.
Model specification
Range areas were log-transformed to account for their exponential distribution and non-negative values.67,68 We used a nested var-
Ident variance structure69,70 to allow for heterogeneous spread in the residuals associated with individuals nested within sites. The
random-effects structure of the models (individuals nested within sites) and the heterogeneous variance structure (variance allowed
X mx
to vary per site) helped to account for the sampling biases across sites. All continuous covariates were standardized and
s2x
tested for pairwise correlations (Figure S1, Figure S2) before model fitting. Because of a high degree of correlation (> 0.7) between
NDVI, EVI, and NDWI at the 16-day scale, we first tested three models with each of these covariates individually, based on the Cor-
rected Akaike’s Information Criterion (AICc),16,17 and dropped EVI and NDWI from further analysis (Figure S1). At annual scales, there
was a high degree of correlation (> 0.7) between NDVI, EVI, LST, and TREE covariates. Model selection favored NDVI for the full
model specification (Figure S2). All other covariates had less than 0.7 pairwise correlation and were included in the same models.
The full model specification for the 16-day model, in terms of a single observation of range area for animal i nested within site j at
time t, was:
logðAREAijt Þ gj + fij + SEXijt + SPECIESijt + NDVIijt + TREEijt + LSTijt + TRMMijt + WATERijt + SLOPEijt + HFIijt + PAIijt + ˛ijt
while the full model specification for the annual model was:
logðAREAijt Þ gj + fij + SEXijt + SPECIESijt + NDVIijt + NDWIijt + TRMMijt + WATERijt + SLOPEijt + HFIijt + PAIijt + ˛ijt
e3 Current Biology 31, 1–9.e1–e4, June 7, 2021You can also read