IBM Custom Visualizations Developer Guide - IBM Cognos Analytics Version 11.1.0
←
→
Page content transcription
If your browser does not render page correctly, please read the page content below
IBM Cognos Analytics
Version 11.1.0

Custom Visualizations Developer Guide

IBM
Contents

  Chapter 1. Introduction......................................................................................... 1
     Developing custom visualizations............................................................................................................... 1

  Chapter 2. Step by step guide................................................................................ 3
     Step-by-step guide for custom visualizations.............................................................................................3
        Setting up the development environment............................................................................................. 3
        Uninstalling the custom visualizations CLI tools................................................................................... 4
        Creating a custom visualization............................................................................................................. 4
        Using a D3 sample in your custom visualization................................................................................... 5
        Validating the visualization in a dashboard........................................................................................... 6
        Validating the visualization in a report...................................................................................................6
        Package and deploy the custom visualization.......................................................................................7
        How local custom visualizations work................................................................................................... 8

  Chapter 3. Custom visualizations tools and commands........................................... 9
     Custom visualizations tools and commands............................................................................................... 9

  Chapter 4. Customvis library................................................................................ 13
     Custom visualizations library (customvis-lib)........................................................................................... 13
        Rendering............................................................................................................................................. 13
        Data model........................................................................................................................................... 16
        Interactivity.......................................................................................................................................... 18
        Legends.................................................................................................................................................20
        Properties............................................................................................................................................. 21
        Palettes.................................................................................................................................................23
        Customizing your visualization.............................................................................................................25
        RenderBase.......................................................................................................................................... 26

  Chapter 5. Customvis API reference..................................................................... 29
     Customvis api reference............................................................................................................................ 29

  Chapter 6. Customvis frequently asked question.................................................. 31
     FAQ custom visualizations.........................................................................................................................31

  Chapter 7. Visualization definition....................................................................... 33
     Visualization definition.............................................................................................................................. 33

  Chapter 8. Tutorial...............................................................................................37
     Custom visualizations - tutorial.................................................................................................................37
        Part 1: Creating a custom visualization............................................................................................... 38
        Part 2: Adding properties to the visualization..................................................................................... 43
        Part 3: Customize legend and properties............................................................................................ 45
        Part 4: Advanced features....................................................................................................................47

  Chapter 9. Manage custom visuals....................................................................... 51
     Managing custom visuals from the admin UI............................................................................................51

  Chapter 10. Improving the performance of custom visualizations..........................53
     Improving the performance of custom visualizations.............................................................................. 53

                                                                                                                                                                iii
Chapter 11. Authoring schematics - Tutorial......................................................... 55
SVG definition............................................................................................................................................ 55
SVG basic mapping.................................................................................................................................... 55
Rules and restrictions for SVG............................................................................................................. 57
Adding views to schematics...................................................................................................................... 59
Highlighting regions in a schematic...........................................................................................................60
Editing a schematic package..................................................................................................................... 62
Distributing a schematic............................................................................................................................ 64
ivChapter 1. Introduction
Developing custom visualizations
You can create custom visualizations to meet your specific business needs. IBM® Cognos Analytics allows
developers to create and test custom visualizations locally before they make them available to other
users.
The Manage Visualizations capability allows users to control access rights to extensible visualizations for
individual users, groups, and roles.
The Develop Visualizations capability allows users to develop extensible visualizations.
Custom visualization code samples are available in the Samples Guide.
© Copyright IBM Corp. 2019, 2021 12 IBM Cognos Analytics Version 11.1.0 : Custom Visualizations Developer Guide
Chapter 2. Step by step guide

Step-by-step guide for custom visualizations
      This step-by-step guide explains how to set up the development environment, create a custom
      visualization from an existing D3 example and how to deploy and authorize the custom visualization in
      IBM Cognos Analytics.

Setting up the development environment
      The IBM Cognos Analytics custom visualizations CLI tools require you to install the NodeJS runtime
      environment with a NodeJS package manager (NPM).

      Before you begin
      Make sure that the following software is installed:
      • Microsoft Windows PowerShell or CMD on Windows or Terminal on Apple OSX.
      • NodeJS version 10. For more information, see https://nodejs.org/en/.

      Procedure
      Installing Node.JS and NPM
        1. Download NodeJS version 10 installer from https://nodejs.org/en/download/.
       2. Run the installer and use the default settings.
       3. After the installation, restart your computer.
       4. Validate the node and npm installation.
           a) Open a command-line interface (CLI). Powershell or CMD on Windows or Terminal on OSX.
           b) Run the following command:

                node --version

              The CLI displays the current version of the node. Make sure it meets the prerequisites.
      Installing the Cognos Analytics custom visualizations CLI tools
        5. Download the Cognos Analytics custom visualizations command-line tools from the following
           location:
          • For Cognos Analytics 11.1.4, use [CAserverroot]/bi/js/dashboard-analytics/lib/
            @waca/vida/sdk/customvis.tgz.
          • For Cognos Analytics 11.1.5, use [CAserverroot]/bi/js/vida/customvis.tgz.
          In some browsers, the file extension .tgz is recognized as text. Download the file by right-clicking the
          link and choose Save as and set type to All Files. Do not use the Mozilla Firefox browser to download
          the file.
       6. In your file browser, navigate to the directory where the downloaded file is saved to.
       7. Open a command-line tool.
          •    On Microsoft Windows systems Windows PowerShell or CMD.
          • On Apple OSX systems Terminal.
       8. Run the following command:

              npm install -g customvis.tgz

© Copyright IBM Corp. 2019, 2021                                                                                 3
On UNIX and Apple OSX systems, you might get a permission denied error. To solve this error, run the
following command as an administrator:
sudo npm install -g customvis.tgz
The custom visualizations CLI tools are installed on your system.
9. After the process is completed, run the following command to validate the custom visualizations CLI
tools.
customvis --help
The CLI displays the available commands.
10. In your file browser, delete the file customvis.tgz.
Uninstalling the custom visualizations CLI tools
If you do not need the IBM Cognos Analytics custom visualizations CLI tools any longer, you can uninstall
them.
Procedure
To uninstall the custom visualizations CLI tools and its dependencies, run the following command.
npm uninstall -g @businessanalytics/customvis
Creating a custom visualization
Before you can implement a custom visualization, you must create a custom visualization.
About this task
The customvis create command generates a new custom visualization from a default template. However,
you can specify a specific template on which the new custom visualization is based on. For more
information, see the “Create” on page 9 command.
Procedure
1. Open a command-line interface (CLI) in one of your chosen directories and run the following
command:
customvis create CustomVisualization
• A directory with the name CustomVisualization is created.
• You can choose another name instead of CustomVisualization. For example, Marimekko, which
creates a new directory called Marimekko.
2. In the CLI change the directory, by running:
cd CustomVisualization
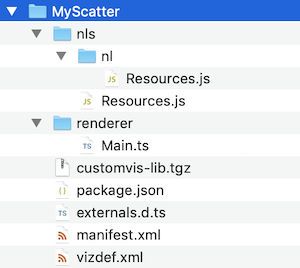
3. When you develop a custom visualization, the custom visualizations CLI tools build the sources. The
sources for the bundle are located in the /renderer directory.
4. You can now start implementing the visualization.
4 IBM Cognos Analytics Version 11.1.0 : Custom Visualizations Developer GuideUsing a D3 sample in your custom visualization
You use a D3 sample in this step-by-step guide. For more information, see Collision Detection at https://
bl.ocks.org/mbostock/3231298/.
About this task
The example does not support data binding, extra interactivity, and so on. Further information on
implementing extra custom visualization capabilities can be found in the API development
documentation. Further implementation must be done by a developer with JavaScript & D3 skills.
Procedure
1. Open the renderer/Main.ts file in a code editor.
2. The Main.ts file is the entry point of the visualization and runs always first. The content of the
Main.ts file is:
import { RenderBase } from "@businessanalytics/customvis-lib";
export default class extends RenderBase
{
protected create( _node: HTMLElement ): HTMLElement
{
_node.textContent = "Basic VizBundle";
return _node;
}
};
Note: This code is written in TypeScript, which is a super-set of JavaScript. However, for some code
areas you can also use JavaScript. This usage is demonstrated in this step-by-step guide.
3. Open a command-line interface (CLI) in the directory that was made in “Creating a custom
visualization” on page 4 and run the following command:
customvis start
This command builds the sources and starts a local server that hosts the custom visualization.
Additionally, the custom visualizations CLI tools start monitoring the source files and rebuild the
custom visualization when its source code changes. It is recommended to have this command running
during development of the visualization.
To stop the local server that hosts the custom visualization, press Ctrl C.
4. Edit the Main.ts file in such a way that the D3 example can be used in IBM Cognos Analytics.
a) Determine what version of D3 is used in the online example. The version can be found by searching
d3 in the script tag of the example. The online example uses d3.v3. Import this dependency in
the Main.ts file by adding the following to the top of the file:
import * as d3 from "https://d3js.org/d3.v3.min.js";
b) Replace
_node.textContent = "Basic VizBundle";
with the content in the script tag of the example:
{content of the script tag of the example}
c) Ensure that the rendering happens in the container of the widget. Replace
d3.select("body").append("svg")
with
d3.select(_node).append("svg")
Chapter 2. Step by step guide 55. Save the file. If everything works correctly, the CLI displays that the sources finished building.
Results
You can now validate the custom visualization in Cognos Analytics.
Validating the visualization in a dashboard
You should use the Google Chrome browser when you develop a custom visualization locally. However,
Mozilla Firefox, Microsoft Internet Explorer 11, and Edge are also supported.
Before you begin
Note: The Apple Safari browser is not supported for local custom visualization development.
When you validate the visualization, your browser connects to your custom visualization that runs locally.
Some browsers can treat this connection as a security threat. Microsoft Internet Explorer 11 might
display a pop-up message that only secure content is displayed. For the visualization to load you must
allow that all content is shown.
To disable the message in Internet Explorer, add http://127.0.0.1 to the trusted sites in the internet
security options. Make sure the trusted sites display mixed content.
About this task
After the visualization is uploaded to IBM Cognos Analytics, any supported browser can be used to run the
uploaded custom visualization.
Procedure
1. Create a dashboard in Cognos Analytics.
2. Click the Visualization tab and then click the Custom tab.
3. Under Developers widgets double-click Test visualization.
4. To see these changes in the Page preview view, click Refresh visualization .
Results
Cognos Analytics displays the D3 visualization.
Validating the visualization in a report
It is recommended to use the Google Chrome browser when you develop a custom visualization locally.
However, Mozilla Firefox, Microsoft Internet Explorer 11, and Edge are also supported.
Before you begin
Note: The Apple Safari browser is not supported for local custom visualization development.
When you validate the visualization, your browser connects to your custom visualization that runs locally.
Some browsers might treat the connection as a security threat. Microsoft Internet Explorer 11 may
display a pop-up message that Only secure content is displayed. For the visualization to load, allow that
all content is shown.
To disable the message in Internet Explorer, add http://127.0.0.1 to the trusted sites in the internet
security options. Make sure the trusted sites display mixed content.
About this task
After the visualization was uploaded to IBM Cognos Analytics, any supported browser can be used to run
the uploaded custom visualization.
6 IBM Cognos Analytics Version 11.1.0 : Custom Visualizations Developer GuideProcedure
1. Create a report in Cognos Analytics. Make sure that you are in Page preview mode.
2. Under Insertable objects, click the Toolbox icon .
3. Expand the Advanced menu and double-click Custom visual preview.
The custom visualization is loaded.
4. The custom visualizations CLI tools monitors the source files and rebuilds the custom visualization
when its source code changes. To see these changes in the Page preview view, click Refresh
visualization .
5. Run your report as HTML by clicking Play and then Run HTML.
Results
Cognos Analytics displays the D3 visualization.
Package and deploy the custom visualization
When the custom visualization is ready to be published, you can use the custom visualization command-
line interface (CLI) tools to build and pack the visualization. You can upload the packed visualization to
IBM Cognos Analytics.
Packaging the custom visualization
Before you can deploy the custom visualization, you must package it.
Procedure
1. Open a command-line interface (CLI) where the custom visualization is located, created in “Creating a
custom visualization” on page 4. Make sure that in the CLI you browse to the directory where the
custom visualization is located.
2. Run the following command in the command-line interface:
customvis pack
The custom visualization is built and packed into a .zip file.
Results
A .zip file is generated in the current directory: {directoryName}.packed.zip. For example:
CustomVisualization.packed.zip.
If you have the Manage Visualizations capability, you can upload the packaged.zip file to IBM Cognos
Analytics.
If you do not the Manage Visualizations capability, you can send the file to someone who has the
Manage Visualizations capability. If you want to run the custom visualization locally, then extract the
packaged.zip file and run the customvis start command from a CLI in the extracted folder.
Uploading custom visualizations from the admin UI
Before you can use the custom visualization in a dashboard or report, you must upload it.
Procedure
1. On the home page, click Manage > Customization > Custom visuals > Upload custom visual
.
2. Select the CustomVisualization.packed.zip file and click Open.
Chapter 2. Step by step guide 7Results
The custom visualization is added to the list of visualizations. Optionally you can set the permissions on
the visualizations.
Using the uploaded visualization in a dashboard
You can use a custom visualization in an IBM Cognos Analytics dashboard.
Procedure
1. Create a dashboard in Cognos Analytics.
2. Click the Visualization tab > Custom.
Results
The uploaded custom visualization is selectable from the list of Custom visuals.
Using the uploaded visualization in a report
You can use a custom visualization in a IBM Cognos Analytics report.
Procedure
1. Create a report in Cognos Analytics.
2. Create a visualization.
Results
The uploaded custom visualization is selectable from the Custom section.
How local custom visualizations work
Using the provided custom visualization command-line (CLI) tools, a local server is started on the
customvis start command.
This local server hosts files that are generated by the CLI tools in the build directory. You can access these
files over the local network by the browser. IBM Cognos Analytics Reporting & Dashboard includes
sandbox widgets that connect to this local server (127.0.0.1) and access the generated files. If these files
exist, then these files run in the corresponding widget as a visualization.
8 IBM Cognos Analytics Version 11.1.0 : Custom Visualizations Developer GuideChapter 3. Custom visualizations tools and
commands
Custom visualizations tools and commands
With IBM Cognos Analytics custom visualizations tools you can create, compile, run, clean, and pack
visualizations from a command-line interface (CLI).
In addition to compiling a visualization, you can use the custom visualizations to host a custom
visualization locally to test the visualization in Cognos Analytics before you deploy it.
You use the Cognos Analytics custom visualization tools from commands in a command-line interface
(CLI). You run these commands from Microsoft Windows PowerShell or CMD on Windows or from Terminal
on Apple OSX.
For installation of the Cognos Analytics custom visualization tools, see “Setting up the development
environment” on page 3.
Help
Prints a help dialogue of all available commands and any additional options that can be used.
customvis --help
or
customvis
Create
Creates a visualization within a folder called name.
customvis create [options]
or
customvis c [options]
Options:
• -t, --template Creates a project from template (default: Basic). This flag
determines the initial template that the visualization is generated from. To list all available templates,
see the List command.
customvis c -t BarChart
• -f, --force Forces folder creation with name. Note: If you specify an existing name for the folder, the
existing folder is deleted .
customvis c -f
• -h, --help Output usage information
© Copyright IBM Corp. 2019, 2021 9List
Lists all the available templates that can be used for a new custom visualization during the Create
command.
customvis list
or
customvis l
Start
Builds and starts a local server that hosts the current visualization.
• The CLI tool builds the sources.
• A local server starts to host the custom visualization.
customvis start [options]
or
customvis s [options]
Options:
• -p, --port
Starts a server on a specific port (default 8585).
customvis start -p 8585
• -h, --help
Output usage information
customvis start -h
Pack
Creates a package of the visualization in the current root directory, .packed.zip. You
can upload this .zip file to Cognos Analytics.
customvis pack
or
customvis p
Build
Builds and compiles the visualization in the current directory. Use this to test the deployment version
locally.
customvis build
or
customvis b
10 IBM Cognos Analytics Version 11.1.0 : Custom Visualizations Developer GuideClean
Cleans the current visualization and removes all the files that are generated by the command-line tool.
Use this when you need to share a development version of the visualization.
customvis clean
or
customvis cl
Upgrade
Upgrades the customvis-lib in the current visualization. Replaces the customvis-lib dependency with the
latest one in the current CLI tool. Also triggers the Clean command.
customvis upgrade
or
customvis up
Info
Get information about the CLI tool and the current visualization. Shows the Cognos Analytics extensible
information about the CLI tool and the current visualization.
customvis info
or
customvis i
Version
Shows the current Cognos Analytics custom visualization CLI tool version.
customvis --version
or
customvis -V
Chapter 3. Custom visualizations tools and commands 1112 IBM Cognos Analytics Version 11.1.0 : Custom Visualizations Developer Guide
Chapter 4. Customvis library

Custom visualizations library (customvis-lib)
      The customvis-lib library is designed to help developers build visualizations quickly by providing
      documented utility classes and interfaces. This document is intended for developers.
      Features that are offered by customvis-lib include:
      • A managed “Rendering” on page 13 cycle
      • A unified “Data model” on page 16
      • Automatic or custom “Hit testing” on page 18
      • Automatic “Legends” on page 20
      • “Properties” on page 21 support
      • “Palettes” on page 23 support
      • “Customizing your visualization” on page 25
      At the core of customvis-lib, is the “RenderBase” on page 26 class. The RenderBase class is the base
      class that you can use for every custom visualization. This base class gives you access to all of the
      features in customvis-lib.

      Installation
      The library is available as a file called customvis-lib-x.y.z.tgz where x.y.z is the version of the
      library. When you create a new visualization that uses the SDK command customvis create, the customvis
      library is copied to the root directory of your new visualization.

      Step-by-step visualization
      Learn how to build a custom visualization that uses customvis-lib and d3 by following the “Custom
      visualizations - tutorial” on page 37.

      API Reference
      Check out the API reference for detailed information about all the classes and methods that are found in
      customvis-lib.

Rendering
      Rendering makes sure that your data is transformed to pixels that eventually display on your screen.
      The result of rendering can be a Document Object Model (DOM) structure, a scalable vector graphic (svg),
      or pixels on a canvas, depending on which output technology you choose. All code samples use svg
      rendering in d3. However, in your custom visualization you can choose any other way of rendering.
      Within customvis-lib, you must implement a create phase and an update phase:
      • The create phase is run exactly once, when the visualization gets initialized.
      • The update phase is run each time an aspect of the visualization changes, like the size, data or
        properties of the visualization.
      Implementing these phases is optional. The RenderBase base class provides a default implementation
      for you.

© Copyright IBM Corp. 2019, 2021                                                                              13
Create
The create phase is run when the visualization gets initialized. You can implement this phase by overriding
the “create()” on page 26 method of RenderBase. In this method, you receive the DOM node of the
container element for your visualization. You don’t must override create if your visualization does not
have initialization code. However, if you do, you can add more DOM or svg nodes to your container and
optionally return an Element as the new root node of your visualization. An example:
protected create( _node: HTMLElement ): void
{
// Append an svg node that scales to the size of its container.
d3.select( _node ).append( "svg" )
.attr( "width", "100%" )
.attr( "height", "100%" );
// No return value means _node will be the root of our visualization.
}
protected update( _info: UpdateInfo ): void
{
// _info.node will be the same '_node' that was passed to 'create'.
}
If your initialization requires asynchronous calls, you can return a Promise object that resolves with
either an Element or void.
protected create( _node: HTMLElement ): void
{
return new Promise( resolve =>
{
// doInit performs async initialization.
doInit( function cb()
{
// Init is done, resolve the Promise. Optionally you can
// resolve with an `Element` that will become the root
// node of your visualization.
resolve();
} );
} );
}
Update
The update phase gets called each time something changes in the size, properties, or data of the
visualization. You can implement the update phase by overriding the “update()” on page 27 method of
RenderBase.
Render completion
The implementation of update in its most basic form is the following code:
protected update( _info: UpdateInfo ): void
{
_info.node.textContent = "Hello World: " + Date.now().toString();
}
There is no return value, which means that the rendering completed at the end of the update function.
Each visualization has the responsibility to notify its host when it completed rendering in the update
phase. Notification is done through the return type: returning void implies that rendering is done when
the update function ends and returning a Promise means that the host should wait for that promise to
be fulfilled.
If you want your visualization to show animations or transitions, this is often an asynchronous process.
Therefore, the update function can return a Promise object that resolves as soon as the transition of the
visualization completed. An example illustrates this:
protected update( info: UpdateInfo ): Promise
{
14 IBM Cognos Analytics Version 11.1.0 : Custom Visualizations Developer Guideconst t = d3.transition().duration( 300 );
d3.select( _info.node )
.selectAll( "rect" )
.data( _info.data.rows )
.join( "rect" )
.attr( "x", d => scale( d.tuple( 0 ).key ) )
.attr( "width", d => scale.bandwidth() )
.transition( t ) // bind to our transition
.attr( "height", d => d.values( 0 ) );
return new Promise( resolve => t.on( "end", () => resolve() ) );
}
In the RenderBase base class, you can see that the update method has the return signature void |
Promise. However, in your override you can be more explicit and define either void or
Promise as the return type.
If for some reason, you want the host application to know that rendering failed, you can either return a
rejected promise or produces a new Error( "msg" ).
UpdateInfo
The one parameter that is passed to update is an object of type UpdateInfo. You can see this object as
the state that you are about to render. The UpdateInfo class holds the following information:
• reason: The reason why rendering should take place. Check the flags in this object to see which
aspects of the visualization need rendering. Available flags are:
– data: data is changed since last call to update.
– size: size is changed since last call to update.
– properties: properties are changed since last call to update.
– decorations: decorations (selected, highlighted) are changed since last call to update.
• data: The data that should be rendered, or null if there is no data. If there is no data to render, it is the
responsibility of the visualization to ensure that the visualization is cleared and rendered in an empty
state.
• node: The HTML element on which rendering should take place. This is the element that was returned
previously from the RenderBase.create method.
• properties: The current set of properties. Properties can also be accessed through the
RenderBase.properties attribute.
• locale: The data locale that should be used for rendering. Do not use for translations, only for custom
data formatting where that is necessary.
The following example shows how you can use the fields of UpdateInfo to provide an optimized
implementation of update:
protected update( _info: UpdateInfo ): void
{
const reason = _info.reason;
if ( !_info.data )
return renderEmpty( _info.node );
// Call expensive data processing function only if data has changed.
if ( reason.data )
this.data = processData( _info.data );
// Perform rendering, based on `this.data` ...
}
Chapter 4. Customvis library 15Data model
Custom visualizations are based on a tabular data model.
Data is organized in rows and columns, where every row corresponds with a data point and every column
corresponds with a slot in your visualization definition. For more information, see “Visualization
definition” on page 33. Data is passed to the visualization in the update method, in which it can be used
to bind to the elements that make up the visualization. Objects in the data model are also used in hit
testing functions to inform a hosting application which data point or tuple was hit at a specific coordinate.
Slots
A slot is the entry point for data that goes into a visualization. For instance, a column visualization might
have two slots: one slot that represents the categorical elements that go on the x-axis and one slot that
represents the data values that determine the height of a column.
A slot can be defined in the vizdef.xml file, as either categorical or continuous:
• The data elements that are found in categorical slots are tuples. For instance, in the column chart above
the categories slot might hold the tuples [ ‘summer’, ‘winter’, ‘spring’, ‘autumn’ ]. You might see this list
of tuples as the categorical domain of the slot. In a code example further on, you can see that you use
the tuples as a domain in a d3 scale object.
• A continuous slot holds data elements that represent values. Instead of a list of tuples, you can retrieve
a value domain for this type of slot. A value domain is a minimum value and a maximum value. The
domain in the values slot of the column chart example might be something like: [25.4, 136.4].
Slots can be either mapped or not mapped. If a slot is mapped, then some data was assigned to that slot.
If a slot is not mapped, then the slot is not associated with data and its tuples attribute are [] and
domain are [0, 0].
If a slot is optional, it means that you can, but do not need to associate data with that slot. The
visualization is responsible for handling this situation correctly. For example, in a column chart the series
slot might be optional. If it is not completed, the visualization can render a simple bar chart with only
categories and values. If it is completed, a clustered bar chart can be rendered.
Tuples and domains
Every column in your data corresponds with a slot in your visualization. Slots can be either categorical or
continuous. This means that a data column can hold either tuples (for categorical slots) or values (for
continuous slots).
The following example shows how you can retrieve the tuples and the value domain for a data set and use
them in a d3 scale:
protected update( _info: UpdateInfo ): void
{
const data = _info.data;
const width = _info.node.clientWidth;
const height = _info.node.clientHeight;
// Create a list of tuple keys for categorical column 0 and use it
// to create a band scale that maps the keys to an axis length.
const keys = data.cols[ 0 ].tuples.map( _t => _t.key );
const scaleX = d3.scaleBand().range( [ 0, width ] ).domain( keys );
// Column 1 has values, so take the domain and use it to create a
// linear scale that maps the domain to an axis length.
const domain = data.cols[ 1 ].domain.asArray();
const scaleY = d3.scaleLinear().range( [ 0, height ] ).domain( domain );
// ...styling is omitted from this sample...
d3.select( "svg" ).selectAll( "rect" )
.data( _info.data.rows )
.join( "rect" )
16 IBM Cognos Analytics Version 11.1.0 : Custom Visualizations Developer Guide.attr( "x", d => scaleX( d.tuple( 0 ).key ) )
.attr( "width", scaleX.bandwidth() )
.attr( "height", d => scaleY( d.value( 1 ) ) );
}
The example uses the key of every tuple as the unique domain value. In the data accessor function, d =>
scaleX( d.tuple( 0 ).key ) this key is used to determine the location of the data point on the x-
scale.
The ISlot interface makes no difference between a categorical and a continuous slot. If the slot is
continuous, the list of tuples is []. If the slot is categorical, the domain is empty (0, 0).
Data points
Each row in the data set is represented by a data point object. A data point references tuples (one for
every categorical slot) and values (one for every continuous slot). If like in the previous example, bind
data points to your d3 elements, you can use an accessor function to retrieve the tuple and value
information for each data point.
The following example binds each row to a text element and uses an accessor function to retrieve the
caption of column 0 as text content. If column 0 is a categorical column, the tuple caption is used. If
column 0 is a continuous column, the formatted value is used.
d3.select( "svg" ).selectAll( "text" )
.data( _info.data.rows )
.join( "text" )
.text( d => d.caption( 0 ) )
Decorations
Each data point and tuple can to get decorated. A decoration is an attribute that holds some meta
information about the data point or tuple. Currently, two decoration types are supported: selected and
highlighted (both booleans). If a data point is marked as selected, the visualization might want to
render the data point slightly different, for instance by using a brighter color.
d3.select( "svg" ).selectAll( "rect" )
.data( _info.data.rows )
.join( "rect" )
.attr( "x", d => scaleX( d.tuple( 0 ).key ) )
.attr( "width", scaleX.bandwidth() )
.attr( "height", d => scaleY( d.value( 1 ) ) )
// Selected data points are rendered in the color red.
.attr( "color", d => d.selected ? "red" : "steelblue" );
Alternatively, if the visualization has a palette property, you can use the getFillColor function of the
palette determine the correct color for an element. For example:
protected update( _info: UpdateInfo ): void
{
// ...
const palette = _info.props.get( "color" );
d3.select( "svg" ).selectAll( "rect" )
.data( _info.data.rows )
.join( "rect" )
.attr( "x", d => scaleX( d.tuple( 0 ).key ) )
.attr( "width", scaleX.bandwidth() )
.attr( "height", d => scaleY( d.value( 1 ) ) )
.attr( "color", d => palette.getFillColor( d ) );
}
Chapter 4. Customvis library 17If the palette is bound to a slot, then the color is based on the color of the tuple for that slot. If the palette
is not bound to a slot, then the default palette color is used. The getFillColor method adjusts the color
based on the selection of this and other data points.
There is also a getOutlineColor method on a palette that allows you to retrieve a color that can be
used for drawing the outline of an element based on the highlight decoration.
The getFillColor and getOutlineColor are available on all palette types and on the ContStops
object that is retrieved from a ContPalette. For more information, see “Palettes” on page 23.
Handling null data
The update function in your visualization gets a data object passed as part of the UpdateInfo object.
However, this data object can be null. This indicates that the visualization is responsible for clearing all
data and show the visualization in an initial state.
protected update( _info: UpdateInfo ): void
{
if ( _info.data === null )
return this.clearVisualization( _info );
// Perform rendering here...
}
Interactivity
Custom visualizations can use the interactivity capabilities of the hosting application.
Interactivity in this context means:
• Tooltip: Provide additional information when you hover over a data element.
• Selections: Apply an alternative style to data elements that are tagged as selected.
• Highlights: Highlight data elements that are under your mouse cursor.
Many of the interactivity functions can be implemented with little or no coding. If your visualization is
based on d3, then RenderBase already has a default hitTest implementation that can be configured to
return the correct data.
For selections and highlights, palettes have a getFillColor and getOutlineColor method that help
you bind the right color to your visual elements.
Hit testing
Hit testing is the process of returning a data element based on a screen coordinate. The hosting
application is responsible for calling the hitTest method when needed, and the visualization is
responsible for returning the correct data element based on the specified coordinate.
The hitTest function can be called often (for example on every mouse move), so it is important to make
sure that your function runs well.
The following example defines a class MyData that stores a reference to the visualization data and is
bound to svg elements on the screen through the mydata field.
class MyData
{
public DataPoint dp;
// Other MyData members...
}
protected hitTest( _elem: Element | null, _client: Point, _viewport: Point ): DataPoint | null
{
if ( !_elem || !_elem.hasOwnProperty( "mydata" ) )
return null; // no element or element has no data
return _elem.mydata.dp;
}
18 IBM Cognos Analytics Version 11.1.0 : Custom Visualizations Developer GuideIf your visualization is based on d3 and you bound your visualization data to the d3 model, then the
default RenderBase hitTest function will already run everything for you:
protected update( _info: UpdateInfo )
{
// Render a square for every data point.
d3.select( "svg" ).selectAll( "rect" )
.data( _info.data.rows ) // bind data
.join( "rect" ) // create / update 'rect' elements
.attr( "x", d => scaleX( d.value( X ) ) )
.attr( "y", d => scaleY( d.value( Y ) ) )
.attr( "width", d => scaleSize( d.value( SIZE ) ) )
.attr( "height", d => scaleSize( d.value( SIZE ) ) );
}
// No hitTest override needed because RenderBase is able to figure out how
// d3 has bound the data to 'rect' elements.
Some d3 visualizations encapsulate your DataPoint or Tuple in another object. In that case, you need to
override hitTest to return the data object:
protected hitTest( _elem: Element | null ): DataPoint | null
{
const elem = d3.select( _elem );
const data = elem.empty() ? null : elem.datum();
return data && data.dp;
}
Tooltips
Tooltips are provided for you by the hosting application. To show a tooltip, the host first needs to find out
which data element is rendered on a certain screen location. It uses the hitTest function to get this
information. After that, it is up to the host to show the tooltip with the correct data and styling.
Once you implemented the hitTest function in RenderBase, or rely on the default implementation, you
basically get tooltips for free. There is no need to write your own mouse handlers and pop ups to show
tooltips. This means that your visualization has tooltips that are consistent with the host application.
Selection & highlighting
A user of the custom visualization can often click a data element to select it, or hover with the mouse
cursor over it to highlight it. This selection and highlighting mechanism is implemented by the host and
also relies on the hitTest method. After the host application determined the data elements that need to
be selected or highlighted, the data elements are decorated with selected and / or highlighted flags and
the update function of the visualization will be called. It is the responsibility of the update function to do
apply the selected and highlighted flags to the rendered output.
To make visualizations that behave consistently with other visualizations in the hosting application, a
palette property has a method with which you can retrieve the selection or highlight style of an element
based on its selected and highlighted flags. In code, this might look as follows:
{
d3.select( "svg" ).selectAll( "rect" )
.data( _info.data.rows )
.join( "rect" )
.attr( "x", d => scaleX( d.value( X ) ) )
.attr( "y", d => scaleY( d.value( Y ) ) )
.attr( "width", d => scaleSize( d.value( SIZE ) ) )
.attr( "height", d => scaleSize( d.value( SIZE ) ) )
// Apply selection and highlight styling to the rect.
.attr( "fill", d => palette.getFillColor( d ) )
.attr( "stroke", d => palette.getOutlineColor( d ) );
}
Chapter 4. Customvis library 19Legends
The legend of a visualization can be used to show the user how various channels like color and size are
used to represent data.
For example, a grouped bar visualization might want to show the group labels on the x-axis while it shows
the colors and data labels of the individual group elements in a legend. Another example is a bubble
visualization, where a legend can be used to show the size-range or color-range of the bubbles.
Legends are rendered outside your custom visualization. For a legend to render the correct information,
the visualization needs to provide a data structure that tells the legend what it shows. This data structure
is generated automatically depending on the channel information that is found in the slots of the
“Visualization definition” on page 33.
Categorical legends
A categorical legend shows a list of swatches that each represent a tuple from your data set. Each swatch
can have a colored shape and has a caption. The list of swatches is based on the list of tuples on the slot
that is represented by the legend.
The legend can also have a title, as shown in the season example. The title if often derived from the data
item that the legend represents.
Continuous legends
A continuous legend shows the range of a value. The range can be expressed as a size range or a color
range. The channel property of a slot is used to distinguish between the two.
The images above shows a color legend and a size legend. The title of these legends is, like the
categorical legend, which is derived from the data item that the legend represents.
Enabling legends
In general the only thing, you need to do as a bundle developer is provide the “Visualization definition” on
page 33 of your visualization. The Vizdef.xml file needs a few entries that allow RenderBase to
determine if and how a legend should be created. If your “Visualization definition” on page 33 has the
required entries, then RenderBase creates the right data structures and passes them to the host
application.
Legends are tied to the slot entries in your “Visualization definition” on page 33. Each slot in the vizdef
has an optional attribute called channel. The channel determines the encoding type of a legend and can
have the values color and size. The color type can be used for both categorical (colored swatches) and
continuous legends (color range). The size type is used for continuous legends only (size range). If a slot
has one of the known channel types, a legend for that slot is rendered.
For slots with the color channel, you define a palette property. This allows the host application to assign a
custom color scheme to the visualization and legend items. If no palette is available for the slot, then no
legend is rendered for that slot.
20 IBM Cognos Analytics Version 11.1.0 : Custom Visualizations Developer GuideNote: In the following example, the palette does not have an explicit type attribute. If the palette is
linked to a slot, the palette type is determined by the type of linked slot.
Modifying legends
In some specific situations, you want to change the information that is rendered in a legend. For example,
you might decide that based on a certain condition a legend might be visible or invisible. RenderBase has
a method that is called updateLegend that can be overridden to provide such behavior. You can either
modify the automatically created legend, or provide a new one.
protected updateLegend( _data: DataSet ) : Encoding[]
{
// Only show legend for 'heat' or 'categories', not both.
const filterSlot = _data.cols[ HEAT ].mapped ? "heat" : "categories";
// Only show a legend that matches `filterSlot`.
return super.updateLegend( _data ).filter( _e => _e.slot === filterSlot );
}
The following example shows how to have the items in a categorical legend in reverse order and the
legend title in uppercase:
public updateLegend( _data: DataSet ) : Encoding[]
{
// Create default legend information.
const legend = super.updateLegend( _data );
// If legend is categorical, make caption upper case and reverse items.
legend.forEach( _e =>
{
if ( _e instanceof CatEncoding )
{
_e.caption = _e.caption.toUpperCase();
_e.entries.reverse();
}
} );
return legend;
}
The API for creating and modifying legend needs the following import:
import { Encoding, CatEncoding, ContEncoding } from "@businessanalytics/customvis-lib";
Properties
A visualization can display one or more properties to allow the user of the visualization to control certain
aspect of the visualization.
The “Visualization definition” on page 33 holds the property definitions for a visualization. Reading
property values and active state can be done through the properties attribute of Renderbase.
Chapter 4. Customvis library 21Property locking
During rendering, all properties can be considered in a locked state. This means that the host application
can still modify property values, but these new values will not be available to the visualization until the
next render operation. This ensures that in your visualization you can rely on a property value during for
instance a long running animation.
If the visualization needs to have synchronous access to properties, use properties.peek. This returns
the value of the property that was set by a hosting application without caring about locking.
Another way to get synchronous access to a property value is to override the “updateProperty” on page
27 method. This method is called directly when the property value changes and no locking is applied. A
visualization typically uses the updateProperty method only if it wants to update the active state of
properties based on the value of other properties.
Property values
Each property has a value that is based on one of the predefined property types:
• number
• string
• boolean
• font
• color
• palette
• length
A RenderBase subclass can access the properties either through this.properties or through the
UpdateInfo object that is passed in the “updateProperty” on page 27 method.
If you want to retrieve the value of a property, you can call the get method on the properties object. The
get function returns the property value as either a native type (for number, string and boolean) or an
object (for color, font, length, and palette).
javascript
var ticks = this.properties.get( "numTicks" );
assert( typeof ticks === "number" );
var title = this.properties.get( "title" );
assert( typeof title === "string" );
var color = this.properties.get( "backgroundColor" );
assert( typeof color = "string" );
Dirty properties
When a hosting application changes the value of a property, then that property becomes dirty. The
property will remain dirty until after the next render operation. This gives a visualization the opportunity to
process dirty properties during update. The dirty state of a property can be retrieved by calling
properties.getDirty(). In some cases, rendering performance can be optimized by only processing
properties that changed since the last update operation.
Active & inactive properties
A property can be marked as active or inactive. The active state of a property is an indication for a host
whether it should show the property in the UI as enabled or disabled.
The visualization can control the active state of a property through the properties.setActive()
method, or retrieve the active state of a property using properties.isActive(). Typically, properties
should be made active or disabled in the updateProperty method of Renderbase. This method is called
22 IBM Cognos Analytics Version 11.1.0 : Custom Visualizations Developer Guideat initialization time of the visualization and each time a property changes its value. For more information
and a code sample, see “updateProperty” on page 27.
Property Groups
Properties can be organized in groups and subgroups. This allows the hosting application to show this
group organization in the UI. Any number of groups and subgroups is possible, but it is recommended to
stick with a limited grouping depth.
There are two built-in property groups that are called visualization and text. These groups have a
special meaning to the hosting application. If both these groups are available, then a set of automatically
generated legend properties, are added to these two groups. If either of these groups is not available,
then a new group that is called legend is generated and used for the automatically generated legend
properties.
The only party that is interested in property groups is the hosting application. Therefore, the RenderBase
implementation does not have access to property groups. The only thing the visualization developer does
is define the property groups in the “Visualization definition” on page 33.
Palettes
A palette is a special type of property that you can use to determine a color based on a tuple or a value.
Palettes come in two different types: categorical palettes and continuous palettes. A categorical palette is
used when you want to assign a distinct color to each tuple in a slot. A continuous palette is used if you
want to use a color to represent a numerical value.
Categorical palettes
A categorical palette lets you retrieve a color based on a tuple. You define a categorical palette for the
visualization in the “Visualization definition” on page 33:
When you define a palette property in your vizdef.xml file, you can access the palette like any other
property:
protected update( _info: UpdateInfo ): void
{
// Retrieve the palette and cast to CatPalette.
const palette = _info.props.get( "colors" ) as CatPalette;
// Get the series tuples from column 2 in the data set.
const seriesTuples = _info.cols[ 2 ].tuples;
// Retrieve a color for each tuple in the list.
const colors = seriesTuples.map( _tuple => palette.getColor( _tuple ) );
}
A common example of using categorical palettes is when you want to set the color of an element that is
bound to data. For example, the following code shows all tuples of the series slot in a list and assigns a
different color to each element:
protected update( _info: UpdateInfo ): void
{
// Retrieve the tuples from slot 0. If the data was cleared, then
// use an empty list to indicate there are no tuples.
const tuples = _info.data ? _info.data.cols[ 0 ].tuples : [];
// Create a scale based on visualization height and tuple keys.
const scale = d3.scaleBand()
.range( [ 0, _info.node.clientHeight ] )
.domain( tuples.map( _t => _t.key ) );
const palette = _info.props.get( "color" ) as CatPalette;
Chapter 4. Customvis library 23const svg = d3.select( _info.node );
// For each tuple, create an svg text element and assign a color
// from the palette.
svg.selectAll( "text" ).data( tuples, ( t: any ) => t.key )
.join( "text" )
.attr( "y", t => scale( t.key ) )
.attr( "fill", t => palette.getFillColor( t ) )
.text( t => t.caption );
}
Notice the use of getFillColor in the code above. The difference between getColor and
getFillColor is that the latter will look at the selected state of the tuple and adjust the color to make it
lighter if the tuple should appear as deselected. Since you are binding actual tuples to our text elements,
you get hit testing for free. This means that the user can click a tuple to select it and see the color of the
other tuples change automatically.
Continuous palettes
A continuous palette can return a color based on a numerical value. You define a palette for a visualization
in the “Visualization definition” on page 33:
Retrieving colors from a continuous palette is a two-step process:
1. Get the ColorStops of the palette by providing a slot instance. The slot instance should match the
slot name that was specified in the vizdef.
2. On the ColorStops instance, call getColor passing a numerical value.
Both the ContPalette and the ColorStops class have a getFillColor and getOutlineColor
method that lets you retrieve a color based on a data point. This can be useful if your visualization needs
to render elements that should reflect the selection or highlight state of the data. An example of a scatter
chart visualization:
protected create( _node: HTMLElement ): void
{
// Create an svg node that resizes to the visualization.
d3.select( _node ).append( "svg" ).attr( "width", "100%" ).attr( "height", "100%" );
}
protected update( _info: UpdateInfo ): void
{
const data = _info.data;
// Determine the size of the visualization
const width = _info.node.clientWidth;
const height = _info.node.clientHeight;
// Determine the value domain for x and y.
const domainX = data ? data.cols[ 1 ].domain.asArray() : [ 0, 0 ];
const domainY = data ? data.cols[ 2 ].domain.asArray() : [ 0, 0 ];
// Create linear scales for positioning the data points.
const scaleX = d3.scaleLinear().range( [ 0, width ] ).domain( domainX );
const scaleY = d3.scaleLinear().range( [ height, 0 ] ).domain( domainY );
const palette = _info.props.get( "color" ) as ContPalette;
// Render a circle with fixed radius for each data point.
const svg = d3.select( _info.node ).select( "svg" );
svg.selectAll( "circle" ).data( data ? data.rows : [] )
.join( "circle" )
.attr( "cx", d => scaleX( Number( d.value( 1 ) ) ) )
.attr( "cy", d => scaleY( Number( d.value( 2 ) ) ) )
.attr( "r", 12 )
.attr( "stroke-width", 2 )
// Stroke and fill color are based on selected and highlighted state.
.attr( "stroke", d => palette.getOutlineColor( d ) )
24 IBM Cognos Analytics Version 11.1.0 : Custom Visualizations Developer GuideYou can also read