ICQB Introduction to Computational & Quantitative Biology (G4120) Fall 2020 Oliver Jovanovic, Ph.D. Columbia University Department of Microbiology ...
←
→
Page content transcription
If your browser does not render page correctly, please read the page content below

ICQB
Introduction to Computational & Quantitative Biology (G4120)
Fall 2020
Oliver Jovanovic, Ph.D.
Columbia University
Department of Microbiology & Immunology

                                    Lecture 11: Introduction to R and RStudio
                                                           December 8, 2020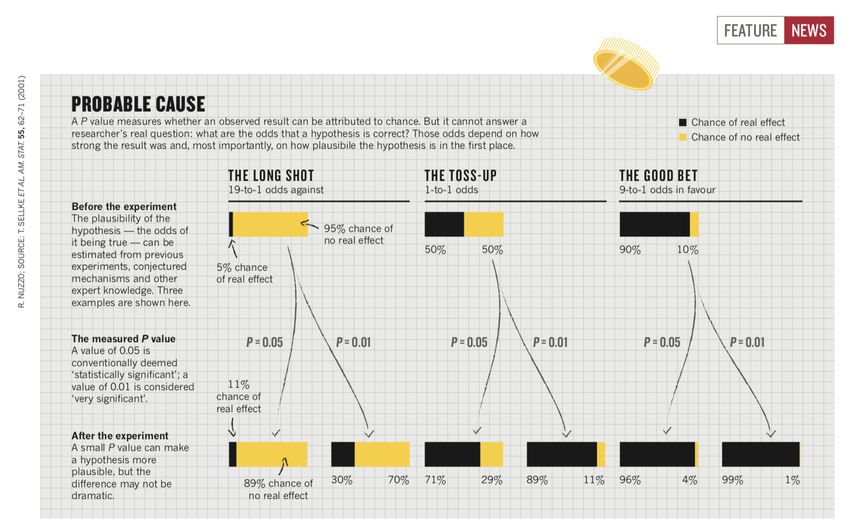
R and RStudio
The R programming language was released in 1993 by Ross Ihaka and Robert Gentleman,
statisticians at the University of Aukland in New Zealand. Their original goal was to develop a
statistics language suitable for teaching in their Mac computer lab. The language’s name is a
reference the S programming language for statistics, which was one of their inspirations, and
also refers to the first names of the authors.

R is free and open source, released under the GNU General Public License, and supported by
a community of open source developers at the Comprehensive R Archive Network, which
serves as a repository for R and free third party R software, and currently contains 16,735
packages.

R has become one of the most popular programming languages used by statisticians and
data miners, and is well established in bioinformatics. The current Bioconductor repository
contains 1,974 free, open source bioinformatics and genomics packages for R.

RStudio is a free, open source, Integrated Development Environment (IDE) for the R
programming language that provides R with a simple graphical user interface and useful
development tools. It runs on Mac, Windows and Linux.

Source: https://www.r-project.org and https://cran.r-project.org and https://bioconductor.org and https://www.rstudio.com

                                                                           Lecture 11: Introduction to R and RStudio
                                                                                                  December 8, 2020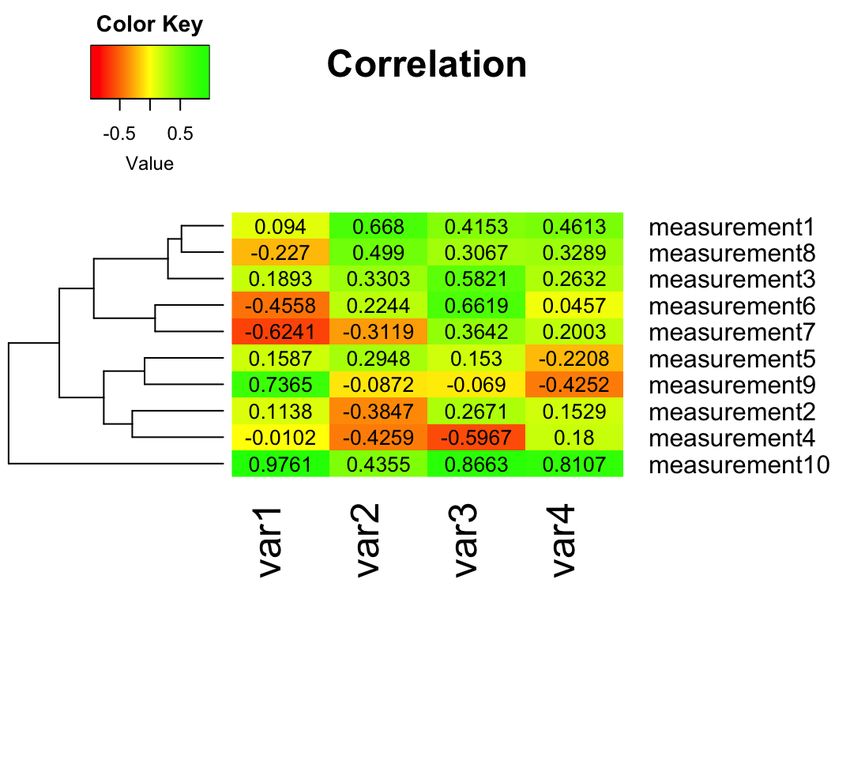
Installing R Packages
Additional third-party packages for R can be browsed for at the Comprehensive R Archive Network
(CRAN) at http://cran.r-project.org or searched and browsed for at http://www.rdocumentation.org
(which also includes package documentation and download statistics).

Installation of third-party packages is handled by the built-in install.packages() function, e.g.
install.packages("ggplot2"). Run update.packages() beforehand to make sure your other
packages are up to date. In RStudio, you can simply use Tools > Install Packages...

R packages are installed into libraries, which are directories containing a subdirectory for each package
installed there. To load a package, use the library() function, e.g. library("ggplot2")

Some notable third-party R packages include:

ggplot2, a plotting system featuring a variety of plots, statistical transformations and display options.

plotly, an interface to interactive online plot.ly graphs.

plyr, tools for splitting, applying and combining data (or dplyr for data frames).

shiny, an interactive web application framework for Shiny servers or cloud hosting.

stringr, makes R string functions more consistent, simpler and easier to use.

                                                                    Lecture 11: Introduction to R and RStudio
                                                                                           December 8, 2020
Graphing Error Bars with R error.bar
Graphing Error Bars with ggplot2
install.packages("ggplot2")
library("ggplot2")

data
Graphing Error Bars
With R With R and ggplot2
Lecture 11: Introduction to R and RStudio
December 8, 2020Bioconductor
Bioconductor is a set of free, open source, primarily R based tools for bioinformatics and
computational biology focused on the analysis and comprehension of high-throughput
genomic data. First released in 2001, the current version, 3.12, was released in October 2020
and consists of 1,974 software packages, 398 experiment data packages, 971 annotation
packages and 28 workflow packages.
Bioconductor provides statistical and graphical methods for the analysis of genomics and
proteomics data, including numerous packages for parsing and analyzing biological data from
various sources: ChIP-seq, DNA sequencers (including Illumina, IonTorrent and Roche 454), flow
cytometry, microarray (including Affymetrix and Illumina), qPCR, RT-qPCR, RNA-Seq and SNP.
Bioconductor includes annotation packages for assembling and processing genomic
annotation data from a variety of databases (including GenBank, GO, Entrez, UniGene and the
UCSC Human Genome Project) or associating microarray and other genomic data in real time
with biological metadata from web databases (including GenBank, Entrez genes and PubMed).
The basic Bioconductor installation only installs a set of core packages and functions (Biobase,
BiocGenerics, BiocInstaller and GenomeInfoDb). To install additional Bioconductor packages,
use the BiocManager::install() function.
Source: https://www.bioconductor.org
Lecture 11: Introduction to R and RStudio
December 8, 2020Installing Bioconductor Packages
Browse or search for additional Bioconductor packages at:
https://www.bioconductor.org/packages/release/ or http://
www.rdocumentation.org
To install the core Bioconductor packages in a new R installation, use:
if (!requireNamespace("BiocManager", quietly = TRUE))
install.packages("BiocManager")
BiocManager::install(version = "3.12")
To install additional Bioconductor packages, use:
BiocManager::install("packagename")
e.g. BiocManager::install("Biostrings")
Update all/some/none? [a/s/n]: a
Do you want to install from sources the package which needs compilation?
(Yes/no/cancel) no
(Would need to install RTools if a package absolutely requires compilation.)
Lecture 11: Introduction to R and RStudio
December 8, 2020Bioconductor Packages
annotate, functions for extracting data from meta-data libraries (including NLM
and NCBI), geneplotter support, HTML output.
Biostrings, string objects and algorithms for working with biological sequence
data.
CummeRbund, exploration, analysis and visualization of Cufflinks high-
throughput RNA-Seq data.
DESeq2, differential gene expression analysis based on the negative binomial
distribution.
edgeR, differential expression analysis of RNA-seq and digital gene expression
profiles with biological replication.
geneplotter, graphic related functions for plotting genomic data.
phyloseq, handling and analysis of high-throughput microbiome census data.
Lecture 11: Introduction to R and RStudio
December 8, 2020Biostrings
Biostrings for R
The Biostrings package allows for efficient manipulation of large strings of
biological sequence data in R.
BiocManager::install("Biostrings")
library("Biostrings")
browseVignettes("Biostrings")
BioStrings contains functions for reading, writing, analyzing and manipulating
strings of DNA, RNA or amino acids. Functions exist to count letter frequencies,
n-mer frequencies, and create consensus matrices. Basic functions can
reverse, complement, reverse-complement or translate strings of biological
sequence data. Other functions allow for pattern matching, finding
palindromes, and performing global or local alignments.
Lecture 11: Introduction to R and RStudio
December 8, 2020Heatmaps with R
Lecture 11: Introduction to R and RStudio
December 8, 2020Heatmaps with Bioconductor
Lecture 11: Introduction to R and RStudio
December 8, 2020Statistics and Hypothesis Testing
The P value is the probability of obtaining test results at least as extreme as the
observed results when the null hypothesis (H0) of a study is true. A small p-
value means that an extreme observation would be very unlikely under the null
hypothesis. Type I error is the false rejection of the null hypothesis and type II
error is the false acceptance of the null hypothesis.
In biology, P < 0.05, or P < 5% (within two sigma values of a normal distribution
of data) is considered statistically significant. Although this is conventionally
considered to be only a 1 in 20 chance of being wrong, this can be misleading.
P values do not account for issues such as conscious or unconscious bias or
variation in data collection, analysis, or reporting. P values also do not take into
account how likely the underlying hypothesis actually is, and assume single
tests.
In high energy physics, three sigma P values (P < 0.003) are only considered
evidence, and five sigma P values (P < 0.0000003) are the standard for new
discoveries.
Lecture 11: Introduction to R and RStudio
December 8, 2020Statistical Inference for Hypothesis Testing
Null Hypothesis (H0)
A hypothesis that contradicts the theory you would like to prove. For example,
T53 expression in a tumor is the same as in normal tissue.
Alternative Hypothesis (H1)
The hypothesis associated with the theory you would like to prove. For example,
T53 expression in a tumor is different from normal tissue.
Test Statistic (T)
A quantity derived from the sample that follows a definite distribution under the
null hypothesis. For example, the Student’s t-distribution.
Extreme Event
An unusual event that is unlikely to happen if the null hypothesis were true.
P Value (p-value)
The probability, assuming the null hypothesis is true, of observing a result at least
as extreme as the test statistic.
Lecture 11: Introduction to R and RStudio
December 8, 2020Commonly Used Statistical Tests
Student’s t Test
Used where samples follow normal distribution. The Kolmogorov–Smirnov test
can be used to assess normality.
Wilcoxon Rank-sum Test (Mann–Whitney U Test)
Used where samples are independent.
Wilcoxon Signed-rank Test
Used where samples are matched or dependent.
Analysis of Variance (ANOVA)
Test whether or not the means of several groups are equal. The variance of each
group should be the same. Bartlett's test can be used to test that variances are
equal for all samples.
Fisher’s Exact Test
Used to determine if there are nonrandom associations between two nominal
variables in a small sample. For example, gene set enrichment analysis.
Lecture 11: Introduction to R and RStudio
December 8, 2020Selecting a Proper Statistical Test
• What is the underlying distribution of your data?
• What is the hypothesis you are testing?
• What assumptions does your test method make?
A possible scheme for a two sample comparison:
Normal distribution?
(Kolmogorov– Smirnov test)
YES NO
Samples are matched? Samples are matched?
YES NO YES NO
Pairwise t-test Unpaired t-test Wilcoxon Wilcoxon
signed-rank test rank-sum test
Lecture 11: Introduction to R and RStudio
December 8, 2020Correcting for Multiple Tests
Single Tests
P value gives the probability of a test being wrong. In a single test, done appropriately, a
P value of .05 should result in only a 5% chance of a false positive.
Multiple Tests
If running 20 tests, the odds that there will be no false positive are B(20,0.05) = 0.358,
which means that you have a 0.642 or 64.2% chance of a false positive. One must be
cautious when running multiple tests or testing multiple hypothesis to not arrive at a false
conclusion.
False Discovery Rate (FDR)
The false discovery rate is the number of false positives in all the rejected hypothesis.
Adjustments for Multiple Tests
Statistical adjustments can be made when running multiple tests to reduce the number of
false positives. The Benjamini-Hochberg procedure uses a Q value to control the FDR. A
P value of 5% should result in 5% of all tests being false positives. A Q value of 5% should
result in only 5% of significant results being false positives. A Bonferroni correction is
another adjustment that can also be used for multiple tests.
Lecture 11: Introduction to R and RStudio
December 8, 2020Are Most Published Research Findings True?
Replication studies, statistical simulations and statistical analysis have demonstrated that many, or even
most published research findings may in fact be false. How is this possible?
Of 49 highly cited original clinical research studies, 45 claimed that an intervention was effective. Of
these, 7 (16%) were contradicted by subsequent studies, 7 others (16%) had effects that were found to be
much weaker in subsequent studies. Of these 14 questionable studies (32%), 5 came from 6
nonrandomized studies (83%). The questionable studies were published in the N. Engl. J. Med. (10),
JAMA (2) and Lancet (2). 1
A random sample of 20 published psychology studies that controlled for a covariate found that 75%
had a p-value suspiciously close to 0.05. 2
An attempt to replicate 100 high profile studies in psychological science published in three high-ranking
psychology journals yielded significant findings in only 36% of the replications, versus 97% in the
original studies. Nearly two thirds of the results could not be replicated. 3
An attempt to replicate 21 social and behavioral science papers published in Nature and Science found
that only 13 (62%) could be replicated, and even then, the estimated effect was significantly weaker. 4
1Ioannidis, J. (2005) Contradicted and initially stronger effects in highly cited clinical research. JAMA 294: 218-228.
2 Simonsohn, U., Nelson, L. and Simmons, J. (2014) P-Curve: A key to the file-drawer. Journal of Experimental Psychology, 143: 534-547a.
3 Open Science Collaboration (2015) Estimating the reproducibility of psychological science. Science 349: aac4716
4 Camerer, C.F., Dreber, A., et al. (2018) Evaluating the replicability of social science experiments in Nature and Science between 2010 and
2015. Nature Human Behaviour 2: 637–644.
Lecture 11: Introduction to R and RStudio
December 8, 2020Blame it on the Antibodies?
Source: Baker, M. (2015) Reproducibility crisis: Blame it on the antibodies. Nature 521: 274-276.
Lecture 11: Introduction to R and RStudio
December 8, 2020What About P Values?
Source: https://xkcd.com/882/
Lecture 11: Introduction to R and RStudio
December 8, 2020An Unreliable Standard
A P value only summarizes the data assuming a specific null hypothesis, it cannot evaluate the underlying truth of
the matter, and can be quite misleading. If the underlying probability of the effect being true is 50/50, a P value of
0.01 corresponds to a false positive probability of 11%, a P value of 0.05 results in a 29% chance of a false positive.
Source: Nuzzo, R. (2014) Statistical Errors. P values, the 'gold
Lecture 11: Introduction to R and RStudio
standard' of statistical validity, are not as reliable as many
scientists assume. Nature 506: 150-152. December 8, 2020P-Hacking
Scientists tend to report only studies (publication bias) or analyses (p-hacking) that "work," as a result
published evidence can be unrepresentative of reality. Flexibility in data collection, analysis, and reporting
dramatically increases actual false-positive rates. In many cases, a researcher is more likely to falsely find
evidence that an effect exists than to correctly find evidence that it does not. Researchers can even
repeatedly obtain evidence supporting a false hypothesis.
With a standard P value of .05, complete flexibility in (a) choosing among dependent variables, (b) choosing
sample size, (c) using covariates, and (d) reporting subsets of experimental conditions can result in a
remarkably high 61% false positive rate.
How to Prevent P-Hacking?
1. Authors must decide the rule for terminating data collection before data collection begins and report this
rule in the article.
2. Authors must collect at least 20 observations per cell or else provide a compelling cost-of-data-
collection justification.
3. Authors must list all variables collected in a study.
4. Authors must report all experimental conditions, including failed manipulations.
5. If observations are eliminated, authors must also report what the statistical results are if those
observations are included.
6. If an analysis includes a covariate, authors must report the statistical results of the analysis without the
covariate.
Source: Simmons, J., Nelson, L. and Simonsohn, U. (2011) False-positive psychology: Undisclosed flexibility in data collection and analysis
allows presenting anything as significant. Psychological Science 22: 1359-1366.
Lecture 11: Introduction to R and RStudio
December 8, 2020How Could Most Published Research Findings Be False?
Study Size and Effect Size
The smaller the study and the smaller the effect being measured, the less likely the
research findings to be true. A single study may have a very high false positive rate,
depending on how it was conducted. If true effect sizes are very small, such as the
contribution of a singe gene to a complex disease, the false positive rate is likely to be
very high.
Pre Study Odds
The greater the number and the lesser the selection of tested relationships in a scientific
field, the less likely the research findings are to be true.
Researcher Degrees of Freedom
The greater the flexibility in designs, definitions, outcomes, and analytical modes in
a scientific field, the less likely the research findings are to be true.
Bias
Conflicts of interest and prejudice are rarely properly accounted for, but can significantly
decrease the probability of a research finding being true.
Source: Ioannidis, J. (2005) Why most published research findings are false. PLoS Medicine 2: e124.
Lecture 11: Introduction to R and RStudio
December 8, 2020Peer Review and Grant Funding
Peer Review Scores Are Poor Predictors of Productivity
NIH peer review scores have been found to be poor predictors of grant
productivity among the top 20% of grant proposals. Furthermore, the number
of reviewers is inadequate to provide statistical precision. It appears that
reviewer bias may influence as many as 25% of funding decisions.
How to Improve Grant Funding
Substantially increasing the number of reviewers, or using a lottery system to
select from the top 20% of grant proposals would provide significantly better
results.
Sources:
Fang, F., Bower, A. and Casadevall, A. (2016) NIH peer review percentile scores are poorly predictive of
grant productivity eLife 5: e13323.
Kaplan, D., Lacetera, N. and Kaplan, C. (2008) Sample size and precision in NIH peer review PLoS One 3:
e2761.
Lecture 11: Introduction to R and RStudio
December 8, 2020Misconduct and Error
A detailed review of all 2,047 biomedical and life-science research articles
indexed by PubMed as retracted on May 3, 2012 revealed that only 21.3% of
retractions were attributable to error. In contrast, 67.4% of retractions were
attributable to misconduct, including fraud or suspected fraud (43.4%),
duplicate publication (14.2%), and plagiarism (9.8%). Incomplete, uninformative
or misleading retraction announcements have led to a previous
underestimation of the role of fraud in the ongoing retraction epidemic. The
percentage of scientific articles retracted because of fraud has increased
approximately 10-fold since 1975. Retractions exhibit distinctive temporal and
geographic patterns that may reveal underlying causes.
Note that at the time of the review, PubMed featured over 25 million
biomedical and life-science research articles. How likely is it that the actual rate
of misconduct and error is only 1 in 1,000 publications?
Source: Fang, F.C., Grant Steen, R. and Casadevall, A. (2012) Misconduct accounts for the majority of
retracted scientific publications. Proc. Natl. Acad. Sci. U.S.A. 109: 17028-17033.
Lecture 11: Introduction to R and RStudio
December 8, 2020Actual Rates of Misconduct
Images from 20,621 papers published in 40 scientific journals from 1995 to
2014 were visually screened. Overall, 3.8% of published papers were found to
contain problematic figures, with at least half (nearly 2%) exhibiting features
suggestive of deliberate manipulation. The prevalence of papers with
problematic images has risen markedly since 2002, and appeared more likely
to occur in papers originating in China and India. Additional papers written by
authors of papers with problematic images had an increased likelihood of
containing problematic images as well.
Journals that screen for image manipulation have much lower rates of
problematic images, suggesting a simple way to improve reliability for this
particular type of data.
As this analysis focused only on one type of data, it is likely that the actual
prevalence of misconduct in the published literature is higher.
Source: Bik, E.M., Casadevall, A. and Fang, F.C. (2016) The prevalence of inappropriate image duplication
in biomedical research publications. mBio 7: e00809-e00816.
Lecture 11: Introduction to R and RStudio
December 8, 2020How to Make More Published Biomedical Research True
Currently, many published biomedical research findings are false or exaggerated, as a
result, a significant portion of biomedical research resources are wasted. A number of
approaches that have proved successful in other fields, such as physics, could be
used to significantly improve on current biomedical research practices:
• Large-scale collaborative research
• Adoption of replication culture
• Registration (of studies, protocols, analysis codes, datasets, raw data, and results)
• Sharing (of data, protocols, materials, software, and other tools)
• Reproducibility practices
• Containment of conflicted sponsors and authors
• More appropriate statistical methods
• Standardization of definitions and analyses
• More stringent thresholds for claiming discoveries or "successes"
• Improvement of study design standards
• Improvements in peer review, reporting, and dissemination of research
• Better training of scientific workforce in methods and statistical literacy
Source: Ioannidis, J. (2014) How to make more published research true. PLOS Medicine 11: e1001747.
Lecture 11: Introduction to R and RStudio
December 8, 2020How to Question Statistics
Who says so?
Look for conscious or unconscious bias.
How do they know?
Look for statistical significance. How much of an effect is there?
Did somebody change the subject?
Are the results and discussion actually supported by the data?
Does it make sense?
How likely was this result in the first place? Has it been replicated?
"The weight of evidence for an extraordinary claim must be proportioned to its
strangeness." – Pierre-Simon Laplace
Source: How to Lie With Statistics by Darrel Huff
Lecture 11: Introduction to R and RStudio
December 8, 2020References
A Little Book of R for Bioinformatics free at:
https://a-little-book-of-r-for-bioinformatics.readthedocs.org/en/latest/
Bioconductor Short Courses free at:
https://www.bioconductor.org/help/course-materials/
How to Lie With Statistics by Darrel Huff
Practical Statistics for Data Scientists: 50+ Essential Concepts Using R and
Python, 2nd Edition by Peter Bruce, Andrew Bruce and Peter Gedeck
Lecture 11: Introduction to R and RStudio
December 8, 2020You can also read