IDAHO HIGHWAY SAFETY PLAN FFY 2022 - OFFICE OF HIGHWAY SAFETY IDAHO TRANSPORTATION DEPARTMENT 3311 West State St., Boise, ID 83703 - NHTSA
←
→
Page content transcription
If your browser does not render page correctly, please read the page content below
IDAHO HIGHWAY SAFETY PLAN
         FFY 2022

               OFFICE OF HIGHWAY SAFETY
               IDAHO TRANSPORTATION DEPARTMENT
                  3311 West State St., Boise, ID 83703

                                                         0
Table of Contents
Executive Summary ............................................................................................................................................................. .3
   Establishing Targets and Performance Measures .......................................................................................................................... 3
   Primary Performance Measures, Benchmarks and Strategies ....................................................................................................... 4

Organization and Staffing ................................................................................................................................................... 5
   Organizational Chart ...................................................................................................................................................................... 6
   Office of Highway Safety Program Team ....................................................................................................................................... 6

Planning Process ................................................................................................................................................................... 7
   Process Descriptions ....................................................................................................................................................................... 7
   Project Selection and Development ................................................................................................................................................ 8
   Linking with the Strategic Highway Safety Plan ............................................................................................................................. 9
   Timeline and Annual Highway Safety Planning Calendar............................................................................................................. 10
   Evidence Based Traffic Safety Enforcement Program................................................................................................................... 10
   High Visibility Enforcement (HVE) Traffic Safety Mobilizations .................................................................................................... 14
   Law Enforcement Adjudication Process ........................................................................................................................................ 14

Strategic Partners and Stakeholders.............................................................................................................................. 15
   Idaho Traffic Safety Commission (ITSC) ........................................................................................................................................ 15

Performance Plan ............................................................................................................................................................... 16
   2022 Performance Plan ................................................................................................................................................................ 17
   Performance Report ..................................................................................................................................................................... 18

Identification Report .......................................................................................................................................................... 23
   State Demographics ..................................................................................................................................................................... 23

Idaho Problem Identification Report FY 2021 ............................................................................................................. 24
   Statewide ...................................................................................................................................................................................... 25
   Aggressive Driving ........................................................................................................................................................................ 27
   Distracted Driving ......................................................................................................................................................................... 28
   Safety Restraints ........................................................................................................................................................................... 29
   Impaired Driving ........................................................................................................................................................................... 30
   Youthful Drivers ............................................................................................................................................................................ 31
   Mature Drivers.............................................................................................................................................................................. 32
   Motorcycles .................................................................................................................................................................................. 33
   Pedestrians and Bicyclists ............................................................................................................................................................. 34
   Crash Response (EMS) .................................................................................................................................................................. 35
   Commercial Motor Vehicles.......................................................................................................................................................... 36
   Drowsy Driving Crashes ................................................................................................................................................................ 37
   Single-Vehicle Run-off-Road Crashes ............................................................................................................................................ 38
   Intersection Crashes ..................................................................................................................................................................... 39
   Head-on and Side Swipe Opposite Direction Crashes ................................................................................................................... 40
   Work Zone Crashes ....................................................................................................................................................................... 41
   Crashes with Trains....................................................................................................................................................................... 42
   Cross Median Crashes ................................................................................................................................................................... 43
   School Bus Crashes ....................................................................................................................................................................... 44

High Safety Projects for FFY 2022 by Program Area .................................................................................................. 45
   Community Safety Traffic Program .............................................................................................................................................. 46
                                                                                                                                                                                                   1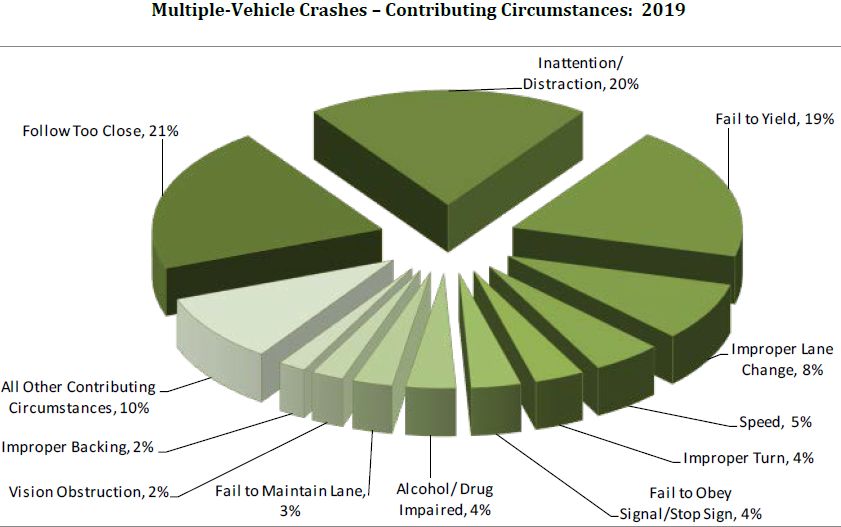
Distracted Driving ......................................................................................................................................................................... 49
   Impaired Driving (Drug and Alcohol) ............................................................................................................................................ 51
   Motorcycle Safety ......................................................................................................................................................................... 56
   Non-Motorized (Pedestrian and Bicyclists) ................................................................................................................................... 59
   Occupant Protection (Adult and Child Passenger Safety) ............................................................................................................. 61
   Planning and Administration ........................................................................................................................................................ 66
   Police Traffic Services ................................................................................................................................................................... 67
   Traffic Records and Roadway Safety ........................................................................................................................................... 75

FY 2022 Funding Plan ........................................................................................................................................................ 78

Section 405 Grant Programs ............................................................................................................................................ 79
   405b Occupant Protection .......................................................................................................................................... Attachment 1
   405c Traffic Records ................................................................................................................................................... Attachment 2
   405d Impaired Driving ................................................................................................................................................ Attachment 3
   405f Motorcycle .......................................................................................................................................................... Attachment 4

                                                                                                                                                                                               2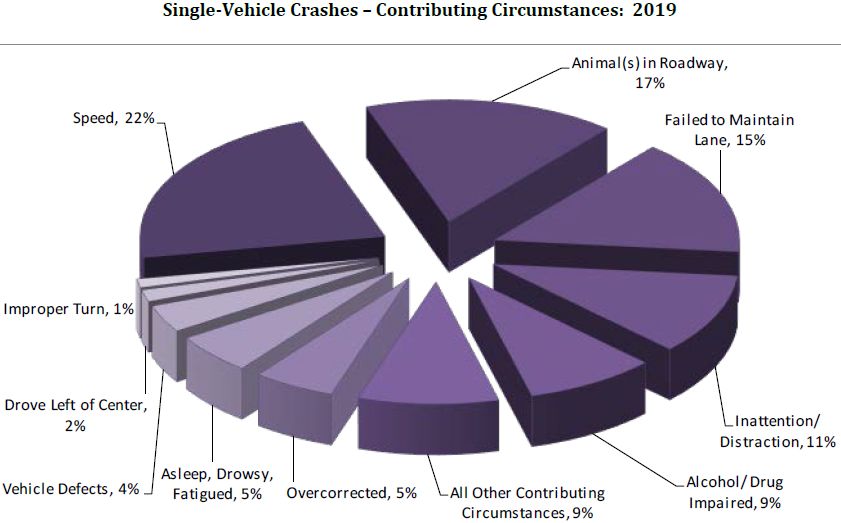
EXECUTIVE SUMMARY
According to the Highway Safety Act of 1966, 23 USC Chapter 4 Section 402, each state shall have a highway
safety program approved by the Secretary, designed to eliminate traffic crashes, deaths, injuries, property
damage and economic losses resulting from traffic crashes on Idaho roadways. In order to secure funding
each state must submit a Highway Safety Plan (HSP) to the National Highway Traffic Safety Administration
(NHTSA). The HSP must be a set of clear and measurable highway safety targets, descriptions of the process
used in determination of the highway safety problems, and the activities on how projects will address the
highway safety problems. This Idaho HSP for Federal Fiscal Year (FFY) 2022 serves as the State of Idaho’s
application to NHTSA for federal funds available under Section 402 State and Community Highway Safety
grant program and the Section 405 National Priority Safety Program.

Mission Statement
To eliminate traffic deaths, serious injuries, and economic losses from motor vehicle crashes through funding
programs and activities that promote safe travel on Idaho’s transportation systems, and through data
utilizing reliable crash statistics.

Vision
To be a leader in promoting safety on all of Idaho’s roadways in an efficient and effective manner.

Primary Target
Target the 5-year average number of traffic deaths to 245 or fewer by 2022.

Establishing Targets and Performance Measures
The primary focus of the highway safety program has been, and will continue to be, the elimination of traffic
related fatalities, serious injuries, and economic losses. The results of the problem identification process are
used by the Office of Highway Safety (OHS) to assure that resources are directed to areas most appropriate
for achieving the primary target and showing the greatest return on investment. Performance measures and
targets are consistent with both NHTSA requirements and the Strategic Highway Safety Plan (SHSP) targets
and are aligned with the Highway Safety Improvement Plan (HSIP).

The SHSP helps coordinate targets and highway safety programs across the state. The collaborative process
of developing and implementing the SHSP helps safety partners work together to reduce fatalities and serious
injuries on Idaho roadways.

The SHSP links to all other highway safety plans. The HSIP, a core Federal aid program administered by the
Federal Highway Administration (FHWA), requires that states update and regularly evaluate SHSPs. Other
federal aid programs under the Department of Transportation must also tie their programs to the SHSP.
These programs include the HSP and the Commercial Motor Vehicle Safety Program (CVSP), funded through
the Federal Motor Carrier Safety Administration (FMCSA). The shared data between the plans enables the
plans to have the same core targets.

The targets are determined by examining the trend of past data to determine likely future performance. The
OHS tries to set targets that are reasonable. An updated set of targets with the most current values were
presented to and approved by the Idaho Traffic Safety Commission (ITSC) at the October 2020 meeting.
                                                                                                             3
Primary Performance Measures, Benchmarks and Strategy
Targets are set and performance will be measured using five-year averages and five-year rates. For example,
the 2015-2019 benchmark is comprised of five years of crash data and exposure data for the years 2015
through 2019. NHTSA has instituted a set of eleven core outcome performance measures (C1 through C11)
and one core behavioral performance measure (B1) for which the States shall set targets and report
progress. There are three additional activity measures (A1 through A3) for which the states are required to
report progress on. For more information, see “Traffic Safety Performance Measures for States and Federal
Agencies (DOT HS 811 025), link:
http://www.nhtsa.gov/DOT/NHTSA/Traffic%20Injury%20Control/Articles/Associated%20Files/811025.pdf

In addition, states are required to have performance measures for state specific focus areas that fall outside
of the core measures. In Idaho these focus areas and corresponding measures include Distracted Driving
(I1), Mature Drivers (I2), Commercial Motor Vehicles (I3), Run-Off-Road (I4), Head-On/Side-Swipe Opposite
(I5), and Intersections (I6).

The data to be used in determining targets for the required performance measures (C1, and C3 through C11)
is provided to every State by the National Center for Statistics and Analysis (NCSA) and can be found at the
State Traffic Safety Information website:
https://cdan.nhtsa.gov/STSI.htm#.

The other performance measures are calculated using the yearly observed seat belt use rate (B1) which is
determined from the observational seat belt survey and the state crash data (C2, and I1 through I5). The
targets were presented to the ITSC in the November 2020 Performance Planning meeting and are the same
targets and performance measures presented in the Idaho Strategic Highway Safety Plan.

Targets are set and performance will be measured using five-year averages and five-year rates. For example,
the 5-Year Average Number of Fatalities is comprised of the sum of the number of fatalities over 5 years
divided by 5 (for the 2015-2019 Benchmark, that would be for the years 2015 through 2019). The 5-Year
Fatality Rate is the sum of the number of fatalities over the 5 year period divided by the sum of the annual
vehicle miles of travel over the same 5 year period. Averaging the rates over the 5 year period is
mathematically incorrect, the rates are weighted values and averaging them negates the weights (i.e. each
year is not equal because the Annual Vehicle Miles Traveled (AVMT) changes).

While using 5-year averages and rates smooth the trend lines by reducing the effect a randomly high or low
year has on the 5-year value, the trend lags behind when consistent changes are occurring. The number of
fatalities really started decreasing in 2008 and between 2010 and 2015 were much lower (ranging from 167
to 214) than they had been in the past (usually around 270 prior to 2008). While there were no changes to
Idaho’s highway safety programs or spending amounts from 2008-2015 when the decreases were taking
place, the nation was experiencing an economic recession. In the past few years, as the economy has
improved, the number of traffic fatalities has increased. As such, we are seeing an increasing trend in our
performance measures. Idaho’s targets will reflect that increasing trend and seek to keep values from
increasing back anywhere near to prior values.

                                                                                                           4
ORGANIZATION and STAFFING
The Office of Highway Safety (OHS), which is in the Highways Construction and Operations Division of the
Idaho Transportation Department (ITD), has a deep concern for the welfare of the traveling public, and
believe our main purpose is to save lives through creative, highly visible, innovative, and effective highway
safety programs for all modes of transportation. We are committed to our critical role within the State of
Idaho, and the rest of the nation, to ensure safe travel on Idaho’s roadways. As stewards, we have a
responsibility to make a positive impact on peoples’ lives.
ITD Director Brian W. Ness is the Governor’s Highway Safety Representative for Idaho. John Tomlinson is
the Highway Safety Manager for Idaho’s OHS.
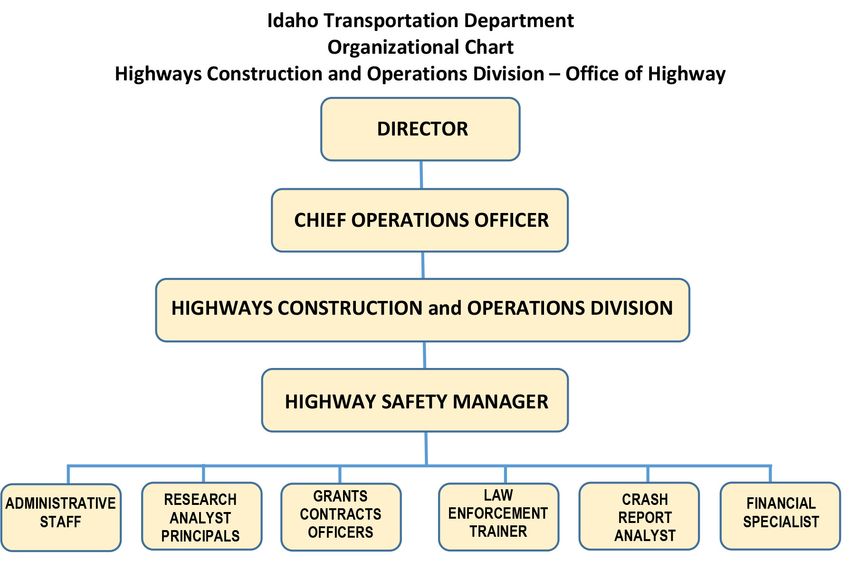
The Highway Safety Manager manages staff consisting of two research analyst principals, five grant
contract officers who manage the highway safety grants, one law enforcement trainer and five and a half
crash analysts. The communication specialist, financial specialist and administrative staff are not directly
managed by the highway safety manager.
The continuation and expansion of state and local partnerships is essential to our success. The primary
mission is to identify existing and emerging traffic safety trends through statistically-based problem
identification efforts, to efficiently provide decision makers with accurate data for use in determining
where the most effective highway safety investment is made. This includes the task to develop and
implement highway safety programs that save lives and prevent injuries, and to provide appropriate safety
funds that empower communities to address critical local traffic safety issues.
As highway safety professionals, we are committed to teamwork, integrity and maintaining a positive
working environment. In our highway safety partnerships, we respond, cooperate, and provide accurate
and timely service. We are a leader in a coordinated statewide effort to eliminate death and serious injury
on all of Idaho’s roadways.
5
Office of Highway Safety Program Team

     John Tomlinson Highway Safety Manager
           Steve Rich Research Analyst Principal-Annual Traffic Crash report, Seat Belt Survey
      Kelly Campbell Research Analyst Principal-Traffic Records/Roadway Safety Program, TRCC,
                        E-Citation
    Denise Dinnauer Bicycle/Pedestrian Program, Year-Long Police Traffic Safety Grants, Materials
                        Management
        Bill Kotowski Paid media, Communications, Social Media, Website, Quick Notes, Highway
                        Safety Summit, LELs, Community Outreach
         Lisa Losness Impaired Driving Program, TSRP, SIDC, Highway Safety Planning, Financial and
                        Compliance Speicalist
Josephine Middleton Distracted Driving Program, Aggressive Driving Program, Mobilizations, Mini-
                        grants
       Tabitha Smith Occupant Protection and Child Passenger Safety Programs, Seat Belt Survey,
                        Alive @ 25, Motorcycle
         Carrie Akers FARS (Fatality Analysis Reporting System) Analyst and Crash Analyst
    Patti Fanckboner Crash Analyst and Backup FARS Analyst
    Leslie De La Cruz Crash Analyst
       David Prosser Crash Analyst
       Julie Whistler Crash Analyst
             Jill Young ITD Financial Specialist
       Kirstin Weldin Program Planning and Development Specialist
                                                                                                     6
PLANNING PROCESS
The Office of Highway Safety (OHS) administers the Federal Highway Safety Grant Program, which is
funded by formula through the transportation act titled Fixing America’s Surface Transportation Act (FAST
Act), and the Highway Safety Act of 1966. The goal of the program is to eliminate deaths, injuries, and
economic losses resulting from traffic crashes on all Idaho roadways by implementing programs designed
to address driver behaviors. The purpose of the program is to provide funding at the state and community
level, for a highway safety program addressing Idaho’s own unique circumstances and particular highway
safety needs.
Process Descriptions
A “traffic safety problem” is an identifiable subgroup of drivers, pedestrians, vehicles, or roadways that is
statistically higher in crash experience than normal expectations. Problem identification is a data driven
process that involves the study of relationships between traffic crashes and the population, licensed
drivers, registered vehicles, and vehicle miles traveled, as well as characteristics of specific subgroups that
may contribute to crashes.
The process used to identify traffic safety problems began by evaluating Idaho’s experience in each of the
NHTSA eight highway safety priority areas [Alcohol/Drugs and Impaired Driving; Occupant Protection
(Safety and Child Restraints); Pedestrian and Bicycle Safety; Traffic Records; Emergency Medical Services;
Aggressive Driving; Motorcycle Safety; Teen Drivers]. In addition to these priority program areas,
Distracted Driving has become a major concern nationwide. These program areas were determined by
NHTSA to be most effective in eliminating motor vehicle crashes, injuries, and deaths. Consideration for
other potential traffic safety problem areas came from analysis of the Idaho crash data and coordination
with the Idaho SHSP. The SHSP is a statewide coordinated plan that provides a comprehensive framework
for eliminating highway fatalities and serious injuries on all public roads.
Comparison data was developed, where possible, on costs of crashes, the number of crashes, and the
number of deaths and injuries. Crash data, from the Idaho State Collision Database, was analyzed to
determine problem areas as well as helmet use for motorcycles and bicycles, child safety restraint use, and
seatbelt use. Population data from the Census Bureau, Violation and License Suspension data from the
Economics and Research Section, Idaho Transportation Department and arrest information from the
Bureau of Criminal Identification, and the Idaho State Police (ISP) was also used in the problem
identification.
The focus areas were selected on the basis of the severity of the problem, economic costs, and availability
of grantee agencies to conduct successful programs, and other supportable conclusions drawn from the
traffic safety problem identification process.
Each October, the problem identification analysis is presented to the ITSC to identify the recommended
focus areas. The ITSC votes to accept the Idaho focus areas anticipated to be programmed for the next
year.
7Project Selection and Development
The annual project selection process begins by notifying state and local public agencies involved in traffic
related activities of the availability of grant funds. A Grant Application notice, reflecting the focus areas
considered for funding, is released in January. The Grant Application notice invites applicants to submit
grant applications by the end of February.
Analysis of the crash data for all counties and cities with a population of 2,000 people or greater is used to
solicit agencies for grants, evaluate grant applications, and solicit participation in the mobilizations. This
analysis is done for each focus area and includes the number of fatal and injury crashes over the last three
years and the 3year fatal and injury crash rate per 100,000 population. Fatal and serious injury crashes are
also used if the number of crashes is large enough to provide guidance of areas that may have a more
severe crash problem.
Once the application period has closed, potential projects are sorted according to the focus area that most
closely fits the project. OHS evaluates each project’s potential to eliminate death and injury from motor
vehicle crashes. For a new application (i.e., those which are not continuation grants from prior years), the
applications are reviewed and scored based on the relevance of the application narrative/funding request
and the overall merit of the project (i.e., whether the project implementation is part of SHSP strategies an
effective countermeasure and whether the problem presented is data driven or supported by research or
other relevant documentation). Funding decisions are based on agency need, supporting planned activity,
performance evaluation and budget. Project applications that fail to meet the selection criteria will not be
recommended for the HSP.
In Idaho, the project selection process for NHTSA funded grants is guided by data analysis supporting the
effective countermeasures for specific emphasis areas. In the case of a few established proven effective
countermeasures, innovative countermeasures are utilized on those areas that demonstrate evidence of
potential success. Sources that guide Idaho’s HSP project selection include:
• Countermeasures That Work (CTW) A Highway Safety Countermeasure Guide for State Highway
Safety Offices – USDOT
• Written plan/reports such as the SHSP, Impaired Driving Advisory Committee (IDAC), Seat Belt
Committee and Traffic Records published document, emphasis areas or program specific
assessment reports
• Uniform Guidelines for State Highway Safety Programs (USDOT)
• Highway Safety related research recommendations from trusted sources such as the
Transportation Research Board, and the NCHRP Report 500 series.
• Funding recommendations for the individual projects are incorporated into the HSP and are
presented to the ITSC in the spring meeting, for acceptance. The HSP is then presented to the Idaho
Transportation Board for approval and sent to NHTSA for final approval. A flow chart depicting the
entire process is contained on page nine.
• Strategic Highway Safety Plan Besides seeking guidance and approval from ITSC, OHS coordinates
SHSP team meetings for guidance in implementing programs funded with NHTSA funds, Section
402 and 405 funds.
• Grant Applicant prior performance evaluation
8Linking with the Strategic Highway Safety Plan
As required by FAST ACT, the states must submit a HSP with programs that are supported by data driven
strategies. Idaho has adopted this concept through the implementation of its “Toward Zero Deaths” vision
within Idaho’s safety community. Through the SHSP Idaho’s safety community uses the pillars of safety,
which are:
• Data Driven Decisions: To make effective and efficient use of limited resources, invest in safety
programs based on need as demonstrated by data. Return on this investment is maximized by
thoroughly studying crash data and other pertinent data, including industry best practices.
• Culture Change: Safety advocates work toward a change in mindset, countering the belief that
traffic deaths are just part of life, promoting that every life counts, and that it is no longer
acceptable to make poor and irresponsible choices when behind the wheel in Idaho.
• Commitment: Idaho stays the course, leaving no stone unturned in the effort to save lives and keep
families whole.
• Partnerships: Partnerships multiply the message and commitment. The SHSP draws on the
strengths and resources of many safety partners and advocates.
• Evaluation: The process of reviewing, measuring and evaluating progress allows Idaho to see
where change is possible for improvement in the future and to assure that proper investments are
made.
To support the overall safety target, the SHSP is a fundamental guiding document that along with the HSP,
link the program area problem identification data, performance targets, identified countermeasure
strategies and allocation of funds to planned activities The SHSP and participants integrate the four E’s
(engineering, education, enforcement, and emergency response) to meet Idaho’s target in eliminating
highway fatalities and serious injuries on all public roads. The collaborative process of developing and
implementing the SHSP brings together and draws on the strengths and resources of Idaho’s safety
partners. This process also helps coordinate targets and highway safety programs across the state.
The SHSP is comprised of three Emphasis Areas and associated with eleven Focus Areas.
High Risk Behavior Severe Crash Types Vulnerable Roadway
Emphasis Area Emphasis Area User Emphasis Area
Aggressive Driving Commercial Motor Bicycle & Pedestrian
Distracted Driving Vehicles Mature Drivers
Impaired Driving Intersections Motorcycle
Occupant Protection Lane Departure Young Drivers
9Timeline: Annual Highway Safety Planning Calendar
MONTH ACTIVITIES
SEPTEMBER Traffic safety problem identification
OCTOBER OHS planning sessions and ITSC planning meeting and action
DECEMBER Grant application notice is disseminated
FEBRUARY Grant application period ends
MARCH Draft Highway Safety Plan to be completed in April, Clarify project proposals
APRIL Prioritize and develop draft language for the HSP
ITSC acceptance of Highway Safety Plan
MAY Initial presentation and submission of Highway Safety Plan to ITD Board
JUNE ITD Board approval
JULY July 1: Submission of HSP to NHTSA
OCTOBER Implementation of projects
Evidence-Based Traffic Safety Enforcement Program
Idaho state and local law enforcement (LE) agencies are the greatest advocates for highway safety. Our LE
partners are instrumental in helping Idaho achieve our targets. Traffic enforcement mobilizations are a
format for the Idaho OHS to fund HVE’s during specified emphasis periods, special events, or corridor
enforcement in support of the OHS HSP focus areas.
Executing an effective HVE requires enforcement efforts targeted to the appropriate behavioral areas and
locations coupled with meaningful media and public education outreach. The OHS’s evidence based traffic
safety enforcement program outlines a three step strategy to ensure effectiveness: Data Analysis,
Resource Allocation, and Project Oversight. The strategy starts with an annual analysis of serious injury
and fatality data to identify problems and ultimately allocate funding to projects through the annual grants
process. This in depth analysis produces the HSP and Performance Report, which in turn drives the
allocation of resources to the areas of greatest need. Following analysis and resource allocation, the
ITDOHS staff works closely with law enforcement agencies to ensure enforcement efforts are carried out
successfully. These efforts, or the statewide traffic enforcement mobilizations, support the national
mobilization efforts.
Idaho’s Law Enforcement Liaison’s (LEL), which are represented by six officers, one from each of the six
Idaho Transportation Districts have provided leadership for the evidence based traffic safety mobilization
enforcement statewide. The primary objective of the LEL program is to increase participation and
effectiveness of Idaho’s law enforcement agencies and officers in statewide mobilizations, serving also as
oversight and purveyors of HVE best practices. The result is an evidence based traffic safety HVE project
designed to address the areas and locations at highest risk and with the greatest potential for
improvement. Data analysis is constantly updated and evaluated providing for continuous and timely
revisions to enforcement deployment and resource allocation.
10Urban roadways are defined as those within city limits of cities with 5,000 people or more. Urban roadways
tend to carry higher volumes of traffic at lower speeds, while rural roads carry lower traffic volumes at higher
speeds.
In 2019, 74% of fatal crashes occurred on rural roads, whereas 32% of all crashes occurred on rural roads. In
Idaho in 2018, 89% of the total road mileage was classified as rural roadway. Rural roads tend to have higher
speed limits. Crashes at higher impact speeds have a greater probability of resulting in a fatality.
1112
High Visibility Enforcement (HVE)/ Traffic Safety Mobilizations
The target of each mobilization is to establish project requirements with law enforcement agencies to align
with the SHSP and to eliminate deaths, serious injuries and economic loss. Agencies taking part in the
mobilizations enter into an agreement with the OHS to perform dedicated patrol for traffic enforcement
during the time and dates established. For the impaired driving mobilizations, the OHS encourages
participants to conduct enforcement during time frames that are data driven; often during nighttime
hours. Funding for the campaigns are allocated to agencies that meet the criteria based on traffic crash
data and agency past performance.
As part of the agreement, the law enforcement agencies publicize the enforcement effort with local media
contacts to increase the awareness of enforcement and provide results before, during, and after
mobilizations. Enforcement efforts are coupled with paid and earned media and public education outreach
designed to inform the public of the increased enforcement. Idaho closely mirrors the NHTSA timeline
model for media. The OHS works closely with their media experts to reach out to the demographics
established through data. Outreach efforts include the use of public service announcements (TV, radio,
outdoor, and internet marketing), social media, variable message boards, and earned media events.
Upon completion of each mobilization each participating agency is responsible for reporting their
performance. During the seat belt mobilization, pre and post surveys are conducted. Additionally a
performance report is submitted. The performance is monitored by the Program Managers to assist with
making any adjustments to countermeasures or planned activities.
Although formal seat belt use surveys are performed annually through the OHS, the recipient of highway
safety funds for a seat belt mobilization is required to gauge performance by conducting a pre and post
seat belt survey. The OHS Program Managers can use this information as an indicator in evaluating and
monitoring performance. The OHS conducts the following targeted HVE/Mobilizations:
• Impaired Driving Mobilizations: December January (to coincide with NHTSA Impaired Driving
campaign), June-July (to coincide with July 4th), and August – September (to coincide with NHTSA
Impaired Driving campaign, Labor Day weekend).
• Aggressive Driving: During the summer, traffic crash fatalities frequency is overrepresented. The
Aggressive Driving mobilization focusing on speed is conducted during the summer months.
• Seat Belt Mobilizations: May-Click It Don’t Risk It (to coincide with NHTSA national campaign).
• Distracted Driving: April-phone in hand/ ticket in the other, to coincide with National Distracted
Driving month in April.
13FFY 2022 HVE Mobilization Schedule
Impaired Driving - Holidays Dec. 17, 2021 – Jan. 1, 2022
Distracted Driving - April Apr. 19 – 29, 2022
Seatbelts - May May 16 – June 3, 2022
Impaired Driving - 4th of July July 1-9, 2022
Aggressive Driving - Summer July 18 – 31, 2022
Impaired Driving - Labor Day Aug. 19 – Sept. 5, 2022
Law Enforcement / Adjudication Process
To complete evidence based traffic enforcement, Idaho is growing increasingly stronger in its adjudication
process. There is a strong data driven partnership between the judiciary and law enforcement:
prosecutors, Idaho Supreme Court, Administrative Licensing Suspension (ITD), Alcohol Beverage Control,
Idaho State Police and local law enforcement statewide.
Idaho’s Traffic Safety Resource Prosecutor (TSRP) has served as a liaison between prosecutors, judiciary,
law enforcement, and other stakeholders in the fight against impaired driving. Prior to the start of this
program, the communication between law enforcement and prosecutors was in need of stronger
relationships and communication. The TSRP provides training and technical assistance to law enforcement
officers and prosecutors, delivering critical support to enhance successful prosecution of traffic safety
violations.
14STRATEGIC PARTNERS and STAKEHOLDERS
Idaho Traffic Safety Commission
The ITSC is an advisory board that reviews traffic safety issues, promotes local and state cooperation,
recommends programs for federal aid and supports crash prevention. The commission consists of fifteen
members from state and local law enforcement, Emergency Management Services and user groups. By
statute, the chairs of the Idaho Senate Transportation Committee and the House Transportation and
Defense Committee are on the ITSC. The ITSC has input throughout the development process of our
Highway Safety Plan. The OHS maintains contact primarily through meetings, regular email and our
Highway Safety Quick Notes.
The following members represent the ITSC:
Idaho Transportation Department Education
• L. Scott Stokes, Chief Deputy • Sunshine Beer, Idaho STAR (Skills Training
• John Tomlinson, Highway Safety Manager Advantage for Riders)
• Emily Kormylo, Driver Education Coordinator,
Law Enforcement Idaho State Department of Education
• Lt. Colonel Sheldon Kelley, Idaho State Police
• Chief Jeff Wilson, Orofino Police Department City Government
• Sheriff Craig T. Rowland, Bingham County • Brian Blad, Pocatello Mayor
Prosecutor/Legal Idaho Senate & House
• Louis Marshall, Bonner County Prosecutor • Senator Lori Den Hartog, Idaho Senate
Representative
Medical Services • Representative Joe Palmer, Idaho House
• Stacey Carson, VP Operations, Idaho Hospital Representative
Association
15PERFORMANCE PLAN
Performance Measures: Targets and Actual Values
The following table presents the targets and actual values for each performance measure in a simple, one-page format.
162022 Performance Plan
Target Start Target Target
Performance Measure Name Period Target end Year Value
Year
5 Year 2018 2022 245
C-1) Number of traffic fatalities
C-2) Number of serious injuries in traffic crashes 5 Year 2018 2022 1283
(State crash data files)
5 Year 2018 2022 1.36
C-3) Fatality Rate, VMT
C-4) Number of unrestrained passenger vehicle 5 Year 2018 2022 105
occupant fatalities, all seat position (FARS)
C-5) Number of fatalities in crashes involving a driver 5 Year 2018 2022 73
or motorcycle operator with a BAC of .08 and above
5 Year 2018 2022 63
C-6) Number of speeding-related fatalities
5 Year 2018 2022 29
C-7) Number of motorcyclist fatalities
5 Year 2018 2022 16
C-8) Number of unhelmeted motorcyclist fatalities
C-9) Number of driver age 20 or younger involved in 5 Year 2018 2022 31
fatal crashes
5 Year 2018 2022 14
C-10) Number of pedestrian fatalities
5 Year 2018 2022 3
C-11) Number of bicyclist fatalities
B-1) Observed seat belt use for passenger vehicles, 5 Year 2018 2022 83.0
front seat outboard occupants (survey)
5 Year 2018 2022 54
I-1) Distracted Driving fatalities
5 Year 2018 2022 48
I-2) Drivers age 65 or older involved in fatal crashes
5 Year 2018 2022 38
I-3) Reduce CMV fatalities
5 Year 2018 2022 114
I-4) Number of single vehicle run off road fatalities
I-5) Number of Head-on-side-Swipe-Opposite 5 Year 2018 2022 42
direction fatalities
5 Year 2018 2022 46
I-6) Number of intersection-related fatalities
17Performance Report
Progress towards meeting State performance targets from the previous fiscal year’s HSP.
Performance Measure Name Progress
Not Met
C-1) Number of traffic fatalities
Not Met
C-2) Number of serious injuries in traffic crashes (State crash data files)
Not Met
C-3) Fatality Rate, VMT
Not Met
C-4) Number of unrestrained passenger vehicle occupant fatalities, all seat position
(FARS)
C-5) Number of fatalities in crashes involving a driver or motorcycle operator with a Not Met
BAC of .08 and above
Met
C-6) Number of speeding-related fatalities
Not Met
C-7) Number of motorcyclist fatalities
Not Met
C-8) Number of unhelmeted motorcyclist fatalities
Not Met
C-9) Number of driver age 20 or younger involved in fatal crashes
Not Met
C-10) Number of pedestrian fatalities
Not Met
C-11) Number of bicyclist fatalities
Met
B-1) Observed seat belt use for passenger vehicles, front seat outboard occupants
(survey)
Not Met
I-1) Distracted Driving fatalities
Not Met
I-2) Drivers age 65 or older involved in fatal crashes
Not Met
I-3) Reduce CMV fatalities
Not Met
I-4) Number of single vehicle run off road fatalities
Not Met
I-5) Number of Head-on-side-Swipe-Opposite direction fatalities
Not Met
I-6) Number of intersection-related fatalities
18C1 – 5-Year Average Number of Fatalities
Progress: Not Met
The target in the FFY 2019 HSP for the number of fatalities was 187 (2015-2019 5-year average),
while the actual 5-year average number of fatalities was 234. Because of considerable variability in
the number of fatalities over the past 10 years, the targets have been completely reevaluated and
revised for the FFY 2022 plan. Most trend lines are indicating an increasing trend and the targets
have been set to be lower than the increasing trend. The target for the 5-year average number of
fatalities for 2016-2020 is 249.
C2 – 5-Year Average Number of Serious Injuries
Progress: Not Met
The target in the FFY 2019 HSP for the number of serious injuries was 1,230 (2015-2019 5-year
average), while the actual 5-year average number of serious injuries was 1,267. Because of
considerable variability in the number of serious injuries over the past 10 years, the targets have
been completely reevaluated and revised for the FFY 2022 plan. Most trend lines are indicating an
increasing trend and the targets have been set to be lower than the increasing trend. The target
for the 5-year average number of serious injuries for 2016-2020 is 1,287.
C3 – 5-Year Fatality Rate per 100 million Annual Vehicle Miles Traveled (AVMT)
Progress: Not Met
The target in the FFY 2019 HSP for the 5-year fatality rate was 1.12 (2015-2019), while the actual 5-
year fatality rate was 1.35. Because of considerable variability in the number of fatalities over the
past 10 years, the targets have been completely reevaluated and revised for the FFY 2022 plan.
Most trend lines are indicating an increasing trend and the targets have been set to be lower than
the increasing trend. The target for the 5-year fatality rate for 2016-2020 is 1.41.
C4 – 5-Year Average Number of Unrestrained Passenger Motor Vehicle Occupants Killed
Progress: Not Met
The target in the FFY 2019 HSP for the number of unrestrained passenger motor vehicle occupants
killed was 70 (2015-2019 5-year average), while the actual 5-year average number of unrestrained
passenger motor vehicle occupants killed was 93. Because of considerable variability in the
number of fatalities over the past 10 years, the targets have been completely reevaluated and
revised for the FFY 2022 plan. Most trend lines are indicating an increasing trend and the targets
have been set to be lower than the increasing trend. The target for the 5-year average number of
unrestrained passenger motor vehicle occupants killed for 2016-2020 is 106.
C5 – 5-Year Average Number of Fatalities Involving a Driver with a BAC greater than or equal to
0.08
Progress: Not Met
The target in the FFY 2019 HSP for the number of fatalities involving a driver with a BAC greater
than or equal to 0.08 was 52 (2015-2019 5-year average), while the actual 5-year average number
of fatalities involving a driver with a BAC greater than or equal to 0.08 was 67. Because of
considerable variability in the number of fatalities over the past 10 years, the targets have been
19completely reevaluated and revised for the FFY 2022 plan. Most trend lines are indicating an
increasing trend and the targets have been set to be lower than the increasing trend. The target
for the 5-year average number of fatalities involving a driver with a BAC greater than or equal to
0.08 for 2016-2020 is 72.
C6 – 5-Year Average Number of Fatalities Resulting from Crashes Involving Speeding
Progress: Met
The target in the FFY 2019 HSP for the number of fatalities resulting from crashes involving
speeding was 50 (2015-2019 5-year average), while the actual 5-year average number of fatalities
resulting from crashes involving speeding was 49. Because of considerable variability in the
number of fatalities over the past 10 years, the targets have been completely reevaluated and
revised for the FFY 2022 plan. Most trend lines are indicating an increasing trend. The target for
the 5-year average number of fatalities resulting from crashes involving speeding for 2016-2020 is
59.
C7 – 5-Year Average Number of Motorcyclists Killed
Progress: Not Met
The target in the FFY 2019 HSP for the number of motorcyclists killed was 21 (2015-2019 5-year
average), while the actual 5-year average number of motorcyclists killed was 28. Because of
considerable variability in the number of fatalities over the past 10 years, the targets have been
completely reevaluated and revised for the FFY 2022 plan. Most trend lines are indicating an
increasing trend. The target for the 5-year average number of motorcyclists killed for 2016-2020 is
29.
C8 – 5-Year Average Number of Motorcyclists Killed Not Wearing Helmets
Progress: Not Met
The target in the FFY 2019 HSP for the number of motorcyclists that were not wearing helmets
killed was 11 (2015-2019 5-year average), while the actual 5-year average number of motorcyclists
killed that were not wearing helmets was 16. Because of considerable variability in the number of
fatalities over the past 10 years, the targets have been completely reevaluated and revised for the
FFY 2022 plan. Most trend lines are indicating an increasing trend and the targets have been set to
be lower than the increasing trend. The target for the 5-year average number of motorcyclists
killed that were not wearing helmets for 2016-2020 is 17.
C9 – 5-Year Average Number of Drivers, 20 Years Old and Younger, Involved in Fatal Crashes
Progress: Not Met
The target in the FFY 2019 HSP for the number of drivers, 20 years old and younger, involved in
fatal crashes was 25 (2015-2019 5-year average), while the actual 5-year average number of
drivers, 20 years old and younger, involved in fatal crashes was 34. Because of considerable
variability in the number of fatalities over the past 10 years, the targets have been completely
reevaluated and revised for the FFY 2022 plan. Most trend lines are indicating an increasing trend
and the targets have been set to be lower than the increasing trend. The target for the 5-year
average number of drivers, 20 years old and younger, involved in fatal crashes for 2016-2020 is 32.
C10 – 5-Year Average Number of Pedestrian Fatalities
Progress: Not Met
20The target in the FFY 2019 HSP for the number of pedestrians killed by motor vehicles was 11
(2015-2019 5-year average), while the actual 5-year average number of pedestrians killed by motor
vehicles was 14. The target for the 5-year average number of pedestrians killed by motor vehicles
for 2016-2020 is 15.
C11 – 5-Year Average Number of Bicyclist Fatalities
Progress: Not Met
The target in the FFY 2019 HSP for the number of bicyclists killed by motor vehicles was 2 (2015-
2019 5-year average), while the actual 5-year average number of bicyclists killed by motor vehicles
was 3. The target for the 5-year average number of bicyclists killed by motor vehicles for 2016-
2020 is 3.
B1 – Yearly Observed Seat Belt Use Rate
Progress: Met
The target in the FFY 2019 HSP for the yearly observed seat belt use rate was 83.3%, while the
actual yearly observed seat belt use rate was 85.7%. The target for the yearly observed seat belt
use rate for 2022 is 82.4%.
I1 – 5-Year Average Number of Fatalities Resulting from Distracted Driving
Progress: Not Met
The target in the FFY 2019 HSP for the number of fatalities resulting from distracted driving was 39
(2015-2019 5-year average), while the actual 5-year average number of fatalities resulting from
distracted driving was 48. Because of considerable variability in the number of fatalities over the
past 10 years, the targets have been completely reevaluated and revised for the FFY 2022 plan.
Most trend lines are indicating an increasing trend. The target for the 5-year average number of
resulting from distracted driving for 2016-2020 is 53.
I2 – 5-Year Average Number of Fatal Crashes Resulting from Drivers >=65
Progress: Not Met
The target in the FFY 2019 HSP for the number of fatal crashes resulting from drivers equal to or
older than 65 years of age was 34 (2015-2019 5-year average), while the actual 5-year average
number of fatalities resulting from drivers equal to or older than 65 years old was 52. Because of
considerable variability in the number of fatalities over the past 10 years, the targets have been
completely reevaluated and revised for the FFY 2022 plan. Most trend lines are indicating an
increasing trend. The target for the 5-year average number of resulting from distracted driving for
2016-2020 is 52.
I3 – 5-Year Average Number of Fatalities Resulting from Commercial Vehicle Crashes
Progress: Not Met
The target in the FFY 2019 HSP for the number of fatalities resulting from commercial motor
vehicle crashes was 20 (2015-2019 5-year average), while the actual 5-year average number of
fatalities resulting from commercial motor vehicle crashes was 40. Because of considerable
variability in the number of fatalities over the past 10 years, the targets have been completely
reevaluated and revised for the FFY 2022 plan. Most trend lines are indicating an increasing. The
target for the 5-year average number of resulting from commercial motor vehicle crashes for 2016-
2020 is 39.
21I4 – 5-Year Average Number of Fatalities Resulting from Single-Vehicle Run Off the Road Crashes
Progress: Not Met
The target in the FFY 2019 HSP for the number of fatalities resulting from single-vehicle run off the
road crashes was 95 (2015-2019 5-year average), while the actual 5-year average number of
fatalities resulting from single-vehicle run off the road crashes was 105. Because of considerable
variability in the number of fatalities over the past 10 years, the targets have been completely
reevaluated and revised for the FFY 2022 plan. The target for the 5-year average number of
resulting from single-vehicle run off the road crashes for 2016-2020 is 116.
I5 – 5-Year Average Number of Fatalities Resulting from Head-On or Sideswiped Opposite
Direction Crashes
Progress: Not Met
The target in the FFY 2019 HSP for the number of fatalities resulting from head-on or sideswiped
opposite direction crashes was 24 (2015-2019 5-year average), while the actual 5-year average
number of fatalities resulting from head-on or sideswiped opposite direction crashes was 40.
Because of considerable variability in the number of fatalities over the past 10 years, the targets
have been completely reevaluated and revised for the FFY 2022 plan. Most trend lines are
indicating an increasing trend. The target for the 5-year average number of resulting from head-on
or sideswiped opposite direction crashes for 2016-2020 is 42.
I6 – 5-Year Average Number of Fatalities Resulting from Intersection Related Crashes
Progress: Not Met
The target in the FFY 2019 HSP for the number of fatalities resulting from intersection-related
crashes was 33 (2015-2019 5-year average), while the actual 5-year average number of fatalities
resulting from intersection-related crashes was 47. Because of considerable variability in the
number of fatalities over the past 10 years, the targets have been completely reevaluated and
revised for the FFY 2022 plan. Most trend lines are indicating an increasing trend. The target for
the 5-year average number of resulting from intersection-related crashes for 2016-2020 is 47.
Targets for the FFY 2019 Highway Safety Plans were set in 2016 when the most recent available
data was from 2015. This was at a time that fatalities were significantly decreasing due to the
economic downturn. Since that time, the economy has improved and fatalities have increased
resulting in most of the targets not being met. Targets for the FY2020 through FY2022 plan were
set in 2018 when the most recent data available was from 2017.
22IDENTIFICATION REPORT
State Demographics
Idaho is geographically located in the Pacific Northwest. Idaho is the 11th largest State the nation
in land area, but the 38th largest in population. Idaho consists of 82,750.9 square miles of land and
is comprised of 44 Counties ranging in size from 407.5 square miles (Payette County) to 8,485.2
square miles (Idaho County). Two counties, Idaho County (8,485.2 square miles) and Owyhee
County (7,678.4 square miles) encompass 19.5% of the State, although they only represent just 1.7
percent of the statewide population. Just over 63% of Idaho is federally owned land, primarily
consisting of national forests, wilderness areas, and BLM land.
The United States Census Bureau estimates the population of Idaho in 2019 was 1,790,777. Idaho
is a rural State, nearly two-thirds (65%) of the population resides in just 6 of the 44 counties: Ada
(434,211), Canyon (207,478), Kootenai (150,346), Bonneville (110,089), Bannock (83,744), and
Twin Falls (82,375).
23Idaho
Problem
Identification
Report
FY 2022
Prepared by the Office of Highway Safety
24Statewide
The Problem
• In 2019, 224 people were killed and 13,331 people were injured in traffic crashes.
• The fatality rate was 1.24 fatalities per 100 million Annual Vehicle Miles of Travel (AVMT) in Idaho in
2019. The US fatality rate was estimated to be 1.10 fatalities per 100 million AVMT in 2019.
• Motor vehicle crashes cost Idahoans over $4.1 billion in 2019. Fatal and serious injuries represented
69 percent of these costs.
Idaho Crash Data and Measures of Exposure, 20152019
Economic Costs* of Idaho Crashes, 2019
25Statewide – (Continued)
Fatal and Injury Crash Involvement by Age of Driver, 2019
Location of Idaho Crashes, 2015-2019
26Aggressive Driving
The Definition
• Aggressive driving behaviors include: Failure to Yield Right of Way, Driving Too Fast for Conditions,
Exceeding the Posted Speed, Passed Stop Sign, Disregarded Signal, and Following Too Close.
• Aggressive driving crashes are those where an officer indicates that at least one aggressive driving
behavior contributed to the collision. Up to three contributing circumstances are possible for each
vehicle in a collision, thus the total number of crashes attributed to these behaviors is less than the
sum of the individual components.
The Problem
• Aggressive driving was a factor in 50 percent of all crashes and 29 percent of all fatalities in 2019.
• Drivers, ages 19 and younger, were 4.0 times as likely to be involved in an aggressive driving collision
as all other drivers in 2019.
• Aggressive driving crashes cost Idahoans nearly $1.7 billion in 2019. This represented 40 percent of
the total economic cost of crashes.
Aggressive Driving in Idaho, 20152019
27Distracted Driving
The Definition
• Distracted driving crashes are those where an officer indicates that Inattention or Distracted – in/on
Vehicle was a contributing circumstance in the crash.
The Problem
• In 2019, 36 fatalities resulted from distracted driving crashes. This represents 19 percent of all
fatalities. Of the 31 passenger vehicle occupants killed in distracted driving crashes, 15 (48 percent)
were wearing a seat belt. The other fatalities resulting from distracted driving in 2019 were 1
motorcyclist, 2 pedestrians, 1 bicycle rider, and an ATV rider.
• In 2019, drivers under the age of 25 comprised 35 percent of the drivers involved in all distracted
driving crashes and 31 percent of the drivers involved in fatal distracted driving crashes, while they
only comprised 14 percent of the licensed drivers.
• Distracted driving crashes cost Idahoans nearly $787 million in 2019. This represents 19 percent of
the total economic cost of crashes.
Distracted Driving Crashes in Idaho, 20152019
28You can also read