Identifying intracity freight trip ends from heavy truck GPS trajectories
←
→
Page content transcription
If your browser does not render page correctly, please read the page content below
Identifying intracity freight trip ends from heavy
                                                         truck GPS trajectories
                                                                                            Yitao Yang
                                           Key Laboratory of Integrated Transport Big Data Application Technology for Transport Industry, Beijing Jiaotong
                                                                      University, Beijing 100044, China, yitao-yang@bjtu.edu.cn

                                                                                              Bin Jia*
                                          Key Laboratory of Integrated Transport Big Data Application Technology for Transport Industry, Beijing Jiaotong
arXiv:2106.09881v2 [cs.OH] 21 Jun 2021

                                         University, Beijing 100044, China. School of Economics and Management, Xi’an Technological University, Xi’an 710021,
                                                                                         China, bjia@bjtu.edu.cn

                                                                                         Xiao-Yong Yan†
                                           Key Laboratory of Integrated Transport Big Data Application Technology for Transport Industry, Beijing Jiaotong
                                                                        University, Beijing 100044, China, yanxy@bjtu.edu.cn

                                                                                             Rui Jiang
                                           Key Laboratory of Integrated Transport Big Data Application Technology for Transport Industry, Beijing Jiaotong
                                                                       University, Beijing 100044, China, jiangrui@bjtu.edu.cn

                                                                                               Hao Ji
                                          School of Economics and Management, Xi’an Technological University, Xi’an 710021, China, wwwjihao 78@126.com

                                                                                            Ziyou Gao
                                           Key Laboratory of Integrated Transport Big Data Application Technology for Transport Industry, Beijing Jiaotong
                                                                        University, Beijing 100044, China, zygao@bjtu.edu.cn

                                          Intracity heavy truck freight trips are basic data in city freight system planning and management. In the
                                          big data era, massive heavy truck GPS trajectories can be acquired cost effectively in real-time. Identifying
                                          freight trip ends (origins and destinations) from heavy truck GPS trajectories is an outstanding problem.
                                          Although previous studies proposed a variety of trip end identification methods from different perspectives,
                                          these studies subjectively defined key threshold parameters and ignored the complex intracity heavy truck
                                          travel characteristics. Here, we propose a data-driven trip end identification method in which the speed
                                          threshold for identifying truck stops and the multilevel time thresholds for distinguishing temporary stops
                                          and freight trip ends are objectively defined. Moreover, an appropriate time threshold level is dynamically
                                          selected by considering the intracity activity patterns of heavy trucks. Furthermore, we use urban road
                                          networks and point-of-interest (POI) data to eliminate misidentified trip ends to improve method accuracy.
                                          The validation results show that the accuracy of the method we propose is 87.45%. Our method incorporates
                                          the impact of the city freight context on truck trajectory characteristics, and its results can reflect the spatial
                                          distribution and chain patterns of intracity heavy truck freight trips, which have a wide range of practical
                                          applications.

                                          Key words : intracity freight trip ends, heavy truck, GPS data, data-driven method, travel characteristics

                                                                                                1 of 30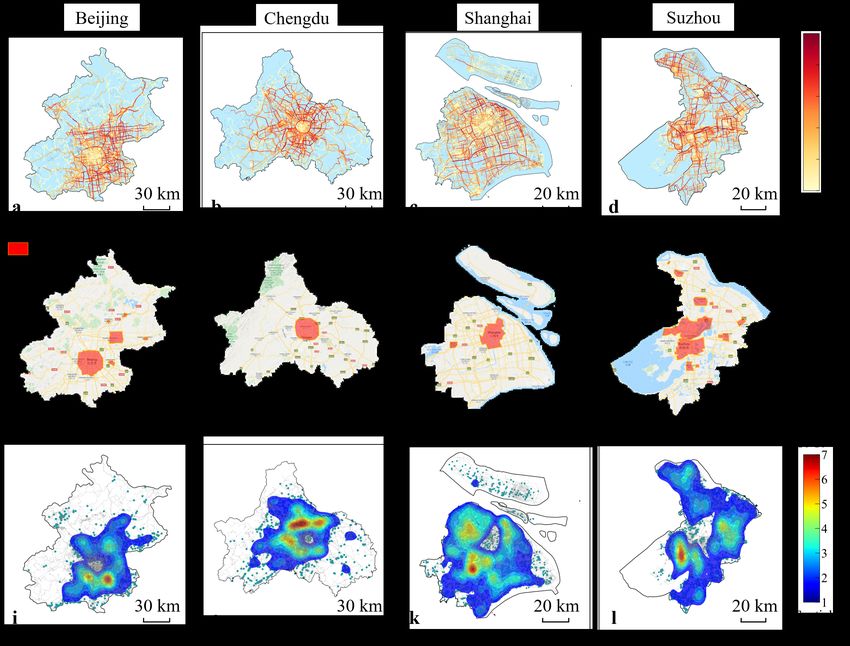
1.      Introduction
The city is the center of socioeconomic development, natural resource consumption and
commodity production (Acuto et al., 2018). Modern cities are supported by freight trans-
port systems, which guarantee the supply of household goods, industrial raw materials and
construction materials (Behrends, 2016). In intracity freight, heavy trucks mainly under-
take mass transportation tasks between industrial enterprises, logistics warehouses and
port terminals (Dernir et al., 2014). Although heavy trucks account for less than 40% of
intracity freight vehicles, they carry more than 80% of the freight volume (Aljohani, 2016).
In the future, rapid urbanization will further stimulate the growth of intracity freight
demand (Balk et al., 2018). Heavy trucks will play a more important role in the intracity
freight system. However, the increase in the number of heavy trucks will create serious
social and environmental problems, such as traffic accidents, air pollution and nonrenew-
able energy consumption (Hu et al., 2019; Sakai et al., 2019; Velickovic et al., 2018). In
particular, the proportion of the total mileage of heavy trucks in city road traffic is less
than 6%, but heavy trucks contribute 36% of air pollution (Perez-Martinez et al., 2017)
and 18% of traffic death accidents (Evgenikos et al., 2016; Knight and Newton, 2008).
In recent years, authorities and organizations have developed many freight-related poli-
cies, such as truck road pricing (Wang and Zhang, 2017), freight bottleneck management
(Sharma et al., 2020) and freight demand management (Hassan et al., 2020), to eliminate
the negative effects of heavy trucks. Intracity heavy truck freight trips are critical basic
data for developing these freight policies. However, a major challenge at present is the lack
of massive heavy truck freight trip data, which greatly hinders our in-depth understanding
of city freight systems (Allen et al., 2012; Hadavi et al., 2019; Pluvinet et al., 2012; Zhang
et al., 2019).
     Traditionally, intracity freight trip data are collected through travel surveys conducted
in many cities, such as London (Allen et al., 2018), Tokyo (Oka et al., 2019), Paris (Toilier
et al., 2016), Toronto (McCabe et al., 2013) and Melbourne (Greaves and Figliozzi, 2008).
Travel surveys provide relatively rich travel information on heavy trucks but are time
consuming and costly (Allen et al., 2012; Oka et al., 2019; Pani and Sahu, 2019). There-
fore, the quantity of intracity freight travel data collected through freight surveys is often
∗
    Corresponding author
†
    Corresponding author

                                             2 of 30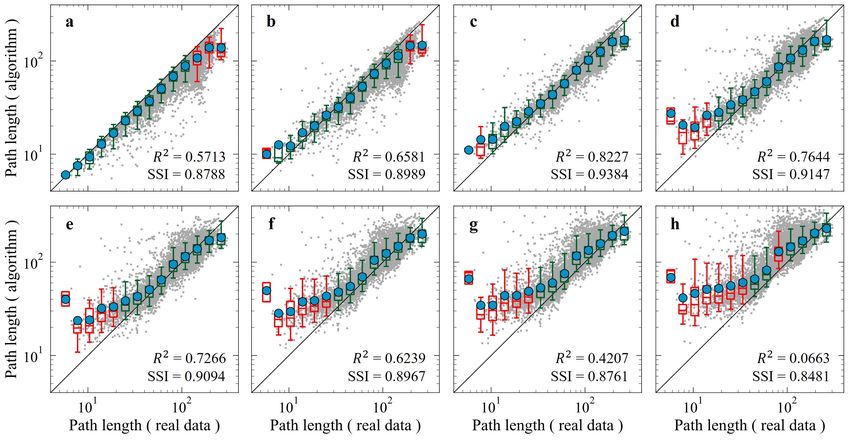
limited and not sufficient for the analysis and modeling of city freight systems (Allen et
al., 2014). In the era of big data, the development and application of satellite positioning
technology make it possible to obtain massive heavy truck GPS trajectories through GPS
devices (Deng et al., 2010; Papadopoulos et al., 2021; Pluvinet et al., 2012). It is critical
to accurately extract heavy truck freight trips from GPS trajectories (Kamali et al., 2016;
Zanjani et al., 2015).
  To extract freight trips from GPS trajectories, most previous studies (Arentze et al.,
2012; Feng et al., 2012; Gingerich et al., 2016; Huang et al., 2014; Kamali et al., 2016;
Laranjeiro et al., 2019; Zanjani et al., 2015) first identified heavy truck freight trip ends
(origins and destinations, OD) and then split the GPS trajectory into multiple trips accord-
ing to the identified trip ends. The process of trip end identification can be divided into
two steps: (1) identify truck stops from the GPS trajectory and (2) select freight trip ends
from these identified truck stops. For the first step, previous studies (Comendador et al.,
2012; Greaves and Figliozzi, 2008; Joubert and Axhausen, 2011; Yang et al., 2014) often
used trajectory features, such as velocity, acceleration and truck direction, to infer heavy
truck motion states (stationary or moving) at a given time period and then identified truck
stops from GPS trajectories. These identified truck stops include not only freight trip ends
but also temporary stops due to refueling, traffic congestion, etc. Thus, in the second step,
freight trip ends need to be selected from all truck stops. Some researchers (Gingerich et
al., 2016; Hughes et al., 2019; Zanjani et al., 2015) found that the temporary stopping
time for heavy trucks is usually short (mostly a few minutes), while loading or unloading
usually takes dozens of minutes or even hours. Therefore, one or more stop time thresholds
can be set to distinguish freight trip ends and temporary stops.
  Previous studies (Arentze et al., 2012; Feng et al., 2012; Gingerich et al., 2016; Huang et
al., 2014; Laranjeiro et al., 2019) determined the time threshold for identifying freight trip
ends from different perspectives. For example, some studies (Ma et al., 2011; McCormack
et al., 2006; McCormack et al., 2010) took the traffic signal cycle as the time threshold to
distinguish trip ends and temporary stops due to traffic control. (Kamali et al., 2016) and
(Aziz et al., 2016) determined the time threshold according to city traffic conditions and
the GPS data sampling rate. (Hess et al., 2015) determined the time threshold according to
local freight policies. (Greaves and Figliozzi, 2008) selected the most suitable time threshold
from a certain time range by a manual check. In addition, some studies (Arentze et al.,
                                            3 of 30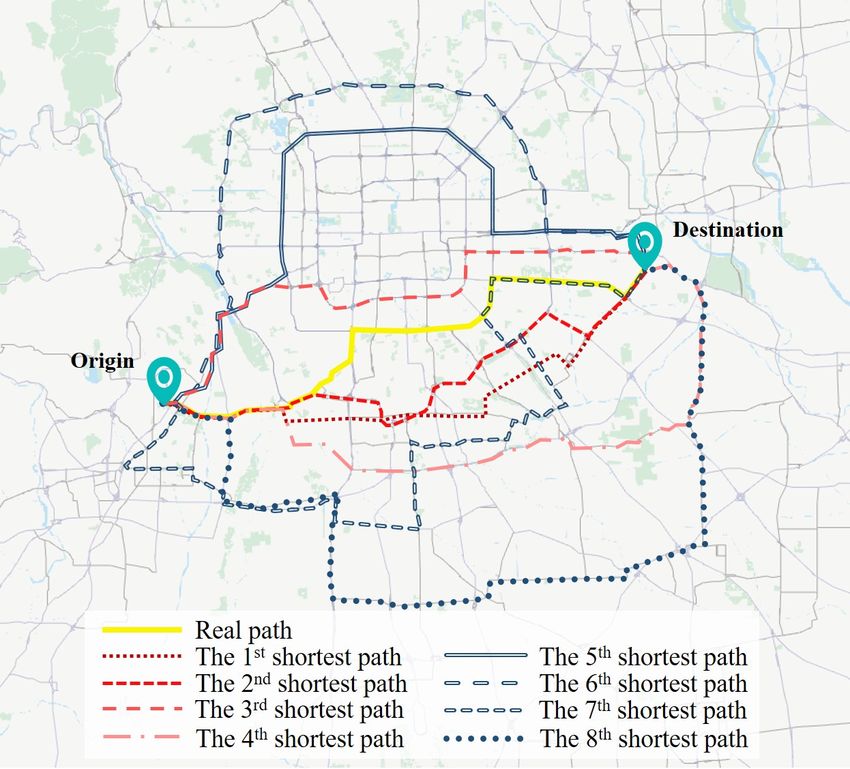
2012; Feng et al., 2012; Gingerich et al., 2016; Huang et al., 2014; Laranjeiro et al., 2019;
Zanjani et al., 2015) subjectively determined different time thresholds according to the
characteristics of heavy truck freight activities. Overall, the time threshold determination
methods proposed in most previous studies are subjective and feasible for specific scenarios
but lack universality. However, the above methods may not be suitable for intracity trip end
identification since these method determined only one single time threshold. In intracity
freight, heavy truck transport activities are usually organized in the form of trip chains;
that is, heavy trucks start from a base (i.e., freight enterprise, logistics warehouse and
factory), make multiple trips for different purposes, and finally return to this base. In a trip
chain, a heavy truck dwells longer at the base and shorter at intermediate destinations.
Moreover, the spatial patterns of truck trip chains are complex and diverse in different
cities (Siripirote et al., 2020). Therefore, a single time threshold may not be sufficient to
accurately identify heavy truck short-stay trip ends in a trip chain.
  To address this issue, (Thakur et al., 2015) proposed a trip end identification method
with dynamic time threshold adjustment. This method first manually determines three-
time thresholds, i.e., 30 min, 15 min and 5 min, and then dynamically selects a suitable
time threshold according to the circuity ratio (the ratio between the straight line distance
and cumulative geodetic distance from the origin to destination) of the truck trajectory.
The smaller the circuity ratio of a GPS trajectory is, the greater the likelihood that it is
composed of multiple trips. This method first uses the time threshold of 30 min to identify
the long-stay trip ends of heavy trucks from a GPS trajectory and then splits this trajectory
into multiple segments (defined as primary subtrajectories) according to the identified trip
ends. Next, this method calculates the circuity ratio of each primary subtrajectory. A
subtrajectory with a circuity ratio less than a predefined threshold of 0.7 is considered
to contain multiple trips due to its significantly circuitous degrees. Then, this method
uses a time threshold of 15 min to identify the trip ends from each primary subtrajectory
composed of multiple trips and splits these primary subtrajectories into multiple secondary
subtrajectories according to the identified trip ends. Similarly, this method uses a time
threshold of 5 min to identify the trip ends from each secondary subtrajectory composed of
multiple trips. After this procedure, this method considers that all trip ends are identified.
This time threshold dynamic adjustment method is applicable for identifying intracity
heavy truck trip ends, greatly improving the identification accuracy of truck short-stay trip
                                             4 of 30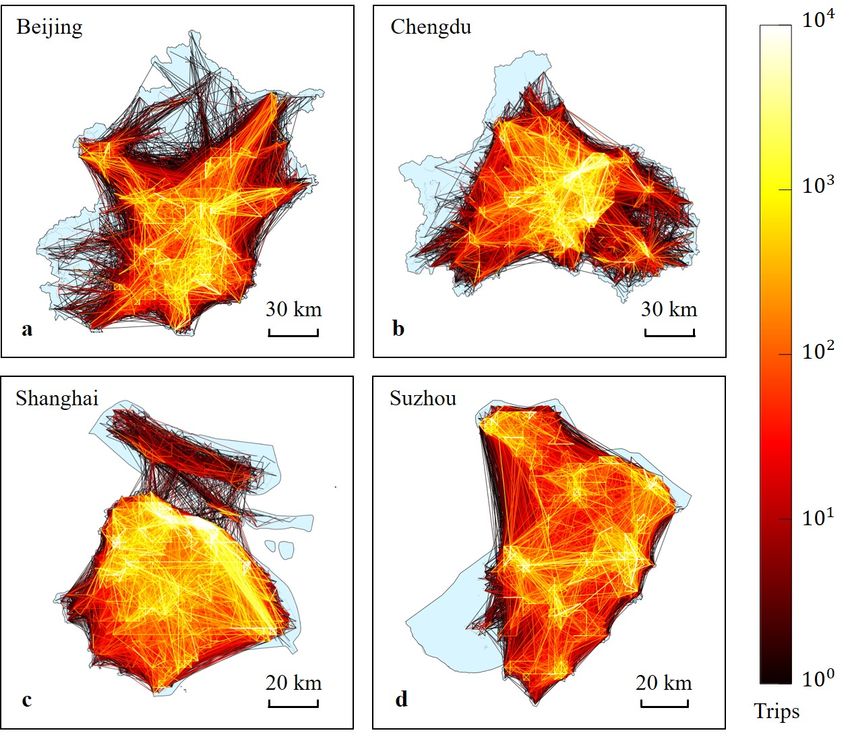
ends in a trip chain. However, the time thresholds (30 min, 15 min and 5 min) and circuity
ratio threshold (0.7) in this method are determined subjectively. In the era of big data,
massive heavy truck GPS trajectories provide the possibility to identify heavy truck trip
ends objectively and accurately. However, a data-driven method of identifying intracity
heavy truck trip ends is still lacking.
     In this paper, we use GPS trajectories of 2.7 million heavy trucks in China as basic data
and propose a data-driven method for identifying intracity heavy truck trip ends. We use a
nonparametric iterative method to determine the multilevel time thresholds. In the process
of trip end identification, we first select the first-level time threshold to identify trip ends
from a GPS trajectory and then split this GPS trajectory into multiple subtrajectories
according to the identified trip ends. Afterward, we determine whether these subtrajectories
are composed of multiple trips according to the circuitous degree of intracity heavy truck
trip paths. For this purpose, we use a multipath generation algorithm and a similarity
analysis method to find the nth shortest path that is closest in length to the intracity heavy
truck trip paths. The nth shortest path is used to measure the circuitous degree of intracity
heavy truck trip paths. Similarly, we select the next level of a smaller time threshold to
identify trip ends from subtrajectories composed of multiple trips. The above process is
iterated until all of the short-stay heavy truck trip ends are identified. For each identified
trip end, we use freight-related POIs and urban road networks to determine whether it is
an actual trip end. Finally, we discuss the potential application value of extracted intracity
heavy truck freight trips.

2.     Data description
2.1.    GPS trajectory data
Our heavy truck GPS trajectory data are from the China Road Freight Supervision and
Service Platform (https://www.gghypt.net/). This platform is used to record the real-time
geographic locations of all heavy trucks in China and monitor their traffic violations. We
obtain the GPS trajectories of 2.7 million heavy trucks over the period from May 18, 2018
to May 24, 2018. The average sampling rate of GPS trajectory data is 30 s. The attributes
of the GPS trajectory data include truck ID, timestamp, longitude, latitude, speed, and
direction angle. We preprocess the raw GPS trajectory data by removing missing, dupli-
cate and other abnormal records to improve data quality. Figure 1a-d shows the spatial
distributions of preprocessed heavy truck GPS trajectories in Beijing, Chengdu, Shanghai
and Suzhou in China.
                                             5 of 30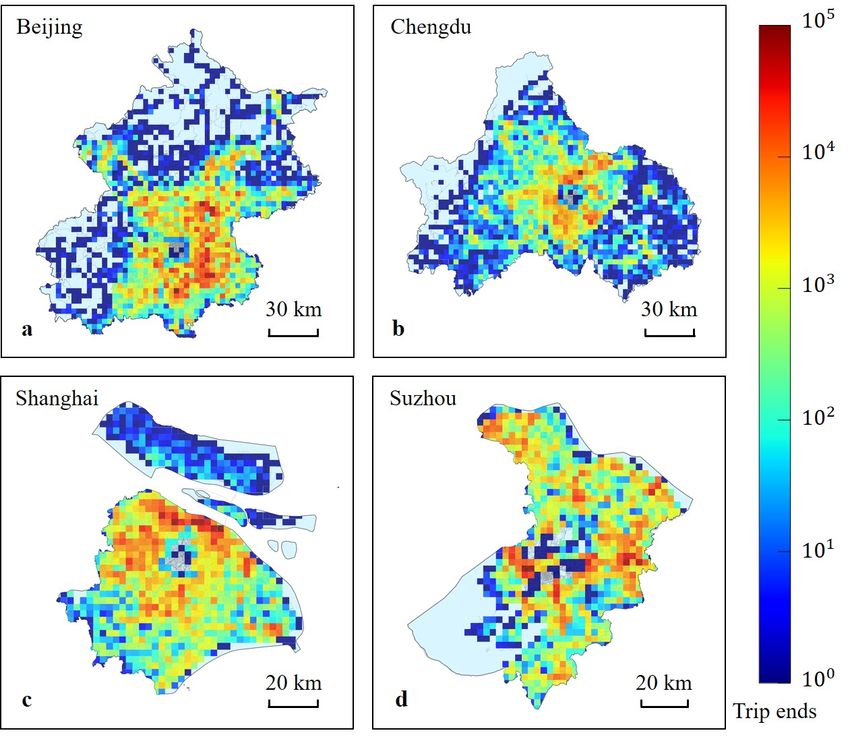
2.2.   Urban road networks
In this paper, we use urban road network as basic data to measure the circuitous degree
of intracity heavy truck trip paths. We use OSMnx (Boeing, 2017), a Python package for
downloading OpenStreetMap (Haklay and Weber, 2008) street network data, to obtain
urban road networks. The urban road network is represented by a directed graph, in which
edges refer to road segments and nodes refer to intersections. Each edge’s weight is its
length. According to the freight policies of different cities (Chen et al., 2019; Wang et al.,
2020a), central areas with high population density are often regulated as restricted areas
for heavy trucks (see Fig. 1e-h). These restricted areas are unreachable for heavy trucks at
certain time periods. Therefore, we remove the road segments within the restricted areas
to construct multiple road networks accessible to heavy trucks at different time periods.

2.3.   Freight-related POI data
In this paper, we use freight-related POI data to remove non-actual trip ends from identi-
fied trip ends to improve method accuracy. We use the application programming interface
(API) of Amap (https://lbs.amap.com) to crawl freight-related POIs in each city. The
attributes of each POI include name, geographic location and location type. The location
types of freight-related POIs include building companies, mechanical electronics, chemical
metallurgy, commercial trade, logistics warehouses, mining companies, factories, agricul-
tural bases, industrial parks and building material markets. Figure 1i-l shows the spatial
distributions of freight-related POIs in four cities. We find that a significant number of
freight enterprises (the major locations where city freight traffic is generated and attracted
(Gonzalez-Feliu and Sanchez-Diaz, 2019)) are located at the periphery of the city center,
indicating an obvious suburbanization trend of city freight activities.

3.     Methodology
We propose a data-driven method to identify the intracity trip ends of each heavy truck.
Figure 2 shows the three main steps in this method. First, we identify heavy truck stops
from GPS trajectories by using a predetermined speed threshold (see Fig. 2a). These iden-
tified truck stops may consist of both trip ends (loading stops, unloading stops and rest
stops) and temporary stops due to refueling, traffic congestion, etc. Second, we determine
multilevel time thresholds and select an appropriate time threshold level according to a
truck’s maximum stopping time to identify trip ends from these truck stops. For exam-
ple, the first-level (maximum) time threshold is selected if it is shorter than this truck’s
                                            6 of 30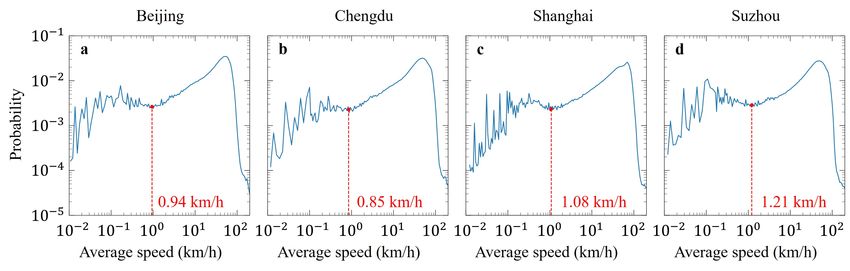
Figure 1    Illustration of the main basic data. a-d Spatial distributions of heavy truck GPS trajectories in four
cities: Beijing, Chengdu, Shanghai and Suzhou. The color bar represents the number of GPS trajectory points on
a road segment. e-h The maximum restricted areas for heavy trucks in these four cities, whose truck restriction
   policies can be found at http://jtgl.beijing.gov.cn, http://cdjg.chengdu.gov.cn, https://dlysj.sh.gov.cn and
 http://jjzd.szgaj.cn. i-l Spatial distributions of freight-related POIs in these four cities. A green dot represents
freight-related POI. The color bar represents the spatial density of freight-related POIs calculated by the kernel
                          density estimation method (Parzen, 1962; Rosenblatt, 1956).

maximum stopping time. Otherwise, another level of shorter time threshold is selected to
ensure that trip ends are identified. Then, we split an entire GPS trajectory into multiple
segments (primary subtrajectories) according to these identified trip ends (see Fig. 2b).
Third, we determine whether these primary subtrajectories may be composed of multiple
trips. If a primary subtrajectory is significantly circuitous, then it is likely to be composed
of multiple trips, as shown in Fig. 2c. We use the next shorter time threshold level to
identify potential trip ends from these significantly circuitous primary subtrajectories. If
these potential trip ends are identified, one primary subtrajectory is split into multiple
secondary subtrajectories, as shown in Fig. 2d. Otherwise, the next shorter time threshold
                                                       7 of 30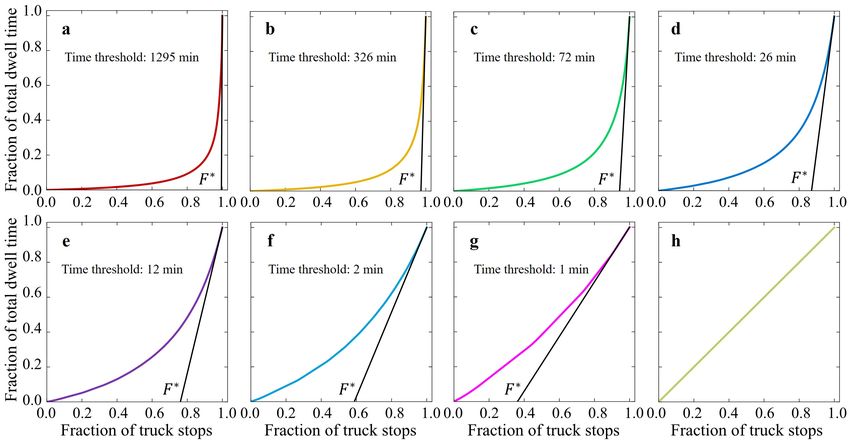
Figure 2    Illustration of the proposed intracity trip end identification methodology. a Identifying truck stops
from an entire GPS trajectory. The purple arrow indicates this truck’s driving direction. b Selecting trip ends from
 truck stops by using an appropriate level of time threshold and splitting this GPS trajectory into five segments,
    i.e., primary subtrajectories (denoted by primary-st), according to the identified trip ends. c One primary
subtrajectory may be composed of multiple trips due to its significantly circuitous degree. d Identifying potential
trip ends from this primary subtrajectory by using the next one or more shorter time threshold levels. This primary
 subtrajectory is split into three secondary subtrajectories (denoted by secondary-st) according to the identified
                                            truck short-stay trip ends.

level is used. The above process is iterated until there are no significantly circuitous sub-

trajectories or the time threshold reaches the minimum value, indicating that all trip ends

in an entire trajectory are identified.
                                                      8 of 30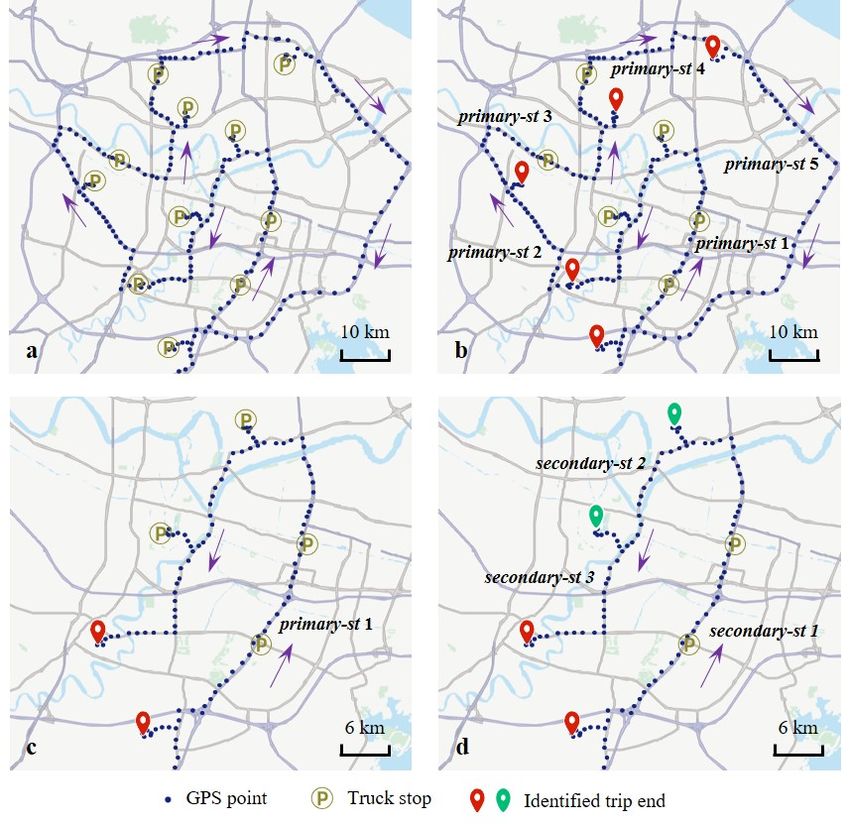
Figure 3    Distributions of heavy truck speed in each time period in four cities. The red dots in panels a-d
 indicate the characteristic transition points of the speed distribution. The speed values corresponding to these
                     transition points are defined as speed thresholds for these four cities.

3.1.   Identifying truck stops from GPS trajectories
In an entire GPS trajectory, we calculate the ratio of the geographical distance and time
difference between two adjacent GPS points, i.e., truck speed in a time period, to infer the
heavy truck motion state (stationary or moving) in this time period. For example, a heavy
truck is considered to be stationary if its speed in a time period is zero. The location where
this stationary heavy truck is located is identified as a truck stop. However, GPS data
drift (Wang and Morton, 2015) may cause positioning deviation, which makes the speed
value of stationary heavy trucks nonzero. Therefore, we need to determine a suitable speed
threshold to identify truck stops from GPS trajectories. We use a data-driven method to
define the speed threshold. In the method, we recognizes the speed characteristics induced
by data drift from the distribution of heavy truck speed in each time period and select the
speed value corresponding to the characteristic transition point of the speed distribution
as a speed threshold.
  First, we calculate the truck speed in each time period and obtain its distribution.
Second, we select the speed value corresponding to the characteristic transition point of
the speed distribution as a speed threshold. Figure 3a-d shows the heavy truck speed
distributions in Beijing, Chengdu, Shanghai and Suzhou in China respectively. We find
that the low-speed part of the distribution curve fluctuates greatly without an obvious
pattern, revealing the characteristics induced by data drift. We select the characteristic
transition points between low-speed part and high-speed part of the speed distribution (i.e.
the local minima) as the speed threshold. In a time period, a heavy truck is considered to
be stationary if its speed is less than the determined speed threshold. We take the center
                                                     9 of 30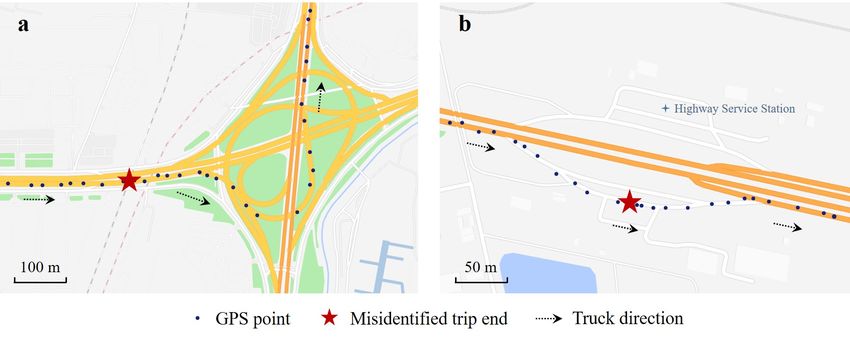
Figure 4   Illustration of the geographic location of a truck stop.

of the GPS points over multiple consecutive stationary time periods as an identified truck
stop, as shown in Fig. 4. The geographic location of a truck stop is indicated by the average
latitude and longitude of these stopped GPS points.

3.2.   Determining multilevel time thresholds
We use a state-of-the-art nonparametric iterative method, named the Loubar method (Bas-
solas et al., 2019; Louail et al., 2014), to determine multilevel time thresholds. Taking
Beijing as an example, we first identify all truck stops by using the method introduced in
Section 3.1. Second, we sort the truck stops in descending order of stopping time and calcu-
late the cumulative stopping time of heavy trucks at the sorted stops. Finally, we normalize
the ordinal number of sorted truck stops and the corresponding cumulative stopping time
to plot the Lorenz curve (Lorenz, 1905), as shown in Fig. 5a. The curvature value of the
Lorenz curve indicates the equilibrium degree of the data distribution. A larger curvature
shows a greater number of truck long-stay stops. According to the Loubar method, we
calculate the intersection point F* of the tangent line of the Lorenz curve at (1, 1) with
the horizontal axis. The truck long-stay stops with normalized ordinal numbers greater
than F* are divided into the first class. The stopping time of a heavy truck at a stop
corresponding to F* is determined as the first-level time threshold, as shown in Fig. 5a.
Next, we remove these truck long-stay stops, then redraw the Lorenz curve for the remain-
ing truck stops to calculate the corresponding F* and determine the next time threshold
level, as shown in Fig. 5b. The above process is repeated (see Fig. 5c-g) until a balanced
data distribution is reached, i.e., the Lorenz curve is a straight line, as shown in Fig. 5h.
Finally, we determine 7 time threshold levels, i.e., 1,295 min, 326 min, 72 min, 26 min, 12
min, 2 min and 1 min. Statistical analysis shows that the maximum stopping time of each
heavy truck is greater than the seventh-level time threshold of 1 min and that of 80% of
the heavy trucks is less than the first-level time threshold of 1,295 min, which indicates
that all heavy truck trip ends can be identified by selecting appropriate time threshold
                                               10 of 30
Figure 5 Multilevel time thresholds were determined by using the Loubar method in Beijing. a Lorenz curve of
heavy truck stopping time at all stops. The red curve represents the Lorenz curve. The black line represents the
tangent Lorenz curve at (1, 1), and F∗ is the intersection point between this tangent and the horizontal axis. The
heavy truck stopping time at the stop corresponding to F* is determined as a time threshold. b The Lorenz curve
of heavy truck stopping time shorter than the time threshold determined in the previous panel, i.e., panel a. and
so on for panels c-h.
levels according to the maximum stopping time of this heavy truck. For different cities,
respective multilevel time thresholds are determined by using the above method.
3.3. Identifying potential trip ends from circuitous subtrajectories
In the process of intracity trip end identification, we first select an appropriate time thresh-
old level according to the maximum stopping time of a heavy truck to identify trip ends
from an entire GPS trajectory and then split this trajectory into multiple subtrajectories.
Each subtrajectory may be composed of one trip or multiple trips. Next, we need to iden-
tify the subtrajectory that may be composed of multiple trips and then use the next level
of the shorter time threshold to identify potential short-stay trip ends.
Here, we determine whether a subtrajectory may be composed of multiple trips according
to its circuitous degree. The city freight context, as indicated by traffic conditions, truck
restriction policies, etc., affects the circuitous degree of heavy truck trajectories. In a single
trip, a heavy truck driver may choose a longer path than the shortest path to bypass truck
restricted areas (Kamali et al., 2016; Luong et al., 2018; Oka et al., 2019), so a truck single
11 of 30trip path is inevitably circuitous. In a subtrajectory composed of multiple trips, a heavy truck needs to serve several clients at different locations, so the circuitous degree of its path tends to be greater than that of a single trip path (Duan et al., 2020a; Moshref-Javadi et al., 2020; Sakai et al., 2017; Zhen et al., 2020). Therefore, we need to measure the circuitous degree of the truck single trip path and use this to determine whether a subtrajectory may be composed of multiple trips. First, we use satellite images to conduct geospatial analysis (Duan et al., 2020b; Gingerich et al., 2016) on truck GPS trajectories to manually extract some heavy truck single trips. Second, we use a multipath generation algorithm (Leblanc et al., 1975) to generate the K shortest paths from the origin to the destination of each single trip. Figure 6 shows the path of a single trip (denoted by the yellow line) and the corresponding eight shortest paths. Third, we compare the length of each single trip path with that of the corresponding K shortest paths and then use proximity analysis (Sorensen, 1948) to identify the nth (n
Figure 6    Multilevel time thresholds were determined by using the Loubar method in Beijing. a Lorenz curve of
heavy truck stopping time at all stops. The red curve represents the Lorenz curve. The black line represents the
tangent Lorenz curve at (1, 1), and F∗ is the intersection point between this tangent and the horizontal axis. The
heavy truck stopping time at the stop corresponding to F* is determined as a time threshold. b The Lorenz curve
of heavy truck stopping time shorter than the time threshold determined in the previous panel, i.e., panel a. and
                                              so on for panels c-h.

may be composed of multiple trips if its length is longer than the corresponding 3rd shortest
path. Then, the next shorter time threshold level is used to identify potential trip ends
from this subtrajectory.

3.4.   Eliminating misidentified trip ends

In this paper, we identify heavy truck trip ends from GPS trajectories by using multilevel
time thresholds. In practice, it is notable that the duration of heavy truck temporary stops
may be similar to the time required for loading or unloading. In this case, some temporary
stops may be misidentified as trip ends. Hence, we need to eliminate misidentified trip ends
by using urban road networks and freight-related POI data to improve method accuracy.
                                                     13 of 30
Figure 7 Measuring length proximity between actual paths and the corresponding eight shortest paths in
Beijing. a-h display of the proximity measure results between actual paths and the first to eighth shortest paths.
The gray points are scatter plots for each trip. The standard boxplot represents the distribution of the length of
the K shortest paths in different bins of the length of actual paths. The blue points represent the average length
of the K shortest paths in different bins. A box is marked in green if the line y = x lies between 10% and 91% in
that bin and is marked in red otherwise.
First, we use urban road networks to eliminate misidentified trip ends located on the
road. Urban road networks consist of four road classes: motorways, primary roads, sec-
ondary roads and tertiary roads. We obtain the average width of each of the four road
classes according to Chinese road construction standards and set it as the buffer distance.
If the minimum distance between an identified trip end and the centerline of the nearest
road is less than half of the buffer distance, this trip end is misidentified and needs to be
eliminated, as shown in Fig. 8a. Otherwise, we use freight-related POI data to determine
whether this trip end is accurately identified. If there is a freight-related POI near the trip
end, this trip end is a real end, as shown in Fig. 8b, and vice versa, as shown in Fig. 8b.
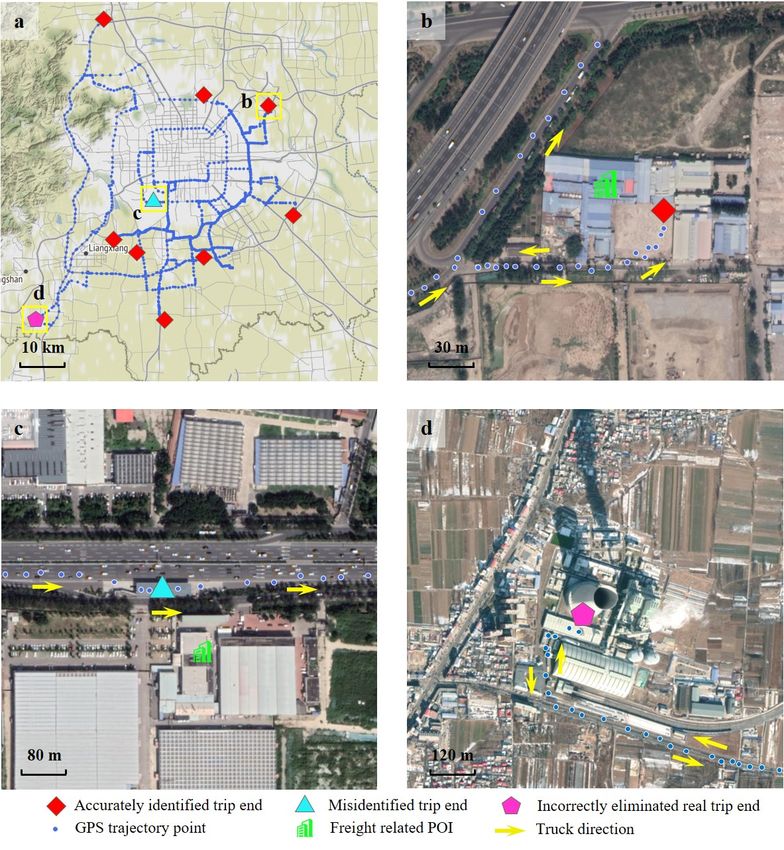
3.5. Method validation
In this paper, we use satellite images and freight-related POI data to conduct geographic
analysis (Gingerich et al., 2016) to validate our proposed method. We randomly extract
1,000 heavy trucks in Beijing as a sample for method validation. Figure 9a shows the valida-
tion results of trip end identification for a typical heavy truck. The four-sided shape repre-
sents the accurately identified trip end. The three-sided shape represents the misidentified
14 of 30Figure 8 Illustration of misidentified trip ends. a A misidentified trip end is located on the road. This heavy
truck may be stuck on the road for a long time due to traffic congestion, traffic control, etc. b A misidentified
trip end not located on the road has no freight-related POI. This heavy truck may stop at a highway service
station because the driver is on a temporary break.
trip end. The five-sided shape represents the real trip end that is incorrectly eliminated
because there is no freight-related POI near it. Figure 9b shows an accurately identified trip
end that is located at a freight enterprise (not located on the road) with a freight-related
POI. Figure 9c shows a case of a trip end being misidentified. In this case, the identified
trip end is not located on the road, and there is a freight-related POI near it. We can find
that this heavy truck stopped at a gas station from the satellite map. Hence, we assume
this trip end is misidentified. Figure 9d shows that a real trip end is wrongly eliminated.
This real trip end is located at a factory from the satellite image, indicating that the heavy
truck is conducting freight activities, such as loading or unloading. However, our method
incorrectly eliminated this real trip end because this factory has no freight-related POI, as
detailed in Section 3.4. According to the above analysis, the method accuracy is calculated
as:
Macc =NA⁄((NA+NM+NE)), (1)
where Macc denotes method accuracy. NA, NM and NE denote the number of accu-
rately identified trip ends, misidentified trip ends and incorrectly eliminated real trip ends,
respectively. The validation results indicate that the method accuracy is 87.45% and that
the percentages of NM and NE are 10.67% and 1.88%, respectively.
15 of 30Figure 9 Method validation for one typical heavy truck in Beijing. A The results of trip end identification and
validation. A dot denotes a GPS point of this heavy truck in one week. The three locations marked by rectangular
boxes correspond to locations in panels b-d. b A case in which a trip end is accurately identified. This trip end is
located at a freight enterprise with freight-related POIs. c A case of a trip end being misidentified. This trip end
is located at a gas station, not at the nearby freight enterprise. d A case in which a real trip end is incorrectly
eliminated. This trip end is located at a factory with no freight-related POI.
4. Results and analysis
4.1. Results of intracity freight trip end identification
We select Beijing, Chengdu, Shanghai and Suzhou as case cities and use the above method
to identify intracity heavy truck trip ends from GPS trajectories. The datasets of these four
cities contain 64,000, 62,000, 94,000 and 92,000 heavy trucks, and the recording duration
of the GPS trajectory is one week. First, we extract intracity heavy truck GPS trajectories
16 of 30by using city administrative division data, which are downloaded from OpenStreetMap.
Second, we determine a speed threshold according to the truck speed distribution (see Sec-
tion 3.1) and then identify truck stops from GPS trajectories by using this speed threshold.
Third, we use the Loubar method to determine multilevel time thresholds. Fourth, we
dynamically select appropriate time threshold levels according to the circuitous degree of
a heavy truck’s single trip path to identify trip ends from truck stops. Fifth, we use freight-
related POIs and urban road networks to determine whether each identified trip end is a
real end to improve method accuracy. Finally, we identify 611,000, 659,000, 1,082,000 and
885,000 heavy truck trip ends in the four cities.
4.2. Results of intracity freight trip end identification
Spatial distributions of heavy truck trip ends can be used to recognize city freight hotspots.
Figure 10 shows the city freight hotspots of four case cities, from which we can see that
most freight hotspots are concentrated in suburban areas, reflecting the suburbanization
trend of heavy truck freight activities (Cidell, 2010). The accurate identification of city
freight hotspots can provide supporting information for authorities to effectively manage
freight enterprises (Bao et al., 2019), monitor environmental pollution (Kovac et al., 2020)
and plan land use (Stevens et al., 2020).
4.3. Spatial distribution of intracity freight trips
We further extract the freight trip sequence of each heavy truck from its identified trip ends
in a week. One freight trip can be extracted according to two consecutive trip ends, i.e., the
former trip end is the origin of this trip and the latter one is the destination. In total, we
extract 547,000, 597,000, 988,000 and 793,000 heavy truck freight trips in Beijing, Chengdu,
Shanghai and Suzhou, respectively. Figure 11 shows the spatial distributions of freight trips
in the four cities. We find that freight interactions between freight hotspots are significantly
greater than those between other city areas. From the perspective of city planning and
management, these extracted freight trips can be used to analyze the economic linkages
and freight interaction intensity between city areas, thus providing a reference for freight
policy making (Le Pira et al., 2017; Wang and Yang, 2018). In addition, heavy truck trip
data can be used to calculate freight traffic generation and attraction, which are the basic
data in city freight transportation planning (Jiang et al., 2020; Wang et al., 2019; Zhao
et al., 2020). From the perspective of corporate operations management, heavy truck trip
17 of 30Figure 10 Method validation for one typical heavy truck in Beijing. A The results of trip end identification and
validation. A dot denotes a GPS point of this heavy truck in one week. The three locations marked by rectangular
boxes correspond to locations in panels b-d. b A case in which a trip end is accurately identified. This trip end is
located at a freight enterprise with freight-related POIs. c A case of a trip end being misidentified. This trip end
is located at a gas station, not at the nearby freight enterprise. d A case in which a real trip end is incorrectly
eliminated. This trip end is located at a factory with no freight-related POI.
data can be used to estimate freight costs (Perez-Martinez and Vassallo-Magro, 2013) and
freight demand (Hassan et al., 2020), which are crucial for transportation cost control and
truck scheduling. From the perspective of freight network optimization, heavy truck trip
data can be used to identify freight traffic bottlenecks (Kocatepe et al., 2020; McCormack
et al., 2012), pointing the way to improve freight network performance.
4.4. Analysis of intracity heavy truck trip chain patterns
Here, we extract intracity trip chains from the trip sequence of each heavy truck. Intracity
heavy truck freight activities are normally conducted in the form of trip chains (liu et al.,
18 of 30Figure 11 Spatial distributions of intracity freight trips in four cities. We partition all cities into equal-area
square zones, each of which is of dimension 3 × 3 km. The color bar represents the number of freight trips
between two zones.
2021; Siripirote et al., 2020), the patterns of which are critical for understanding heavy
truck freight activities. Here, we use the travel network analysis method (Yan et al., 2017)
to identify typical freight trip chains from the trip sequence of each heavy truck. First, we
use the density-based spatial clustering of applications with noise (DBSCAN) algorithm
(Ester et al., 1996) to cluster spatially adjacent trip ends of a heavy truck into one single
point, which is one node of the travel network of this heavy truck. Second, we take the
trips between two nodes as directed edges of this heavy truck travel network. A heavy
truck travels on this network according to its trip sequence, and the node most visited by
this heavy truck is considered as the base point. We split a trip sequence into multiple trip
chains according to the base point, which is the endpoint of each trip chain. In total, we
identify 130 heavy truck trip chain patterns in Beijing, Chengdu, Shanghai and Suzhou.
19 of 30Figure 12 Proportion of heavy truck trip chain patterns in four cities. The top 10 graphs show the typical trip
chain patterns. The hollow circle represents the truck base point, and the solid circle represents one intermediate
destination in a trip chain.
Figure 12 shows the top 10 typical trip chain patterns with the highest proportion in these
four cities. We find that the proportions of various typical trip chain patterns in these
four cities are similar. In Fig. 12, we can see that the trip chain pattern containing one
single intermediate destination (not a base point) has the highest proportion (greater than
60%), while the trip chain patterns containing multiple intermediate destinations only
account for 40%. Commonly, the transportation efficiency of heavy trucks in a trip chain
containing multiple intermediate destinations is higher than that containing one single
intermediate destination (Gonzalez-Calderon et al., 2021). Hence, authorities need to focus
on truck scheduling optimization (Phan and Kim, 2016) to increase the proportion of trip
chains, including multiple intermediate destinations, to improve heavy truck transportation
efficiency.
5. Conclusion and discussion
Extracting freight trips from massive GPS trajectories is of vital importance for city freight
system planning, freight traffic management and corporate operation. Here, we propose
a data-driven method to identify intracity heavy truck trip ends. In the method, the key
threshold parameters are defined objectively, and the intracity heavy truck travel charac-
teristics are considered in the process of trip end identification. First, we determine the
20 of 30speed threshold by analyzing the speed distribution of heavy trucks in a city to identify
truck stops from GPS trajectories. Second, we determine multilevel time thresholds by
using a nonparametric iterative method and dynamically select appropriate levels of time
thresholds to identify trip ends considering the circuitous characteristics of intracity heavy
truck trajectories. Furthermore, we use urban road networks and freight-related POI data
to determine whether each identified trip end is a real trip and eliminate misidentified trips.
Finally, we use satellite images and freight-related POI data to conduct method validation,
the results of which suggest that intracity heavy truck freight trip ends can be accurately
identified from GPS trajectories by using the method we proposed.
We apply the above method to identify heavy truck trip ends in four Chinese cities,
i.e., Beijing, Chengdu, Shanghai and Suzhou. First, we recognize freight hotspots in these
four cities by using the spatial distributions of heavy truck trip ends and analyze the
suburbanization trend of freight activities. Second, we extract intracity heavy truck freight
trips according to the identified trip ends and analyze the freight interactions between
different urban areas. Finally, we use the travel network analysis method to identify typical
trip chain patterns of heavy trucks in the above four Chinese cities. These results can
provide supporting information for freight demand management, land use planning, freight
transportation network optimization and efficiency improvement.
In addition to the potential fields of freight trip data discussed above, heavy truck freight
trips can also be used to study the hierarchical organization and sustainable sprawl of cities.
In recent years, rapid urbanization has raised concerns among authorities and scholars
about city livability and sustainability (Sun et al., 2020). City sustainable development
is facing an imbalance in transportation supply and demand at present, which weakens
the livability and economic dynamics in cities (Wang et al., 2020b). Massive heavy truck
freight trips can be used to understand the spatial distribution of freight demand and to
analyze the constraints of freight supply. The results can be used to improve city livability
and freight sustainability.
Although the accuracy of our proposed method is remarkable, there is still potential for
further improvement. For example, if we can obtain heavy truck status information (e.g.,
engine start/shutdown) from onboard units (OBUs), we can use it to identify truck stops
more accurately. In addition, some of the heavy truck loading and unloading locations
have no freight-related POIs, which may lead to the real trip ends of heavy trucks being
21 of 30incorrectly eliminated. Therefore, richer freight-related POI data obtained by remote sens-
ing (Shi et al., 2020; Yang et al., 2019) provide the possibility to further improve method
accuracy.
6. Acknowledgements
This work was supported by the National Key R&D Program of China (No.
2018YFB1600900) and the National Natural Science Foundation of China (Nos. 71621001,
71822102, 71971015).
7. Reference
Acuto, M., Parnell, S., Seto, K.C., 2018. Building a global urban science. Nature Sustain-
ability 1(1), 2-4. doi:10.1038/s41893-017-0013-9.
Aljohani, K., 2016. Integrating logistics facilities in Inner Melbourne to alleviate impacts
of urban freight transport. 15p.
Allen, J., Ambrosini, C., Browne, M., Patier, D., Routhier, J.-L., Woodburn, A., 2014.
Data Collection for Understanding Urban Goods Movement, In: Gonzalez-Feliu, J., Semet,
F., Routhier, J.-L. (Eds.), Sustainable Urban Logistics: Concepts, Methods and Informa-
tion Systems. Springer Berlin Heidelberg, Berlin, Heidelberg, pp. 71-89. doi:10.1007/978-
3-642-31788-0 5.
Allen, J., Browne, M., Cherrett, T., 2012. Survey Techniques in Urban Freight Transport
Studies. Transport Reviews 32(3), 287-311. doi:10.1080/01441647.2012.665949.
Allen, J., Piecyk, M., Piotrowska, M., McLeod, F., Cherrett, T., Ghali, K., Nguyen,
T., Bektas, T., Bates, O., Friday, A., Wise, S., Austwick, M., 2018. Understanding the
impact of e-commerce on last-mile light goods vehicle activity in urban areas: The case
of London. Transportation Research Part D-Transport and Environment 61, 325-338.
doi:10.1016/j.trd.2017.07.020.
Arentze, T., Feng, T., Robroeks, J., van Brakel, M., Huibers, R., 2012. Compliance with
and influence of a new in-car navigation system for trucks: Results of a field test. Transport
Policy 23, 42-49. doi:10.1016/j.tranpol.2012.06.011.
Aziz, R., Kedia, M., Dan, S., Basu, S., Sarkar, S., Mitra, S., Mitra, P., 2016. Identifying
and Characterizing Truck Stops from GPS Data, In: Perner, P. (Ed.), Advances in Data
Mining: Applications and Theoretical Aspects, pp. 168-182. doi:10.1007/978-3-319-41561-
1 13.
22 of 30Balk, D., Leyk, S., Jones, B., Montgomery, M.R., Clark, A., 2018. Understanding urban-
ization: A study of census and satellite-derived urban classes in the United States, 1990-
2010. Plos One 13(12). doi:10.1371/journal.pone.0208487.
Bao, X., Xing, X., Zhang, D., 2019. Research on Freight Pricing Mechanism of Shipping
Companies Considering Supply Chain Management. Journal of Coastal Research, 568-572.
doi:10.2112/si94-112.1.
Bassolas, A., Barbosa-Filho, H., Dickinson, B., Dotiwalla, X., Eastham, P., Gallotti, R.,
Ghoshal, G., Gipson, B., Hazarie, S.A., Kautz, H., Kucuktunc, O., Lieber, A., Sadilek, A.,
Ramasco, J.J., 2019. Hierarchical organization of urban mobility and its connection with
city livability. Nature Communications 10. doi:10.1038/s41467-019-12809-y.
Behrends, S., 2016. Recent developments in urban logistics research - a review of the
proceedings of the International Conference on City Logistics 2009-2013, In: Taniguchi, E.,
Thompson, R.G. (Eds.), Ninth International Conference on City Logistics, pp. 278-287.
doi:10.1016/j.trpro.2016.02.065.
Boeing, G., 2017. OSMnx: New methods for acquiring, constructing, analyzing, and
visualizing complex street networks. Computers Environment and Urban Systems 65, 126-
139. doi:10.1016/j.compenvurbsys.2017.05.004.
Chen, X., Wu, G., Li, D., 2019. Efficiency measure on the truck restriction policy in
China: A non-radial data envelopment model. Transportation Research Part A-Policy and
Practice 129, 140-154. doi:10.1016/j.tra.2019.08.010.
Cidell, J., 2010. Concentration and decentralization: the new geography of freight dis-
tribution in US metropolitan areas. Journal of Transport Geography 18(3), 363-371.
doi:10.1016/j.jtrangeo.2009.06.017.
Comendador, J., López-Lambas, M.E., Monzón, A., 2012. A GPS Analysis for
Urban Freight Distribution. Procedia Social and Behavioral Sciences 39, 521-533.
doi:10.1016/j.sbspro.2012.03.127.
Deng, Z., Ji, M., American Society of Civil, E., 2010. Deriving Rules for Trip Purpose
Identification from GPS Travel Survey Data and Land Use Data: A Machine Learning
Approach. pp 768-777.
Dernir, E., Bektas, T., Laporte, G., 2014. A review of recent research on green
road freight transportation. European Journal of Operational Research 237(3), 775-793.
doi:10.1016/j.ejor.2013.12.033.
23 of 30Dijkstra, E.W., 1959. A note on two problems in connexion with graphs. Numerische
Mathematik 1(1), 269-271. doi:10.1007/BF01386390.
Duan, M., Qi, G., Wei, G., Guo, R., 2020a. Comprehending and Analyzing Multi-
day Trip-Chaining Patterns of Freight Vehicles Using a Multiscale Method with Pro-
longed Trajectory Data. Journal of Transportation Engineering Part a-Systems 146(8).
doi:10.1061/jtepbs.0000392.
Duan, M.Y., Qi, G.Q., Wei, G., Guo, R.G., 2020b. Comprehending and Analyzing Mul-
tiday Trip-Chaining Patterns of Freight Vehicles Using a Multiscale Method with Pro-
longed Trajectory Data. Journal of Transportation Engineering Part a-Systems 146(8).
doi:10.1061/jtepbs.0000392.
Ester, M., Kriegel, H.-P., Sander, J., Xu, X., 1996. A density-based algorithm for discov-
ering clusters in large spatial databases with noise, Proceedings of the Second International
Conference on Knowledge Discovery and Data Mining. AAAI Press, Portland, Oregon, pp.
226–231.
Evgenikos, P., Yannis, G., Folla, K., Bauer, R., Machata, K., Brandstaetter, C.,
2016. Characteristics and causes of heavy goods vehicles and buses accidents in Europe,
In: Rafalski, L., Zofka, A. (Eds.), Transport Research Arena Tra2016, pp. 2158-2167.
doi:10.1016/j.trpro.2016.05.231.
Feng, T., Arentze, T., Timmermans, H., 2012. Spatial Environmental Analysis on the
Effects of a New Navigation System for Freight Transport. Procedia - Social and Behavioral
Sciences 54, 589-597. doi:10.1016/j.sbspro.2012.09.776.
Gingerich, K., Maoh, H., Anderson, W., 2016. Classifying the purpose of stopped truck
events: An application of entropy to GPS data. Transportation Research Part C-Emerging
Technologies 64, 17-27. doi:10.1016/j.trc.2016.01.002.
Gonzalez-Calderon, C.A., Holguin-Veras, J., Amaya, J., Sanchez-Diaz, I., Sarmiento, I.,
2021. Generalized noortman and van es’ empty trips model. Transportation Research Part
a-Policy and Practice 145, 260-268. doi:10.1016/j.tra.2021.01.005.
Gonzalez-Feliu, J., Sanchez-Diaz, I., 2019. The influence of aggregation level
and category construction on estimation quality for freight trip generation models.
Transportation Research Part E-Logistics and Transportation Review 121, 134-148.
doi:10.1016/j.tre.2018.07.007.
24 of 30Greaves, S.P., Figliozzi, M.A., 2008. Collecting Commercial Vehicle Tour Data with
Passive Global Positioning System Technology Issues and Potential Applications. Trans-
portation Research Record(2049), 158-166. doi:10.3141/2049-19.
Hadavi, S., Verlinde, S., Verbeke, W., Macharis, C., Guns, T., 2019. Monitoring Urban-
Freight Transport Based on GPS Trajectories of Heavy-Goods Vehicles. Ieee Transactions
on Intelligent Transportation Systems 20(10), 3747-3758. doi:10.1109/tits.2018.2880949.
Haklay, M., Weber, P., 2008. OpenStreetMap: User-Generated Street Maps. Ieee Perva-
sive Computing 7(4), 12-18. doi:10.1109/mprv.2008.80.
Hassan, L.A., Mahmassani, H.S., Chen, Y., 2020. Reinforcement learning framework
for freight demand forecasting to support operational planning decisions. Transportation
Research Part E-Logistics and Transportation Review 137. doi:10.1016/j.tre.2020.101926.
Hess, S., Quddus, M., Rieser-Schuessler, N., Daly, A., 2015. Developing advanced route
choice models for heavy goods vehicles using GPS data. Transportation Research Part
E-Logistics and Transportation Review 77, 29-44. doi:10.1016/j.tre.2015.01.010.
Hu, W., Dong, J., Hwang, B.-g., Ren, R., Chen, Z., 2019. A Scientometrics Review on
City Logistics Literature: Research Trends, Advanced Theory and Practice. Sustainability
11(10). doi:10.3390/su11102724.
Huang, J., Wang, L., Tian, C., Zhang, F., Xu, C., 2014. Mining freight truck’s trip
patterns from GPS data. 17th International IEEE Conference on Intelligent Transportation
Systems (ITSC). 1988-1994. doi:10.1109/ITSC.2014.6957996.
Hughes, S., Moreno, S., Yushimito, W.F., Huerta-Cánepa, G., 2019. Evaluation of
machine learning methodologies to predict stop delivery times from GPS data. Transporta-
tion Research Part C: Emerging Technologies 109, 289-304. doi:10.1016/j.trc.2019.10.018.
Jiang, D.D., Wang, W.J., Shi, L., Song, H.B., 2020. A Compressive Sensing-Based
Approach to End-to-End Network Traffic Reconstruction. Ieee Transactions on Network
Science and Engineering 7(1), 507-519. doi:10.1109/tnse.2018.2877597.
Joubert, J.W., Axhausen, K.W., 2011. Inferring commercial vehicle activi-
ties in Gauteng, South Africa. Journal of Transport Geography 19(1), 115-124.
doi:10.1016/j.jtrangeo.2009.11.005.
Kamali, M., Ermagun, A., Viswanathan, K., Pinjari, A.R., 2016. Deriving Truck Route
Choice from Large GPS Data Streams. Transportation Research Record(2563), 62-70.
doi:10.3141/2563-10.
25 of 30Knight, I., Newton, W., 2008. Longer and/or longer and heavier goods vehicles (LHVs):
a study of the likely effects if permitted in the UK. Citeseer.
Kocatepe, A., Ozkul, S., Ozguven, E.E., Sobanjo, J.O., Moses, R., 2020. The Value
of Freight Accessibility: a Spatial Analysis in the Tampa Bay Region. Applied Spatial
Analysis and Policy 13(2), 527-546. doi:10.1007/s12061-019-09314-6.
Kovac, I., Vuletic, A., Mlinaric, D., 2020. Environmental responsibility of Croatian road
freight transport enterprises. International Journal of Retail & Distribution Management
48(9), 1023-1035. doi:10.1108/ijrdm-07-2019-0248.
Laranjeiro, P.F., Merchan, D., Godoy, L.A., Giannotti, M., Yoshizaki, H.T.Y., Winken-
bach, M., Cunha, C.B., 2019. Using GPS data to explore speed patterns and temporal
fluctuations in urban logistics: The case of Sao Paulo, Brazil. Journal of Transport Geog-
raphy 76, 114-129. doi:10.1016/j.jtrangeo.2019.03.003.
Le Pira, M., Marcucci, E., Gatta, V., Inturri, G., Ignaccolo, M., Pluchino, A., 2017. Inte-
grating discrete choice models and agent-based models for ex-ante evaluation of stakeholder
policy acceptability in urban freight transport. Research in Transportation Economics 64,
13-25. doi:10.1016/j.retrec.2017.08.002.
Leblanc, L.J., Morlok, E.K., Pierskalla, W.P., 1975. EFFICIENT APPROACH TO
SOLVING ROAD NETWORK EQUILIBRIUM TRAFFIC ASSIGNMENT PROBLEM.
Transportation Research 9(5), 309-318. doi:10.1016/0041-1647(75)90030-1.
liu, F., Gao, Z., Janssens, D., Jia, B., Wets, G., Yang, Y., 2021. Identifying business
activity-travel patterns based on GPS data. Transportation Research Part C: Emerging
Technologies 128, 103136. doi:10.1016/j.trc.2021.103136.
Lorenz, M.O., 1905. Methods of Measuring the Concentration of Wealth. Publications of
the American Statistical Association 9(70), 209-219. doi:10.1080/15225437.1905.10503443.
Louail, T., Lenormand, M., Cantu Ros, O.G., Picornell, M., Herranz, R., Frias-Martinez,
E., Ramasco, J.J., Barthelemy, M., 2014. From mobile phone data to the spatial structure
of cities. Scientific Reports 4. doi:10.1038/srep05276.
Luong, T.D., Tahlyan, D., Pinjari, A.R., 2018. Comprehensive Exploratory Analysis of
Truck Route Choice Diversity in Florida. Transportation Research Record 2672(9), 152-
163. doi:10.1177/0361198118784175.
Ma, X., McCormack, E.D., Wang, Y., 2011. Processing Commercial Global Positioning
System Data to Develop a Web-Based Truck Performance Measures Program. Transporta-
tion Research Record(2246), 92-100. doi:10.3141/2246-12.
26 of 30McCabe, S., Kwan, H., Roorda, M.J., 2013. COMPARING GPS AND NON-GPS SUR-
VEY METHODS FOR COLLECTING URBAN GOODS AND SERVICE MOVEMENTS.
International Journal of Transport Economics 40(2), 183-205.
McCormack, E., Hallenbeck, M.E., Trb, 2006. ITS devices used to collect truck data for
performance benchmarks, National, State, and Freight Data Issues and Asset Management,
pp. 43-50.
McCormack, E., Ma, X., Klocow, C., Curreri, A., Wright, D., 2010. Developing a GPS-
based truck freight performance measure platform.
McCormack, E., Zhao, W.J., Dailey, D.J., Ieee, 2012. GPS Tracking Of Freight Vehicles
To Identify And Classify Bottlenecks, 2012 15th International Ieee Conference on Intelli-
gent Transportation Systems, pp. 1245-1249.
Moshref-Javadi, M., Lee, S., Winkenbach, M., 2020. Design and evaluation of a multi-
trip delivery model with truck and drones. Transportation Research Part E-Logistics and
Transportation Review 136. doi:10.1016/j.tre.2020.101887.
Oka, H., Hagino, Y., Kenmochi, T., Tani, R., Nishi, R., Endo, K., Fukuda, D., 2019. Pre-
dicting travel pattern changes of freight trucks in the Tokyo Metropolitan area based on the
latest large-scale urban freight survey and route choice modeling. Transportation Research
Part E-Logistics and Transportation Review 129, 305-324. doi:10.1016/j.tre.2017.12.011.
Pani, A., Sahu, P.K., 2019. Modelling non-response in establishment-based freight sur-
veys: A sampling tool for statewide freight data collection in middle-income countries.
Transport Policy. doi:10.1016/j.tranpol.2019.10.011.
Papadopoulos, A.-A., Kordonis, I., Dessouky, M.M., Ioannou, P.A., 2021. Personalized
Pareto-improving pricing-and-routing schemes for near-optimum freight routing: An alter-
native approach to congestion pricing. Transportation Research Part C-Emerging Tech-
nologies 125. doi:10.1016/j.trc.2021.103004.
Parzen, E., 1962. On Estimation of a Probability Density Function and Mode. Ann.
Math. Statist. 33(3), 1065-1076. doi:10.1214/aoms/1177704472.
Perez-Martinez, P.J., Andrade, M.d.F., de Miranda, R.M., 2017. Heavy truck restrictions
and air quality implications in Sao Paulo, Brazil. Journal of Environmental Management
202, 55-68. doi:10.1016/j.jenvman.2017.07.022.
Perez-Martinez, P.J., Vassallo-Magro, J.M., 2013. Changes in the external costs of
freight surface transport In Spain. Research in Transportation Economics 42, 61-76.
doi:10.1016/j.retrec.2012.11.006.
27 of 30Phan, M.H., Kim, K.H., 2016. Collaborative truck scheduling and appointments
for trucking companies and container terminals. Transportation Research Part B-
Methodological 86, 37-50. doi:10.1016/j.trb.2016.01.006.
Pluvinet, P., Gonzalez-Feliu, J., Ambrosini, C., 2012. GPS data analysis for understand-
ing urban goods movement, In: Taniguchi, E., Thompson, R.G. (Eds.), Seventh Interna-
tional Conference on City Logistics, pp. 450-462. doi:10.1016/j.sbspro.2012.03.121.
Rosenblatt, M., 1956. Remarks on Some Nonparametric Estimates of a Density Function.
Ann. Math. Statist. 27(3), 832-837. doi:10.1214/aoms/1177728190.
Sakai, T., Kawamura, K., Hyodo, T., 2017. Logistics Chain Modeling for Urban Freight
Pairing Truck Trip Ends with Logistics Facilities. Transportation Research Record(2609),
55-66. doi:10.3141/2609-07.
Sakai, T., Kawamura, K., Hyodo, T., 2019. Evaluation of the spatial pattern of logis-
tics facilities using urban logistics land-use and traffic simulator. Journal of Transport
Geography 74, 145-160. doi:10.1016/j.jtrangeo.2018.10.011.
Sharma, S., Shelton, J., Valdez, G., Warner, J., 2020. Identifying optimal Truck
freight management strategies through urban areas: Case study of major freight corri-
dor near US-Mexico border. Research in Transportation Business & Management, 100582.
doi:10.1016/j.rtbm.2020.100582.
Shi, K.F., Chang, Z.J., Chen, Z.Q., Wu, J.P., Yu, B.L., 2020. Identifying and evaluating
poverty using multisource remote sensing and point of interest (POI) data: A case study
of Chongqing, China. J. Clean Prod. 255. doi:10.1016/j.jclepro.2020.120245.
Siripirote, T., Sumalee, A., Ho, H.W., 2020. Statistical estimation of freight activity
analytics from Global Positioning System data of trucks. Transportation Research Part
E-Logistics and Transportation Review 140. doi:10.1016/j.tre.2020.101986.
Sørensen, T., 1948. A Method of Establishing Groups of Equal Amplitude in Plant
Sociology Based on Similarity of Species Content and Ist Application to Analyses of the
Vegetation on Danish Commons. I kommission hos E. Munksgaard.
Stevens, C.J., Greif, A., Bouma, D., 2020. Do companies care about sustain-
able land governance? An empirical assessment of company land policies. Inter-
national Journal of Sustainable Development and World Ecology 27(4), 334-348.
doi:10.1080/13504509.2019.1701582.
28 of 30You can also read