IEEE ICDM 2010 Contest TomTom Traffic Prediction for Intelligent GPS Navigation
←
→
Page content transcription
If your browser does not render page correctly, please read the page content below
2010 IEEE International Conference on Data Mining Workshops
IEEE ICDM 2010 Contest
TomTom Traffic Prediction for Intelligent GPS Navigation
Marcin Wojnarski∗ , Paweł Gora† , Marcin Szczuka† , Hung Son Nguyen† , Joanna Swietlicka∗ and Demetris Zeinalipour‡
∗ TunedIT Solutions, Zwirki i Wigury 93/3049, 02-089 Warsaw, Poland
Email: {marcin.wojnarski,j.swietlicka}@tunedit.org
† Faculty of Mathematics, Informatics and Mechanics, The University of Warsaw, Banacha 2, 02-097 Warsaw, Poland
Email: {pawelg,szczuka,son}@mimuw.edu.pl
‡ Department of Computer Science, University of Cyprus, 1678 Nicosia, Cyprus
Email: dzeina@cs.ucy.ac.cy
Abstract—In this foreword, we summarize the IEEE ICDM competition in Pisa, Italy with title: “Radioxenon moni-
2010 Contest: “TomTom Traffic Prediction for Intelligent GPS toring for verification of the Comprehensive nuclear-Test-
Navigation”. The challenge was held between Jun 22, 2010 and Ban Treaty” (http://www.cs.uu.nl/groups/ADA/icdm08cup/).
Sep 7, 2010 as an interactive on-line competition, using the
TunedIT platform (http://tunedit.org). We present the scope of In 2009, the Walt Schneider Research Lab at the Uni-
the ICDM contest series in general, the scope of this year’s versity of Pittsburgh (USA) organized a competition in
contest, description of its tasks, statistics about participation, Miami, FL USA with title: “The Pittsburgh Brain Competi-
details about the TunedIT platform and the Traffic Simulation tion” (http://pbc.lrdc.pitt.edu/). This year, TunedIT Solutions
Framework. A detailed description of winning solutions is part (Poland), the University of Warsaw (Poland) and TOMTOM
of this proceeding series.
International BV (The Netherlands), organize a competition
Keywords-Contest, TomTom, TunedIT, traffic, simulation, in Sydney Australia with title: “Traffic Prediction for Intel-
prediction, data mining, Warsaw ligent GPS Navigation” (http://tunedit.org/challenge/IEEE-
ICDM-2010)
I. T HE ICDM DATA M INING (DM) C ONTEST II. T HE 2010 C ONTEST D ESCRIPTION
The ICDM Data Mining Contest offers a unique opportu- Over the last century the number of cars engaged in
nity to scientists and enterprises, to involve teams of domain vehicular traffic in cities has increased rapidly, causing many
experts that will compete against each other in order to difficulties for all citizens: traffic jams, large and unpre-
develop and test data mining techniques that can improve dictable communication delays, pollution etc. Excessive traf-
real or realistic applications. fic became a civilization problem that affects everyone who
The general philosophy of the contest is to provide to lives in a city of 50,000 or larger, anywhere in the world.
participants a set of custom datasets, evaluation metrics Complexity of processes that stand behind traffic flow is so
(or software tools) as well as expected answers to a set large, that only data mining algorithms may bring efficient
of predetermined tasks. The participants are then asked solutions. With the IEEE ICDM 2010 Contest, the organizers
to identify the best possible solutions to the given tasks asked researchers to devise the best possible algorithms that
maximizing the given evaluation metrics. Competing team tackle problems of traffic flow prediction, for the purpose of
work off-line to implement the tasks outlined by the contest intelligent driver navigation and improved city planning.
organizers. The results of each team are then submitted The challenge was organized in the form of an in-
to the organizers prior the conference date. The contest teractive on-line competition, at TunedIT platform, be-
organizers select the submissions that will be included in tween June 22, 2010 and September 7, 2010. The winners
the proceedings of the conference. The awarding process is were awarded prizes worth $5000, sponsored by TomTom
carried out during the conference. (http://www.tomtom.com/).
The previous ICDM DM contests were organized as Organizing Committee of the challenge consisted of four
follows: In 2007, the Hong Kong University of Science and members: Marcin Wojnarski, Paweł Gora, Hung Son Nguyen
Technology (Hong Kong) organized a competition in Om- and Marcin Szczuka.
aha, NE (USA) with title: “Estimating Location Using Wi- The contest was sub-divided into three independent tasks:
Fi” (http://www.cse.ust.hk/˜qyang/ICDMDMC07/). In 2008, 1) Task 1 – Traffic congestion prediction, in an ele-
the University of Ottawa (Canada), the Universiteit Utrecht mentary setup of time series forecasting: a series of
(Netherlands) and Health Canada (Canada) organized a measurements from 10 selected road segments is given
978-0-7695-4257-7/10 $26.00 © 2010 IEEE 1372
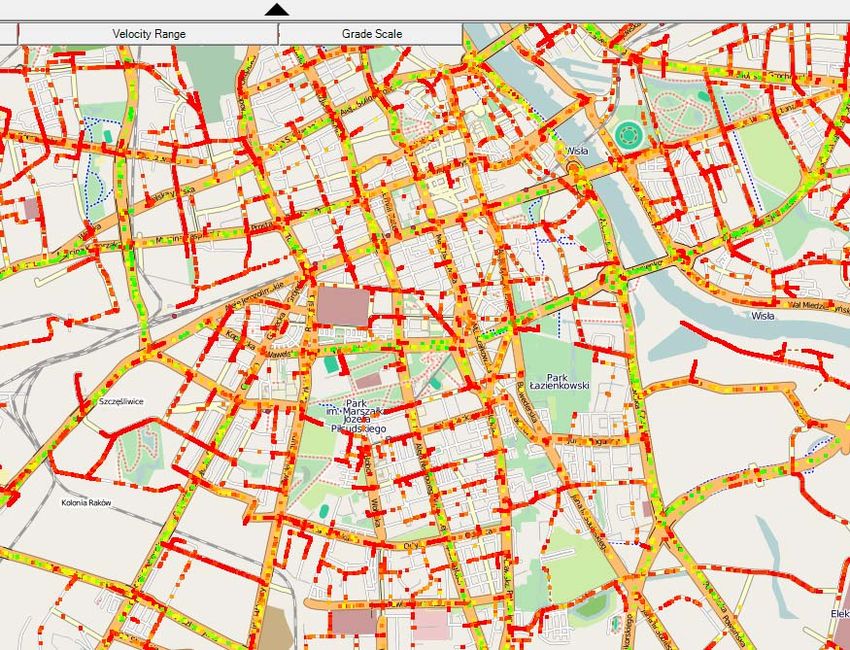
DOI 10.1109/ICDMW.2010.51and the goal is to make short-term predictions of future Figure 1. Screen-shot of the Traffic Simulation Framework
values based on historical ones.
2) Task 2 – Modeling the process of traffic jams for-
mation during the morning peak in the presence of
roadwork, based on initial information about jams
broadcast by radio stations. Input data contain identi-
fiers of road segments closed due to roadwork, accom-
panied by a sequence of segments where the first jams
occurred. The algorithms had to predict a sequence of
segments where next jams occur in the nearest future.
3) Task 3 – Traffic reconstruction and prediction based
on real-time information from individual drivers. Input
data consists of a stream of notifications from 1%
of vehicles about their current locations in the city
road network, sent every 10 seconds. The algorithm
received this stream and had to predict the traffic
congestion on selected road segments for the next
30 minutes. Large volumes of data were involved in clock, cars change their positions and speeds with carefully
this task, requiring the use of scalable data mining chosen rules [1].
methods.
Nagel-Schreckenberg (NS) model was broadly examined
As tasks were independent, anyone could participate in all and generalized [3], [4]. In particular, it was shown that
of them or in a chosen one. this model can reproduce the phenomenon of traffic jams
All three tasks address the same problem of traffic con- with unprecedented accuracy. TSF extends the NS model to
gestion prediction, but each of them approaches this problem simulate traffic on an arbitrarily complex graph of road seg-
from a different perspective: employs data of different char- ments and incorporates new rules to model crossroads, traffic
acteristics and structure, expects different output decisions lights, multi-lane streets etc. Each car is an autonomous
from the algorithm, has different levels of difficulty and agent, with its own start and destination points, as well as
requires the use of different data mining techniques. A preferences regarding its road behavior. Road segments may
graph topology of streets was available to participants. To differ in type (minor/major), default maximal velocity and
find the most effective algorithms, they had to mine these number of lanes - authentic data are included in maps from
structured data and exploit regularities observed for different OpenStreetMap. TSF enables users to edit configuration of
nodes, segments and subgraphs. traffic lights, distribution of start and destination points,
All the tasks are very important for practical applications. and many other simulation parameters. It was confirmed by
They are also related to the most current and hotly debated Warsaw citizens who are intensive car drivers that TSF very
topics in data mining research: mining structured data, accurately reproduces traffic jams, in the same places where
mining data streams, large-scale and temporal data mining. they occur in reality.
III. T RAFFIC S IMULATION F RAMEWORK After the contest, TSF will be released for public use,
to enable post-competition research.
Competition datasets come from a simulator of vehicular
traffic, the Traffic Simulation Framework (TSF) [1], being IV. R ESULTS
developed at the University of Warsaw since 2007. Simula-
tions employed authentic map of the city of Warsaw, Poland, The contest attracted 575 participants (both teams and
taken from OpenStreetMap project. individuals), of whom over 100 submitted solutions, most of
Thanks to the use of TSF, we had knowledge about traffic them several times: the total number of solutions was nearly
on any given edge of the street graph, at any point in time, 5000. Best algorithms achieved nearly 3-fold improvement
so we could provide data that would have been unavailable over baseline solutions in predicting traffic congestion and
otherwise, like target decisions in the 3rd problem. We could jams.
also formulate more challenging and interesting tasks. The results obtained by the three best participants in
Simulations in TSF are based on the most well-known, each track, together with baseline results, are presented in
realistic model of Nagel and Schreckenberg [2], used also tables I, II, and III, respectively. The symbol (*) next to the
in the German project of Autobahn Traffic in North Rhine- participant’s rank denotes that there is a report describing
Westphalia [5]. The model describes traffic on straight, one- their solution in this proceedings.
way road, divided into some number of cells. Each cell may All resources, data, TSF and information from compe-
contain one car or may be empty. In each tick of a discrete tition discussion blog and discussion list are now publicly
1373Table I Data from ATRs are used further on to make short-term
F INAL RESULTS OF THE T RAFFIC TASK
and long-term predictions, for the purpose of driver naviga-
Rank Participant or Team Username Result
Alexander Groznetsky,
tion and urban planning (roadwork, new road construction
1 alegro 25.2327 etc.), as for example in the Autobahn Traffic project [5].
Ukraine
Carlos J. Gil Bellosta, In this task, we asked participants to devise algorithms
2* datanalytics 25.4167
Datanalytics, Spain for making predictions of this kind. We simulated a time
Benjamin Hamner, series of congestion measurements produced by ATRs in-
3 hamner 25.4337
Duke University, USA
stalled on 10 selected road segments in the city of War-
— Baseline — 44.9444
saw and asked participants to make short-term predictions
of future values based on historical ones. This task was
Table II intended as an introductory one. It used an elementary
F INAL RESULTS OF THE JAMS TASK
framework of time series forecasting, so that everybody
Rank Participant or Team Username Result
could try to solve it. Despite the simplicity of the problem
Lukasz Romaszko,
1* University of Warsaw, lukasz212121 0.56056 formulation, its solution has practical importance both for
Poland driver navigation and city planning.
Jingrui He, Qing He, Data consist of a time series of 20 congestion measure-
Grzegorz Swirszcz,
Yiannis Kamarianakis,
ments, 2 values for each of the 10 selected road segments,
2* Rick Lawrence, Wei Shen trafficlab 0.55793 corresponding to two opposite directions of traffic flow.
and Laura Wynter, Congestion – the number of cars that passed a given segment
IBM T.J. Watson
Research Center, USA
– was measured in consecutive 1-minute periods of time. The
Kenneth Shirley,
TSF simulator worked in 10-hour long simulation cycles.
Carlos Scheidegger, During the cycle, distributions of start and destination points
Ji Meng Loh of new vehicles were exchanged every 60 minutes. After 10
3 regress 0.55614
and Suhris Balakrishnan,
AT&T Labs Research,
hours, simulation was restarted from scratch. Distributions
USA were selected randomly from a pool of 10 predefined ones,
— Baseline — 0.42805 manually designed and verified against real-world plausibil-
ity. Additionally, small random fluctuations were imposed on
selected distributions every time and configuration of traffic
lights was modified.
available. Everyone can use them as a start point for new The training dataset, publicly available for participants,
research. consisted of a continuous stream of data collected over
V. TASKS 1000 hours of simulation, divided into a hundred of 10-
hour long independent cycles. The test dataset covered
A. Task 1 - “Traffic”: Traffic congestion prediction different 1000 hours, and was split into 60-minute long
Many municipalities use devices called Automatic Traffic windows, of which only the first 30 minutes were revealed
Recorders (ATR) to collect traffic data from a number of se- to participants, while the other 30 minutes were left for
lected road segments in the city. ATRs are magnetic loops evaluation of predictions. The task was to predict congestion
embedded in the pavement surface, detecting the presence (total number of cars) for time period between 10 and
of metal and transforming this information to volume data. 20 minutes ahead, i.e., for the period between 41’st and
50th minute of every window. Windows in the test dataset
Table III
were permuted, so that participants could not deduce future
F INAL RESULTS OF THE GPS TASK congestion by looking at the following time window.
Rank Participant or Team Username Result The baseline solution was calculated as a total number of
Benjamin Hamner, cars in the last ten minutes of the known part of the window
1* hamner 6.7719
Duke University, USA
(minutes 21’st till 30th).
Jingrui He, Qing He,
Grzegorz Swirszcz, Solutions were evaluated by the Root Mean Squared Error
Yiannis Kamarianakis, (RMSE) of predictions.
2* Rick Lawrence, Wei Shen trafficlab 7.4556
and Laura Wynter, B. Task 2 - “Jams”: Modeling the process of traffic jams
IBM T.J. Watson
Research Center, USA
formation in the presence of roadwork
Andrzej Janusz, It was a long time ago when radio stations came up
3 University of Warsaw, NosferatoCorp 7.5779 with an idea of collecting current information about traffic
Poland
jams, roadwork or accidents, and radio broadcasting it to all
— Baseline — 18.0649
the drivers, so that they can go around the impassable places.
1374In this task we wanted to go one step further and try to mine length sequence of identifiers - we employed a non-standard
the data gathered during the initial phase of the morning evaluation metric, based on the concept of Mean Average
peak, in order to predict where the next set of jams is Precision (MAP), from the domain of Information Retrieval,
going to happen during the main phase of the peak. Such adapted to the specifics of this task. For each sample, quality
predictions could be used to warn drivers in advance, before of prediction was calculated as:
the jams actually occur. 1
N
N · i=1 P recision(i), where:
Data collected by radio broadcasters have some distinct
features that influence the way they should be mined and |Pi ∩ Ti |
P recision(i) = ,
with which algorithms. These features were reflected in the i
competition data. Firstly, they are imprecise: detailed mea- P - is the predicted sequence of identifiers, T - is the
surements of speed and number of cars, as well as the time a target sequence of identifiers, Pi , Ti - are sets of first i
traffic jam first occurred, are missing. Secondly, they cover elements of P and T , N = max(length(P ), length(T )).
only major roads that constitute at most 25% of the whole This measure reaches the largest value when both se-
road network. The missing part of information, related to quences are exactly equal and punishes any deviations
minor roads, may influence jams on major roads and thus of predictions from the target, like: different length of the se-
should be included, e.g., as latent variables, in decision quence, different order of identifiers, lack of expected
models. Competition data exhibited the same properties: identifiers or presence of non-expected identifiers. Mistakes
it contains ordered sequences of street identifiers alone, on initial positions of the sequence are punished stronger
without any numeric information on congestion or timing than on further ones.
of jams, covering only major streets of Warsaw. Overall result for the test set was calculated as an arith-
Input data contained identifiers of 5 road segments closed metic average of values calculated for each sample.
due to roadwork – 2 on major roads and 3 on minor – accom-
panied by a sequence of segments of major roads where the C. Task 3 - “GPS”: Smart GPS navigator
first jams occurred during the initial 20 minutes of the sim- Recently two independent technologies - GPS car naviga-
ulation. The task was to predict a sequence of segments tion and wireless Internet access in cell phones - became so
of major roads where next jams occur in the next 40 minutes. popular, that many drivers use them both and thus can send
The length of both sequences could vary between samples. their current GPS positions to the server in real time. Stream
Graph of Warsaw’s streets was given to participants, so of such data coming from different drivers can be merged to
that they could exploit the structural dependencies between reconstruct current map of traffic in the whole city and make
different parts of the network. predictions for the next period of time, using data mining
The criterion that defined a jam involved both the average methods. These predictions would be sent back to drivers to
speed and number of cars on a given segment. A segment be employed in smart real-time journey planning: choosing
was said to be jammed if the average speed over the last 6 faster routes and optimizing global traffic in the city.
minutes was lower than 5 km/h and the number of cars that In the third task we asked participants to devise al-
have passed or stayed on this segment was larger than 10. gorithms for solving this problem. We assumed that 1%
A given road segment could be listed at most once during (∼500) of drivers in TSF use GPS navigation, which sends
the simulation, when it got jammed for the first time. a notification to the central server about its current GPS
Data samples were generated from independent 1-hour position and velocity every 10 seconds. Algorithms designed
long simulations, starting each time with an empty road by participants received this stream as an input. The stream
network, fed subsequently with cars according to the se- covered a 30-minute interval, and the participant had to
lected distributions of start and destination points. Selection predict average velocity of vehicles passing 100 selected
of distributions was done in the same way as for Task 1. road segments in 6-minute time periods: from now on until
Locations of roadwork were selected randomly. Training 6 minutes ahead, and between 24th and 30th minute ahead.
and test sets consisted of 5000 samples (hours) each. In the Harmonic mean was used instead of arithmetic mean, as it
test set, only the input part of samples was revealed, while corresponds better to travel times, which are the ultimate
the output part - the sequence of next predicted jams - was criterion of optimization in a real-world setting. Another
submitted by participants as a solution. requirement for the algorithms was scalability, since the
The baseline solution predicted always the most fre- provided sets of data were highly voluminous: the training
quently jammed edges that did not appear in the input part set had several GBs.
of a given sample. The length of the prediction was equal to Training and test datasets covered 500 hours of simulation
the average length of output sequences in the training data. each. The same type of simulation as in the ”Traffic” task,
Frequency of jams on a given edge was calculated over the consisting of 10-hour long cycles, was used. Test set was
whole training data. split into one-hour windows, half of each window was re-
Due to atypical form of output decisions - varying- vealed, and another half was to be predicted by participants.
1375The baseline solution was the average velocity of all cars mitted after the end of the contest, against challenge
that passed through each of the edges in the whole given datasets, in the same experimental setup. This frame-
30-minute long period. If there was no such car, the overall work employs TunedTester application and a database
average was taken. of experimental results.
Solutions were evaluated by the Root Mean Squared Error
ACKNOWLEDGMENTS
(RMSE) of inverted predictions. That is, predicted velocities
were transformed - through inverting and multiplying by 60 We would like to thank the Conference Chair, Dimitrios
- into predicted travel time over 1 km of the road segment, Gunopulos (University of Athens, Greece) and Chengqi
expressed in minutes. These travel times were compared Zhang (University of Technology, Sydney, Australia) for
with ground truth using RMSE. their frequent advice that guided us through many of the
questions and concerns that arose along the way. We also
VI. T UNED IT PLATFORM thank the rest organizing committee for taking care of
The contest was hosted dissemination, the proceedings and the local arrangement.
on the TunedIT platform [6]. Our special thanks go to TomTom, the sponsor of the
TunedIT delivers a set of web- competition, and to Mrs. Hanna Gronkiewicz-Waltz, the
based tools that facilitate ex- Mayor of Warsaw, who was the honorary patron.
perimental investigation and scientific collaboration in the This research has been partially supported by grants N
field of data mining and machine learning, especially N516 368334 and N N516 077837 from the Ministry of
the automation of experiments and the generation of re- Science and Higher Education in the Republic of Poland.
producible experimental results. These tools include also
a framework for data mining challenges and competi-
tions (http://tunedit.org/challenges), where different scien-
tific events are periodically organized.
The use of TunedIT Challenges platform has many ad-
vantages:
• Participant registration, submission of solutions and R EFERENCES
publication of results are managed by TunedIT website. [1] P. Gora, Traffic Simulation Framework - a cellular automaton-
• Live leader-board, automated evaluation, multiple sub- based tool for simulating and investigating real city traffic,
missions: solutions are evaluated automatically, in- Recent Advances in Intelligent Information Systems, p. 642-
stantly after their submission, and preliminary results 653, Warsaw, 2009.
are published on Leader-board at the challenge web
[2] K. Nagel, M. Schreckenberg, A cellular automaton model
page. Participants are allowed to submit solutions many for freeway traffic, Journal de Physique, p. 2221-2229, 1992.
times, for the whole duration of the challenge, so
they have opportunity to compare their algorithms with [3] D. Chowdhury, A. Schadschneider, Self-organization of traffic
others’ and make improvements. This gives great fun jams in cities: effects of stochastic dynamics and signal peri-
ods, Physical Review E (Statistical Physics, Plasmas, Fluids,
for participants and encourages high activity.
and Related Interdisciplinary Topics), Volume 59, Issue 2,
• Distinct preliminary and final evaluation: to avoid over- p. 1311-1314, 1999.
fitting to test data used in preliminary evaluation -
which is possible in the presence of live leader-board [4] A. Schadschneider, The Nagel-Schreckenberg model revisited,
and multiple submissions - there is a separate evaluation The European Physical Journal B, Volume 10, Issue 3, p. 573-
582, 1999.
performed at the end of the contest, employing a
distinct dataset. This guarantees that the final results [5] S. Marinsson, R. Chrobok, A. Pottmeier, J. Wahle, M. Schreck-
are non- biased. enberg: Simulation Framework for the Autobahn Traffic in
• Post-challenge research: scientific challenges at North Rhine-Westphalia, in International Conference on Cel-
TunedIT have their continuation even after final results lular Automata for Research and Industry, ACRI, LNCS 2493,
p. 315-324, 2002.
are announced. Challenge resources - test datasets,
evaluation procedures, participants’ solutions etc. - are [6] M. Wojnarski, S. Stawicki, P. Wojnarowski, TunedIT.org: Sys-
published on-line in Repository, so new algorithms tem for Automated Evaluation of Algorithms in Repeatable
can be tested against challenge data, using the same Experiments, in M. Szczuka et al. (Eds.): Rough Sets and
experimental setup. The contest contributes to creation Current Trends in Computing 2010, LNAI 6086, p. 20-29.
Springer, Heidelberg, 2010.
of benchmarks that can be used in future research by
the whole scientific community.
• Post-challenge submissions: TunedIT provides a ver-
satile framework for evaluation of new solutions, sub-
1376You can also read