Impact of mechanical Arenicola dredging on the benthic fauna communities: assessed by a morphological and molecular approach
←
→
Page content transcription
If your browser does not render page correctly, please read the page content below
Vol. 673: 17–28, 2021           MARINE ECOLOGY PROGRESS SERIES
                                                                                               Published September 2
https://doi.org/10.3354/meps13816               Mar Ecol Prog Ser

                                                                                                  OPEN
                                                                                                  ACCESS

         Impact of mechanical Arenicola dredging on
         the benthic fauna communities: assessed by a
            morphological and molecular approach
              Lise Klunder1,*, Judith D. L. van Bleijswijk2, Loran Kleine Schaars1,
                      Henk W. van der Veer1, Pieternella C. Luttikhuizen1
    1
     Department of Coastal Systems, Royal Netherlands Institute for Sea Research, PO Box 59, 1790 AB Den Burg Texel,
                                                   The Netherlands
   2
     Department of Marine Microbiology and Biogeochemistry, Royal Netherlands Institute for Sea Research, PO Box 59,
                                       1790 AB Den Burg Texel, The Netherlands

         ABSTRACT: Lugworm Arenicola spp. dredging affects the intertidal benthic community in the
         Dutch Wadden Sea. Previous studies have found contradicting results regarding the recovery
         rates of targeted and non-targeted macrozoobenthic species, and meiobenthic communities have
         been neglected in these studies. The current study explores the short-term effects of dredging on
         both the macrofaunal and the meiofaunal communities using both a morphological and molecular
         approach. Benthic samples were collected right before and regularly after dredging for up to
         1.5 yr at both control and fished transects. Significant differences between the control and fished
         transects were found by morphological and molecular approaches. Ordination analysis suggests
         distinct community compositions between control and fished transects in the first months after
         dredging. Opportunistic species with short life cycles, typically more than 1 generation yr−1,
         thrived more in the fished transects during the spring/summer season compared to these species
         in the control transects in the same season, whereas recovery for long-lived species was slow. Both
         approaches showed similar results; however, compared to the morphological approach, the
         molecular approach was more sensitive to the effects due to a larger set of benthic taxa.

         KEY WORDS: Anthropogenic effects · Metabarcoding · Intertidal · Lugworm dredging · 18S rDNA

                   1. INTRODUCTION                           et al. 2013, Christianen et al. 2017). On these mud-
                                                             flats, the lugworms Arenicola marina and, in smaller
   Intertidal soft-sediment systems provide wide-            numbers, A. defodiens, are widespread and domi-
ranging ecosystem services (Levin et al. 2001).              nant burrowing polychaetes that engineer the sedi-
Stretching across Dutch, German and Danish coast-            ments (Luttikhuizen & Dekker 2010). Adult speci-
lines, the Wadden Sea represents both the largest            mens grow up to 10−20 cm in length and can live up
and one of the last remaining relatively undisturbed         to 6 yr (Bijkerk & Dekker 1991). The lugworms live in
intertidal areas in the world and appears on                 a 20−40 cm deep U-shaped burrow with a funnel-
UNESCO’s list of world heritage sites. The Wadden            shaped shaft through which surface sediment slides
Sea is a shallow coastal region with large tidal flats       down. Sediment particles are ingested and are then
consisting of productive soft sediment. The ecosys-          defecated at the surface. This ecosystem engineer is
tem is mainly driven by benthic primary and second-          a known key species for the benthic mudflat commu-
ary production (Wolff & Binsbergen 1985, Compton             nity, as it is a major source of bioturbation and bio-
                                                              © The authors 2021. Open Access under Creative Commons by
*Corresponding author: lise.klunder@nioz.nl                   Attribution Licence. Use, distribution and reproduction are un-
                                                              restricted. Authors and original publication must be credited.
                                                              Publisher: Inter-Research · www.int-res.com
18                                       Mar Ecol Prog Ser 673: 17–28, 2021

irrigation on the intertidal mudflats of the Wadden            This study explored the short-term effects of
Sea (Volkenborn et al. 2007).                               mechanical lugworm dredging on benthic meio-
   Arenicola spp. are harvested by hand or mechani-         faunal and macrofaunal communities. Benthic and
cally in some areas as bait for sport fishing. Mechan-      sediment samples for grain size analysis were taken
ical dredging involves digging gullies (0.4 m deep,         before and after digging in fished and control (non-
1 m wide, 200−500 m long) at high tide. Dredged             impacted) sites. Species composition of the pre-
sediment is mixed with water and sieved to harvest          fishing and post-fishing samples was analysed by
the larger organisms; the smaller organisms are dis-        both morphological taxonomy and by using a mole-
carded in and around the gullies (van den Heiligen-         cular (metabarcoding) approach. The aims of the
berg 1987, Beukema 1995, Leopold & Bos 2009). This          study were to (1) examine whether mechanical Are-
mechanical lugworm dredging impacts benthic com-            nicola spp. dredging impacts the composition of ben-
munities, including lugworms as well as non-target          thic communities; (2) explore recovery rates of lug-
species. Lugworm biomass and abundance are lower            worm abundances and non-targeted fauna following
at dredging sites shortly after mechanical harvesting       dredging and (3) compare morphological and molec-
(van den Heiligenberg 1987). Different post-harvest         ular approaches in their abilities to detect biological
recovery rates for the lugworm Arenicola spp. as well       change and recovery following an anthropogenic
as for other macrozoobenthic species have been ob-          disturbance.
served (McLusky et al. 1983, van den Heiligenberg
1987, Beukema 1995). Effects of dredging on the
benthic communities could either result from the re-                  2. MATERIALS AND METHODS
location and disturbance of sediment and smaller
species or from the complete removal of lugworms in                           2.1. Field sampling
the dredged area. As the lugworm affects its sur-
roundings by bioturbation of the sediment, the                An experimental plot was created on tidal flats in
effects of completely removing this species extend          the western part of the Dutch Wadden Sea, Vlakte
beyond its absence and can be complicated. Volken-          van Kerken, north-east of the isle of Texel. The plot
born & Reise (2006) demonstrated a positive effect on       comprised 18 sampling stations, divided over 3
the biomass of several benthic species shortly after        control transects and 3 experimental transects (Fig. 1).
their removal. However, in the long-term, lugworm           All stations were sampled once before the experimen-
presence was proven to be essential for a sustainable       tal transects were fished by the company Arenicola
community (Volkenborn & Reise 2006, Volkenborn et           B.V. (T0) and another 16 times (T1−T16) after the dis-
al. 2007).                                                  turbance across a temporal range of 1.5 yr (Table 1).
   Research into the effects of lugworm dredging in         During each sampling event, all transects were pho-
the Wadden Sea have so far focused solely on macro-         tographed, and 3 cores were taken at each station:
zoobenthic species and have yielded contradicting           one larger core (177 m2 surface area, 25−30 cm depth)
results. Drent (2013) reported no differences in            for traditional morphological identification of macro-
macrozoobenthos between dredged areas and refer-            fauna and 2 smaller cores (5.60 cm2 area, 10 cm
ence areas at the Vlakte van Kerken, but at the Balg-       depth) for the molecular identification and grain size
zand area in the same tidal basin, Beukema (1995)           analysis, respectively. All cores were taken simulta-
found that the biomass in dredged areas only recov-         neously. We chose the current method of 3 separate
ered after several years. However, macrozoobenthos          cores rather than splitting them, as it applies fewer
might not be the most appropriate indicator for the         treatments to the sample which might introduce con-
effects of dredging on the benthic community. Meio-         tamination (Aylagas et al. 2016, Elbrecht et al. 2017).
fauna species are key species in the marine food web        Grain size analysis was performed following Compton
and are known to be good indicators of ecosystem            et al. (2013) and Klunder et al. (2019a).
health (Balsamo et al. 2012, Zeppilli et al. 2015). With
new metabarcoding techniques, it is now feasible to
expand the scope of such research on the impact of                    2.2. Morphological identification
lugworm dredging to also more easily incorporate
meiofauna. Including this part of the community               The macrofaunal communities of the intertidal
might provide better insight into the recovery rates of     Wadden Sea have been studied for decades within
the local benthic community as a whole and the pro-         our research group at NIOZ. Sampling strategies and
cesses that occur during recovery.                          morphological identification within this research
Klunder et al.: Impact of Arenicola dredging on benthic communities 19
cies retained in sieve were sorted by
hand and identified while alive by
experienced taxonomists based on
morphological characteristics accord-
ing to Hartmann-Schröder (1996) and
Hayward & Ryland (1995). Molluscs,
crustaceans and polychaetes were
identified to the genus level, whereas
Oligochaeta were identified to the
phylum level.
100 meters 2.3. Molecular identification
Prior to DNA extraction, extracellular
DNA was removed from the samples
by rinsing with a saturated phosphate
buffer (Na2HPO4; 0.12 M, pH ≈ 8). Sub-
sequently, the samples were cryodesic-
cated and ground in liquid nitrogen.
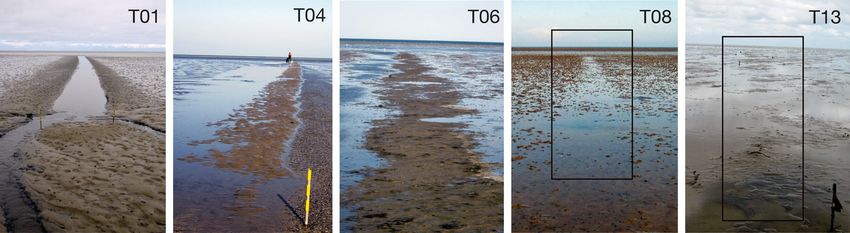
Fig. 1. Map of Texel and a graphical description of the sampling transects. DNA was extracted from 10 g of the ho-
Round sampling points represent the control transects, triangles represent the
mogenized sediments using the Power-
fished transects
max Soil™ DNA isolation kit (Qiagen).
The universal F04 and R22 primer pair
Table 1. Sampling codes and their corresponding sampling for the metazoan community (Sinniger et al. 2016) was
date. Arenicola fishing was executed between T00 and T01 used to amplify a 450 bp part of the 18S gene, and both
the forward and reverse primers were extended with
T code Date 12 nt unique barcodes for sample identification in the
(dd-month-yyyy) bioinformatics process. PCR amplifications were per-
formed in triplicate in a 50 μl reaction, containing
T00 20-mar-2016
T01 21-mar-2016 0.6 μM of each primer, 0.2 μM dNTP, 800 ng μl−1 BSA,
T02 31-mar-2016 1 U Phusion® High-Fidelity DNA Polymerase (Thermo
T03 05-apr-2016 Scientific), 1× Phusion® HF Buffer (Thermo Scientific)
T04 11-apr-2016 and 5 μl of DNA extract. The thermal cycle started with
T05 20-apr-2016
T06 09-may-2016 an initial cycle of 30 s at 98°C, followed by 27 cycles,
T07 23-may-2016 each comprising 10 s at 98°C, 20 s at 60°C and 30 s at
T08 06-jun-2016 72°C, followed by a single elongation step at 72°C for
T09 04-jul-2016 5 min. The PCR products were purified by both
T10 31-aug-2016
T11 14-nov-2016
excising 450 bp bands from a 1% agarose gel and the
T12 13-mar-2017 Qiaquick Gel Extraction Kit (Qiagen). The final
T13 09-may-2017 samples were quantified with a Qubit™ 3.0 fluorometer
T14 23-may-2017 (Qiagen) and pooled in equimolar quantities together
T15 06-jun-2017
with blank PCR controls. Amplicons were submitted for
T16 26-jun-2017
sequencing at Useq (Utrecht) on an Illumina MiSeq
using the 2× 300 bp V3 kit.
builds on the knowledge obtained throughout these
years (Beukema 1974, Beukema & Cadée 1997, 2.4. Bioinformatics
Beukema & Dekker 2012, Compton et al. 2013).
Samples for morphological identification were Raw sequences were quality filtered (≤ 30 score
washed in the field over a 1 mm mesh sieve. Sieve over 75% of the positions), de-replicated and clus-
residues were stored in a jar in a cool and dark place tered at a 98% similarity cut-off. Singleton clusters
and were processed within 36 h after sampling. Spe- were discarded and the remaining operational taxo-20 Mar Ecol Prog Ser 673: 17–28, 2021
nomic unit (OTU) clusters were taxonomically as- species. This homogeneity would hinder the FOO
signed using the RDP Classifier against the SILVA approach in detecting differences between fished
18S rRNA database (release 128; Pruesse et al. 2007) and control sites (Deagle et al. 2019). Both the count
and our local reference database (Genbank acces- data for the morphological approach and the RRA
sion numbers MZ709983–MZ710042). Taxonomic were Hellinger-transformed (Legendre & Gallagher
assignment was performed at a 0.8 and 0.5 minimum 2001), and dissimilarity distances were calculated
confidence threshold. OTUs identified as macro- using the Bray-Curtis equation. Benthic community
fauna taxa were extracted from the 0.8 data set; the composition was explored using multi-dimensional
rest were extracted from the 0.5 data set. Taxonomic- scaling (MDS) ordinations based on the dissimilarity
assigned OTUs were clustered at the genus level if distances. Subsequently, permutational multivariate
possible. If no genus-level assignment was possible, analysis of variance (PERMANOVA) was employed
higher level assignments were used. Raw Illumina to determine the effect of fishing on the benthic
sequences were deposited in the European Nucleo- community, and a SIMPER analysis was imple-
tide Archive (ENA accession number: PRJEB46793). mented to determine which taxa were responsible
for this effect.
All calculations, statistical analyses and data visu-
2.5. Data analysis alisations were performed in R version 3.5.2 (R Core
Team 2018).
The mud content was relatively stable between 0.8
and 1.2%; therefore, percentage silt was used as a
further measure for grain size analysis. Silt content 3. RESULTS
was compared between fished and control sites using
ANOVA, including the fished and control transect 3.1. Field observations
pairs as a random effect.
For the morphological approach, the abundance A selection of the photos taken of each transect
(counts) of each genus per sample was assessed. during the sampling events is shown in Fig. 2. A
Large variations were observed in the count data of dredged gully was visible in the experimental tran-
both Oligochaeta and Urothoe sp. Variations were sects immediately after mechanical dredging (T01).
related to observer and sampling bias, respectively The gullies filled quickly and were covered by a
and were removed from the community analysis. layer of diatoms in the first 2 mo (spring season) (T04
For the molecular approach, the relative read abun- and T06). The gullies remained visible as wet tran-
dance (RRA) data per OTU was used as a measure sects within the mudflats throughout the summer
of abundance. This transformation was chosen over season (T08). Although only vaguely visible in the
rarefaction as it preserves valid read abundance photograph, the layer of diatoms appeared again the
data (McMurdie & Holmes 2014, Lanzén et al. year after, in the spring season (T13). Unfortunately,
2016). Also, the RRA approach was chosen over a porosity of the sediment was not measured, but our
frequency of occurrence approach (FOO), as the observations described below are consistent with a
sampled environment was very homogeneous, re- difference in porosity between fished and control
sulting in over 90% presence for many abundant transects. All control transects consisted of solid sed-
Fig. 2. Photographs of the most southern fished transect taken at T01, T04, T06, T08 and T13, respectivelyKlunder et al.: Impact of Arenicola dredging on benthic communities 21
iment, whereas anecdotally, the sediment in the 3.2. Community analysis
fished transects felt looser during sampling from
T1−T13. No differences were observed after T13. It Benthic community composition was explored
was not possible to stand on the fished transects for using MDS ordinations based on the count data per
the entire first year of the study. The average per- taxon from the morphological approach and the RRA
centage of silt for all samples within either the con- for OTUs from the molecular approach (Figs. 4, S1 &
trolled or fished transects for each sampling event S2 in the Supplement at www.int-res.com/articles/
are shown in Fig. 3. Silt content was statistically cor- suppl/m673p017_supp.pdf). The ordinations from
related with treatment when time was considered in both approaches at T00 indicate no difference in
the formula (ANOVA, F1,16 = 2.02, p = 0.01). composition between the control and fished transects
7 Treatment Control Fished
6
Percentage of silt
5
4
3
T00 T01 T02 T03 T04 T05 T06 T07 T08 T09 T10 T11 T12 T13 T14 T15 T16
Time
Fig. 3. Sediment composition comparison between control and fished transects. Boxplots show percentage of silt for all sampling
points within 1 experimental setup. Shown in the boxplot are the median, lower and upper quartile in the boxes, and the dots
represent outliers
a) T00 T04 T06 T08 T13
0.4 0.6 0.6
0.2 0.3 0.4 0.2 0.5
0.2
0.0 0.0 0.0
0.0 0.0
−0.2 −0.3 −0.2
−0.2
−0.4 −0.6 −0.4 −0.4 −0.5
−0.5 0.0 0.5 −0.5 0.0 0.5 1.0 −0.6 −0.3 0.0 0.3 −0.6 −0.4 −0.2 0.0 0.2 0.4 −0.5 0.0 0.5
b) T00 T04 T06 T08 T13
0.4 0.4 0.4
0.3
0.2 0.2 0.2 0.2
0.2
0.1
0.0
0.0 0.0 0.0
0.0
−0.2 −0.1
−0.2 −0.2
−0.2
−0.2 −0.4
−0.25 0.00 0.25 0.50 −0.50 −0.25 0.00 0.25 0.0 0.5 −0.4 −0.2 0.0 0.2 −0.4 −0.2 0.0 0.2 0.4
Fig. 4. Selection of multi-dimensional scaling (MDS) ordinations based on the benthic community composition for the (a) mor-
phological approach and (b) molecular approach. Circles: control transects; triangles: fished transects. MDS ordinations for all
sampling events are shown in Figs. S1 & S222 Mar Ecol Prog Ser 673: 17–28, 2021
Table 2. Morphological and molecular analysis of benthic di- experimental fished transects, was significantly
versity. Results of permutational multivariate analysis of vari- lower in the fished transect (Wilcoxon, W = 10, p <
ance (PERMANOVA) analysis on multi-dimensional scaling-
0.005) (Figs. 5 & S3). Although the abundance of
ordinations for each sampling event. PERMANOVA analysis
tested for a difference in community composition between Arenicola sp. was already lower pre-fishing at T00,
control and fished transects. Significant effects (p ≤ 0.05) are this difference in abundance doubled between T03
shown in bold and T07. On the contrary, the abundance of juvenile
Arenicola was higher in the dredged transects than
Time Morphological Molecular in the control transects at all post-fishing sampling
F p F p times in the first year (Wilcoxon, W = 7.5, p < 0.005),
whereas their abundance was higher in the control
T00 2.1373 0.088 0.8460 0.886
T01 2.2356 0.038 2.1582 0.003 transects compared to the fished transects pre-
T02 1.2021 0.315 2.1408 0.007 dredging. This effect was still present in the second
T03 1.7589 0.099 1.6812 0.005 year (T14, T16) (Fig. S3). Other smaller taxa, such as
T04 1.8543 0.090 2.4205 0.001
Capitella sp. and Pygospio sp., were observed in
T05 2.1988 0.035 1.4550 0.046
T06 2.4038 0.046 1.4748 0.003 increased abundances within the fished transects
T07 2.3629 0.047 0.9647 0.502 (Wilcoxon, respectively, W = 16.5, p < 0.05 and Z =
T08 1.2927 0.245 1.0453 0.323 15, p < 0.05; Fig. S4). Both taxa varied most markedly
T09 0.7163 0.656 1.0732 0.254
T10 0.7189 0.621 0.8401 0.844
in their abundance between May and July in both
T11 0.4503 0.719 0.7161 0.965 the first and second years (respectively T6−T9 and
T12 0.4907 0.776 1.1266 0.209 T13−T16).
T13 0.4428 0.837 0.9007 0.662 With the molecular approach, OTUs assigned to
T14 0.9427 0.431 0.9241 0.604
T15 0.8886 0.550 0.9732 0.465
the phyla Nematoda, Arthropoda and Annelida con-
T16 1.4913 0.168 0.9941 0.404 tributed the most total number of reads (Figs. 6 &
S5−S7). Overall RRA within Phylum Nematoda was
lower for fished transects compared to control tran-
when assessed by PERMANOVA (Table 2). Signifi- sects (Wilcoxon, W = 25, p < 0.05). However, none of
cant differences in composition were found at T01, the taxonomic orders separately showed a significant
T05, T06 and T07 using the morphological approach decline. In the first 2 mo after fishing, Chromadorida
and from T01−T06 using the molecular approach. and Monhysterida had a lower RRA (T2−T5). RRAs of
SIMPER analysis for the samples in the morphologi- Araeolaimida were lower later in the summer in
cal approach suggested that the primary drivers for dredged transects compared to control transects
the difference at T01 were a higher abundance of (T5−T7). By contrast, RRA of all arthropod taxa, espe-
Scoloplos sp. in the fished transects and a lower abun- cially Podocopida, was higher in dredged transects
dance of Tharyx sp. Later, at T05, T06 and T07, a (Wilcoxon, respectively, W = 21, p < 0.05 and W = 0,
higher abundance of Capitella sp. and Pygospio sp. in p < 0.0005). Likewise, RRA of Annelida was highest
the fished transects was observed. For the molecular in the fished transects (Wilcoxon, W = 23, p < 0.05).
approach, Simper analysis suggested that differences Again, none of the taxa separately showed a signifi-
in community species composition were mainly due to cant difference; however, the RRA of Orbiniidae
meiofaunal taxa. At T01, higher RRA of the meiofauna (Scoloplos sp.) and Polynoidae were higher in the
arthropod taxa Podocopida and Harpacticidae was first 2 mo in dredged transects compared to control
observed. For T02−T06, lower RRA for several nema- transects.
tode taxa within the fished transects was the main
driver of the differences in community composition.
3.4. Morphological versus molecular approach
3.3. Taxonomic composition The molecular approach recovered a larger num-
ber of OTUs than the morphological approach,
Annelida taxa were the predominant taxa recov- respectively 98 versus 40. A large proportion of the
ered by the morphological approach, while arthro- extra OTUs detected were meiofaunal taxa (i.e.
pods (mostly Urothoe sp. and Crangon sp.) and mol- Nematoda, Platyhelminthes and small Arthropoda).
luscs (mostly Limecola sp.) were detected less However, from these 98 OTUs, 51 taxa were taxo-
frequently (Table S1). The abundance of adult speci- nomically assigned as macrofauna by the molecular
mens of Arenicola, the targeted species within the approach, 11 more than detected with the morpho-Klunder et al.: Impact of Arenicola dredging on benthic communities 23
a) Annelida large
T00 T04 T06 T08 T13
40
30 Arenicola adult
Arenicola juvenile
Count
20 Hediste
Lanice
Nephtys
10
Polynoidea
0
C F C F C F C F C F
b) Annelida small
T00 T04 T06 T08 T13
300
Aphelochaeta
Capitella
200
Eteone
Count
Heteromastus
Marenzelleria
100
Pygospio
Scoloplos
0
C F C F C F C F C F
Fig. 5. Morphological analysis of benthic biodiversity: selection of barplots based on abundance data for (a) larger and (b)
small Annelida genera or families. Barplots for all sampling events can be found in Figs. S3 & S4. C: control; F: fished; TXX:
sampling time point
logical approach. Benthic macrofauna taxa which 4. DISCUSSION
were not detected with the morphological approach
included Lagis sp. and Magallana sp. Both ap- The present study applied both a morphological
proaches demonstrated comparable patterns with and a metabarcoding approach to analyse the short-
respect to the effects of Arenicola spp. dredging. term effects of mechanical dredging for Arenicola
For instance, the higher abundance of Annelida in spp., a bioturbating lugworm, on the locally present
dredged transects compared to control transects in benthic community. Both methods indicated a slow
the first spring season (T6−T8) was comparable recovery of long-lived species after dredging com-
between the 2 methods. However, the outcomes of bined with an increased abundance of opportunistic
the morphological and molecular approaches were species in the first spring/summer seasons. In line
not comparable with respect to time and seasonal- with previous research (van den Heiligenberg 1987,
ity. The RRA for Annelida within the spring season Leopold & Bos 2009), the observed impact was
was lower than at the sampling times before, hypothesized as due to complete removal of lug-
whereas the total abundance in the morphological worms from the sediments as well as the physical
approach was higher than at the earlier sampling relocation and disturbance of the sediment. The com-
times. bined use of the 2 methodological approaches per-24 Mar Ecol Prog Ser 673: 17–28, 2021
a) Annelida
T00 T04 T06 T08 T13
Relative abundance of reads
Arenicolidae
10 Capitellidae
Nereididae
Oligochaeta
Orbiniidae
Other
5
Phyllodocidae
Polynoidae
Spionidae
Terebellidae
0
C F C F C F C F C F
b) Arthropoda
T00 T04 T06 T08 T13
Relative abundance of reads
Cumacea
30
Cytheruridae
Gammaridae
Harpacticidae
20
Harpacticoida sp.
Loxoconchidae
Other
10
Podocopida sp.
Tachidiidae
0
C F C F C F C F C F
c) Nematoda
T00 T04 T06 T08 T13
80
Relative abundance of reads
Araeolaimida
60
Chromadorea sp.
Chromadoria
40 Desmocolecida
Desmodorida
Enoplida
20 Mermithida
Monhysterida
0
C F C F C F C F C F
Fig. 6. Molecular analysis of benthic biodiversity: selection of barplots based on relative read abundance for (a) Annelida, (b)
Arthropoda and (c) Nematoda families or classes obtained via metabarcoding. Barplots for all sampling events can be found in
Figs. S5−S7. C: control; F: fished; TXX: sampling time pointKlunder et al.: Impact of Arenicola dredging on benthic communities 25
mits direct comparisons between the methods (Cow- (Newell et al. 1998). Within this study, an increased
art et al. 2015, Lejzerowicz et al. 2015). abundance of these opportunistic taxa, such as
Pygospio sp. and Capitella sp., was observed within
the first spring/summer season with the morphologi-
4.1. Effects of mechanical dredging cal approach as well as an increased RRA of Spi-
onidae and Capitellidae. These increased abun-
Mechanical dredging for Arenicola spp. caused dances shortly after dredging are consistent with
prominent digging tracks within the intertidal mud- predicted capacity for rapid recolonization (Savidge
flats. These tracks remained, although slightly visi- & Taghon 1988, Shull 1997, Newell et al. 1998). How-
ble, for at least 1.5 yr. Unfortunately, we do not have ever, the second spring/summer season also showed
records beyond that period. Grain size patterns were a higher abundance of these species in the fished
measured as percentage silt for both the tracks as well tracks compared to the control tracks. This oscillation
as the control transects. Silt content was relatively in species abundances during community succession
low, with percentages between 2.5 and 6.9% (Klun- has been shown before within the first 2 yr after
der et al. 2019a). Significant differences in grain size recolonization by Arntz & Rumohr (1982), who
patterns were measured between the control and reported that while oscillations were in phase with
fished samples. The percentage of silt fluctuated the seasonal oscillations, this only became normal-
more in the fished samples compared to the control ized in the third year.
samples, especially in the second year; an effect Recovery rates for long-lived and slow-growing
which has also been described after cockle dredging species, such as Arenicola, were slower compared
(Piersma et al. 2001). Benthic species are both influ- with other annelid taxa. Both count numbers of adult
enced by and influence (bioturbation) sediment char- specimens and the RRA for Arenicolidae were lower
acteristics. The removal of Arenicola spp., a taxon in the fished transects until 1.5 yr after dredging at
that contributes heavily to sediment bioturbation, nearly all sampling events. This trend of prolonged
might be the cause of the differing grain size patterns suppression of lugworm numbers after dredging was
measured, including the high porosity long after also observed in earlier studies (van den Heiligen-
dredging (Volkenborn et al. 2007). berg 1987, Beukema 1995). Moreover, higher recruit-
The most prominent differences in species compo- ment of juvenile specimens was observed in the fished
sition between the fished and control transects were transects (van den Heiligenberg 1987). With the molec-
found from April through July, the spring/summer ular approach, it is not (yet) possible to distinguish
season. MDS ordinations for both the morphological between juvenile and adult specimens; the RRA is a
and molecular approaches showed significant differ- rough measure of biomass (Lamb et al. 2019). Adult
ences in community composition in April and May of specimens contribute more to the total biomass than
the first year following dredging, whereas trends in juvenile specimens. Therefore, RRA will be biased
abundances for both approaches also showed differ- based on the relative body size of adults compared to
ences from April through July in the second year. juveniles.
Life cycles of intertidal marine benthic species in Explanations for differences in recovery rates
temperate areas, such as the Wadden Sea, are and colonization mechanisms have been discussed
known to follow distinct seasonal patterns, which for widely, with both passive and active transport
most species include hibernation in winter and in- mechanisms and recruitment proposed (e.g. Arntz
creased activity in spring/summer due to higher & Rumohr 1982, Savidge & Taghon 1988, Shull
availability of food resources (Beukema 1974, Coma 1997, Newell et al. 1998). Taxa with larval recruit-
et al. 2000). The largest differences in community ment (e.g. Capitella sp.) and mobile taxa (e.g.
composition and species abundances for both years Pygospio sp. and Podocopida) are able to rapidly
were found within the spring/summer season — the colonize a disturbed area (Savidge & Taghon 1988,
season with increased activity — suggesting recovery Shull 1997). Once settled, these taxa grow and re-
rates within the disturbed environment are influ- produce quickly due to the absence of competition
enced by the spring/summer activity of the species with larger bodied, slow-growing taxa (Newell et
present (Arntz & Rumohr 1982). al. 1998). These opportunistic taxa have versatile
The taxa studied within this experiment showed reproductive strategies which allows for rapid
different recovery rates; taxa adapted to rapid colo- recolonization. For instance, Pygospio sp. is able to
nization — opportunistic species — can recover more reproduce both sexually and asexually in different
quickly than long-lived and slow-growing species seasons (Gudmundsson 1985).26 Mar Ecol Prog Ser 673: 17–28, 2021
Field observations and photographs in the present difference in these outcomes could be due to a differ-
study suggest a high abundance of diatoms within ence in sampling effort (Anderson & Santana-Garcon
the fished transects during spring. Although diatom 2015).
layers are observed naturally on the mudflats (Scholz All taxa detected with the morphological approach
& Liebezeit 2012), the diatom layers on the dredged were also detected at the family level with the molec-
gullies were clearly visible, whereas these layers ular approach. However, relative quantities between
were not visible in the surrounding area and control the taxa differed. For Annelida, Capitella sp. was the
transects. This high observed abundance is possibly most abundant taxon detected in the first spring−
related to higher nutrient availability in the fished summer season in the morphological data; however,
transects compared to the control transects, resulting RRA of Capitellidae was low compared to other
from decaying organisms and/or increased sediment Annelida families. Possible explanations for this are
oxidation. This in turn might contribute to increased that the RRA is more directly related to biomass than
spring−summer benthic invertebrate abundance in species counts (Lamb et al. 2019), and the amount of
these fished transects (Newell et al. 1998). Especially DNA found in the sediment is highly influenced by
meiofauna taxa such as Desmodorida and Podocop- ecological factors, such as seasonality or tidal move-
ida demonstrated a rapid increase in RRA directly ments, driving the release and dispersal of DNA
after dredging; possibly advancing from higher food (Barnes & Turner 2016, Stewart 2019). Nevertheless,
availability (Boyd et al. 2000). patterns observed for most taxa are comparable
between the 2 methods. For example, a lower abun-
dance of adult Arenicola spp., Capitella sp. or Pygos-
4.2. Comparison between methods pio sp. in either fished or control transects in the mor-
phological approach is reflected in a lower RRA of,
Both approaches demonstrated a significant effect respectively, Arenicolidae, Capitellidae or Spionidae
of Arenicola spp. fishing. However, there was a dif- in the same transects in the molecular approach.
ference regarding the time-range in which this effect
was found. The molecular approach detected an
effect slightly earlier in the sampling scheme than 4.3. Concluding remarks
the morphological approach. The most obvious rea-
son for this difference would be the difference in The impacts of mechanical dredging for Arenicola
communities sampled (Elbrecht et al. 2017, Klunder spp. were found to last at least 1.5 yr after dredging
et al. 2019b). The meiofaunal community was in- at the fished transects. Small opportunistic taxa were
cluded with the molecular approach but was not observed to thrive during their known reproductive
studied using the morphological approach. The ear- season in spring−summer within the fished transects,
lier response observed with the molecular approach whereas large-bodied, long-lived taxa showed lower
might be due to an earlier detection of larvae and/or abundance after fishing. Both the morphological
juvenile specimens from macrofauna taxa before the approach and the molecular approach detected these
morphological approach was able to detect them, as changes but the power of the latter appeared to be
these larvae or small juveniles would have been larger.
washed through the sieve. Another possible explana-
tion could be the more rapid response by true meio-
Acknowledgements. We thank Arenicola B.V. for providing
faunal taxa such as Nematoda and small Arthropoda us with an experimental field and Natuurmonumenten for
because of their shorter life cycles and reproductive permission to sample. Also, we are grateful to all the staff
strategies (Boyd et al. 2000, Balsamo et al. 2012, Fon- and students, and in particular Rowan Stavast, who helped
seca et al. 2014). A third possible explanation is the collect our field samples, sort them in the benthic lab, and
power of the PERMANOVA analysis. A larger num- process them in the molecular lab. We thank Simone Miguel
for her help in the silt content analysis.
ber of OTUs was obtained with the molecular ap-
proach, reflecting a larger sampling effort, hence
more power for the multivariate analysis (Anderson LITERATURE CITED
& Santana-Garcon 2015). The p-values derived from
the PERMANOVA analysis for the morphological Anderson MJ, Santana-Garcon J (2015) Measures of preci-
sion for dissimilarity-based multivariate analysis of eco-
approach at T03 and T04 (Table 2) were non-signifi- logical communities. Ecol Lett 18:66−73
cant, but still relatively low, whereas the molecular Arntz WE, Rumohr H (1982) An experimental study of macro-
approach showed a significant effect. Therefore, the benthic colonization and succession, and the importanceKlunder et al.: Impact of Arenicola dredging on benthic communities 27 of seasonal variation in temperate latitudes. J Exp Mar Hartmann-Schröder G (1996) Annelida, Borstenwürmer, Biol Ecol 64:17−45 Polychaeta. 2nd revised edn. Die Tierwelt Deutschlands Aylagas E, Mendibil I, Borja A, Rodriquez-Ezpeleta N (2016) und der angrenzenden Meeresteile nach ihren Merk- Marine sediment sample pre-processing for macroinver- malen und nach ihrer Lebensweise, Vol 58. Gustav tebrates metabarcoding: mechanical enrichment and Fisher, Jena homogenization. Front Mar Sci 3:1–8 Hayward P, Ryland J (eds) (1995) Handbook of the marine Balsamo M, Semprucci F, Frontalini F, Coccioni R (2012) fauna of north-west Europe. Oxford University Press, Meiofauna as a tool for marine ecosystem biomonitoring. Oxford In: Cruzado A (ed) Marine ecosystems. InTechOpen, Klunder L, Lavaleye M, Kleine Schaars L, Dekker R, London, p 77−104 Holthuijsen S, van der Veer HW (2019a) Distribution of Barnes MA, Turner CR (2016) The ecology of environmental the dwarf surf clam Mulinia lateralis (Say, 1822) in the DNA and implications for conservation genetics. Con- Wadden Sea after first introduction. BioInvasions Rec 8: serv Genet 17:1−17 818−827 Beukema JJ (1974) Seasonal changes in the biomass of the Klunder L, Duineveld GCA, Lavaleye MSS, van der Veer macro-benthos of a tidal flat area in the Dutch Wadden HW, Palsbøll PJ, van Bleijswijk JDL (2019b) Diversity of Sea. Neth J Sea Res 8:94−107 Wadden Sea macrofauna and meiofauna communities Beukema JJ (1995) Long-term effects of mechanical har- highest in DNA from extractions preceded by cell lysis. vesting of lugworms Arenicola marina on the zoobenthic J Sea Res 152:101764 community of a tidal flat in the Wadden Sea. Neth J Sea Lamb PD, Hunter E, Pinnegar JK, Creer S, Davies RG, Tay- Res 33:219−227 lor MI (2019) How quantitative is metabarcoding: a Beukema JJ, Cadée GC (1997) Local differences in macro- meta-analytical approach. Mol Ecol 28:420−430 zoobenthic response to enhance food supply caused by Lanzén A, Lekang K, Jonassen I, Thompson EM, Troedsson mild euthropication in a Wadde Sea area. Food is only C (2016) High-throughput metabarcoding of eukaryotic locally a limiting factor. Limnol Oceanogr 42:1424–1435 diversity for environmental monitoring of offshore oil- Beukema JJ, Dekker R (2012) Estimating macrozoobenthic drilling activities. Mol Ecol 25:4392−4406 species richness along an environmental gradient: sam- Legendre P, Gallagher ED (2001) Ecologically meaningful ple size matters. Estuar Coast Shelf Sci 111:67–74 transformations for ordination of species data. Oecologia Bijkerk R, Dekker PI (1991) De wadpier Arenicola marina 129:271−280 (Polychaeta). Ecologisch profiel. Waterstaat, Haren Lejzerowicz F, Esling P, Pillet L, Wilding TA, Black KD, Boyd SE, Rees HL, Richardson CA (2000) Nematodes as sen- Pawlowski J (2015) High-throughput sequencing and sitive indicators of change at dredged material disposal morphology perform equally well for benthic monitoring sites. Estuar Coast Shelf Sci 51:805−819 of marine ecosystems. Sci Rep 5:13932 Christianen MJA, Middelburg JJ, Holthuijsen SJ, Jouta J Leopold MF, Bos OG (2009) Duurzaamheid van de mecha- and others (2017) Benthic primary producers are key to nische wadpierenvisserij in de Waddenzee. Rapport sustain the Wadden Sea food web: stable carbon isotope C013/09. IMARES, Texel analysis at landscape scale. Ecology 98:1498−1512 Levin LA, Boesch DF, Covich A, Dahm C and others (2001) Coma R, Ribes M, Gili JM, Zabala M (2000) Seasonality The function of marine critical transition zones and the in coastal benthic ecosystems. Trends Ecol Evol 15: importance of sediment biodiversity. Ecosystems 4: 448−453 430−451 Compton TJ, Holthuijsen S, Koolhaas A, Dekinga A and oth- Luttikhuizen PC, Dekker R (2010) Pseudo-cryptic species ers (2013) Distinctly variable mudscapes: distribution Arenicola defodiens and Arenicola marina (Polychaete: gradients of intertidal macrofauna across the Dutch Arenicolidae) in Wadden Sea, North Sea and Skagerrak: Wadden Sea. J Sea Res 82:103−116 morphological and molecular variation. J Sea Res 63: Cowart DA, Pinheiro M, Mouchel O, Maguer M and others 17−23 (2015) Metabarcoding is powerful yet still blind: a McLusky DS, Anderson FE, Wolfe-Murphy S (1983) Distri- comparative analysis of morphological and molecular bution and population recovery of Arenicola marina and surveys of seagrass communities. PLOS ONE 10: other benthic fauna after bait digging. Mar Ecol Prog Ser e0117562 11:173−179 Deagle BE, Thomas AC, McInnes JC, Clarke LJ and others McMurdie PJ, Holmes S (2014) Waste not, want not: why (2019) Counting with DNA in metabarcoding studies: rarefying microbiome data is inadmissible. PLOS Com- How should we convert sequence reads to dietary data? put Biol 10:e1003531 Mol Ecol 28:391−406 Newell RC, Seiderer LJ, Hitchcock DR (1998) The impact of Drent J (2013) Monitoring van effecten op de bodemfauna dredging works in coastal waters: a review of the sensi- door wadpierenvisserij op de Vlakte van Kerken in de tivity to disturbance and subsequent recovery of biologi- periode 2008−2011. NIOZ, Texel cal resources on the sea bed. Oceanogr Mar Biol Annu Elbrecht V, Peinert B, Leese F (2017) Sorting things out: Rev 36:127−178 assessing effects of unequal specimen biomass on DNA Piersma T, Koolhaas A, Dekinga A, Beukema JJ, Dekker R, metabarcoding. Ecol Evol 7:6918−6926 Essink K (2001) Long-term indirect effects of mechanical Fonseca VG, Carvalho GR, Nichols B, Quince C and others cockle-dredging on intertidal bivalve stocks in the Wad- (2014) Metagenetic analysis of patterns of distribution den Sea. J Appl Ecol 38:976−990 and diversity of marine meiobenthic eukaryotes. Glob Pruesse E, Quast C, Knittel K, Fuchs BM and others Ecol Biogeogr 23:1293−1302 (2007) SILVA: a comprehensive online resource for Gudmundsson H (1985) Life history patterns of polychaete quality checked and aligned ribosomal RNA sequence species in the family Spionidae. J Mar Biol Assoc UK 65: data compatible with ARB. Nucleic Acids Res 35: 93–111 7188−7196
28                                             Mar Ecol Prog Ser 673: 17–28, 2021

R Core Team (2018) R: a language and environment for sta-         van den Heiligenberg T (1987) Effects of mechanical and
   tistical computing. R Foundation for Statistical Comput-          manual harvesting of lugworms Arenicola marina L. on
   ing, Vienna                                                       the benthic fauna of tidal flats in the Dutch Wadden Sea.
Savidge WB, Taghon GL (1988) Passive and active compo-               Biol Conserv 39:165−177
   nents of colonization following two types of disturbance       Volkenborn N, Reise K (2006) Lugworm exclusion experi-
   on intertidal sandflat. J Exp Mar Biol Ecol 115:137−155           ment: responses by deposit feeding worms to biogenic
Scholz B, Liebezeit G (2012) Microphytobenthic dynamics in           habitat transformations. J Exp Mar Biol Ecol 330:
   a Wadden Sea intertidal flat — Part I: seasonal and spa-          169−179
   tial variation of diatom communities in relation to macro-     Volkenborn N, Hedtkamp SIC, van Beusekom JEE,
   nutrient supply. Eur J Phycol 47:105−119                          Reise K (2007) Effects of bioturbation and bioirriga-
Shull DH (1997) Mechanisms of infaunal polychaete disper-            tion by lugworms (Arenicola marina) on physical and
   sal and colonization in an intertidal sandflat. J Mar Res         chemical sediment properties and implications for
   55:153−179                                                        intertidal habitat succession. Estuar Coast Shelf Sci
Sinniger F, Pawlowski J, Harii S, Gooday AJ and others               74:331−343
   (2016) Worldwide analysis of sedimentary DNA reveals           Wolff WJ, Binsbergen MA (1985) The ecology of the Wad-
   major gaps in taxonomic knowledge of deep-sea ben-                den Sea: Vol 1–3. A.A. Balkema, Rotterdam
   thos. Front Mar Sci 3:92                                       Zeppilli D, Sarrazin J, Leduc D, Arbizu PM and others
Stewart KA (2019) Understanding the effects of biotic and            (2015) Is the meiofauna a good indicator for climate
   abiotic factors on sources of aquatic environmental DNA.          change and anthropogenic impacts? Mar Biodivers 45:
   Biodivers Conserv 28:983−1001                                     505−535

Editorial responsibility: Rochelle D. Seitz,                      Submitted: December 23, 2020
 Gloucester Point, Virginia, USA                                  Accepted: July 1, 2021
Reviewed by: W. Ferreira Magalhães and                            Proofs received from author(s): August 25, 2021
 1 anonymous referee
You can also read