IMPACT ON EUROPEAN AVIATION - COVID 19 EUROCONTROL Comprehensive Assessment
←
→
Page content transcription
If your browser does not render page correctly, please read the page content below
4 March 2021

COVID 19
IMPACT ON                      EUROCONTROL
                               Comprehensive Assessment

EUROPEAN AVIATION

SUPPORTING EUROPEAN AVIATION                              1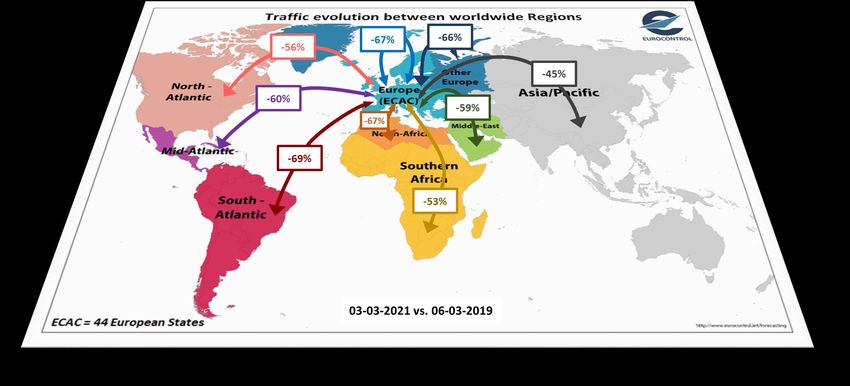
Traffic Situation
Headlines Daily flights (including overflights)
Traffic on Wed 03 March 2021 is
9,740 flights (35% of 2019 levels) on Wednesday 3 March 2021.
February traffic increasing within Network over 2 weeks (+7%, +670 flights).
6 big States over +10%
Positive steady trend over the last three weeks.
All cargo (+8% vs 2019). DHL Express is 4th. No Low cost carriers in the top 10.
65%
>
Compared to
equivalent day
in 2019
Just above the traffic scenarios
published on 24 January 2021
Domestic traffic: Europe (-67%), China (-4%), Middle East (-44%).
6% over 2 weeks
Top 10 Aircraft Operators 1. Operated 615 flights
Top 10 Busiest States
on Wed 03 March 2021 (daily flights) 51%
of same day in 2019 on Wed 03 March 2021
6% over 2 weeks (Dep/Arr flights and variation over 2 weeks)
6% over 2 weeks 28% over
Operated 2 weeks
319 flights
16%
1800
2. Operated 360 flights
3. Operated 319 flights
4. Operated 278 flights +12%
67%
of same day in 2019
16%
of same day in 2019
3%
of same day in 2019
1600
1400
+0%
1% over 2 weeks 2% over 2 weeks 0% over 2 weeks +10%
11% over
Operated 522flights
weeks 10% over
Operated 2 weeks
117 flights 15% over
Operated 952flights
weeks 1200
+8% +13%
5. 96%
Operated 249 flights
38%
6. 77%
Operated 244 flights
64%
7. 53%
Operated 195 flights
87%
1000
800
+8% +13%
of same day in 2019 of same day in 2019 of same day in 2019
600 +10%
10% over 2 weeks 15% over 2 weeks 11% over 2 weeks
10% over
Operated 2 weeks
181 flights 1% over
Operated 2 weeks
195 flights 9% over
Operated
2 weeks
249 flights 400 +5% +38%
8. 24%
Operated 181 flights
9. 87%
Operated 155 flights
10.
38%
Operated 148 flights
1.666
1.503
1.204
24% 84% 25% 200
984
977
815
773
525
331
281
of same day in 2019 of same day in 2019 of same day in 2019 0
3% over 2 weeks 34% over 2 weeks 25% over 2 weeks
Operated 84 flights Operated 102 flights Operated 56 flights
2
2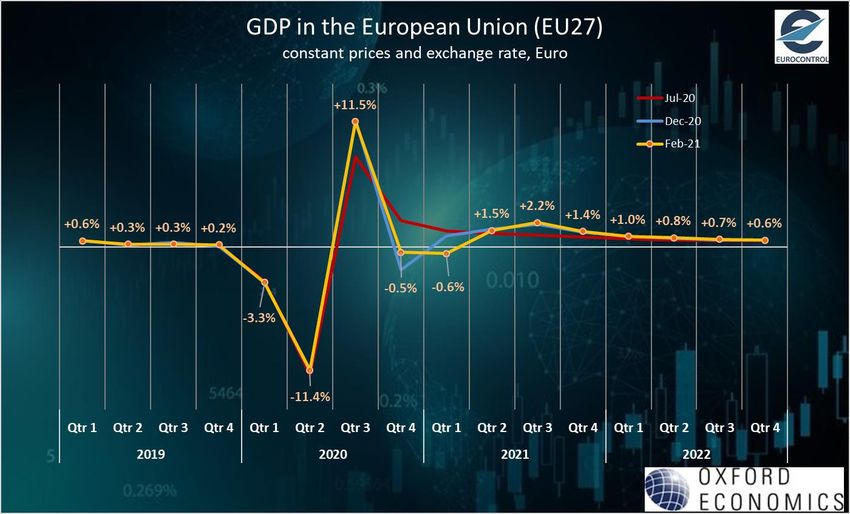
Top 10 Busiest Airports                                                                   Market Segments
  7-day average daily Dep/Arr flights on 3 March, compared to 2019                         On 3 March, daily flights compared to 2019
                           Average per rolling week   Average per rolling week
         Top 10 Airports

IGA Istanbul Airport
                                (25/02-03/03)
                                     512
                                                       (25/02-03/03) vs 2019
                                                      Not yet in operation in early 2019             87%Low cost
                                                                                                                                    71%
                                                                                                                                    Traditional
                                                                                                                                                           21%
                                                                                                                                                            Business
Paris/Charles-De-Gaulle              448                           -65%
                                                                                                                                                            Aviation
Amsterdam                            436                           -67%

                                                                                                                     3%
Frankfurt                            410                           -70%
Madrid/Barajas
Istanbul/Sabiha Gokcen
                                     357
                                     351
                                                                   -68%
                                                                   -40%                                            Non-Scheduled/
                                                                                                                                                     8%
                                                                                                                                                     All Cargo
                                                                                                                      Charter
London/Heathrow                      304                           -76%
Oslo/Gardermoen                      200                           -71%
Athens                               184                           -59%
Leipzig/Halle                        178                           -10%                    Economics                                 Passengers
                                                                                           (26 February 2021)                        (12 February 2021)

Traffic Flow                                                                               Fuel price
                                                                                                                                     1 million pax
                                                                                                165
On 3 March, the intra-European traffic flow was

                                                                                                                                       -4.8 million
7,111     +10% -67%              over past 2 weeks            compared to 2019
                                                                                                 Cents/gallon                                     Vs. 2019
                                                                                                                                              (-82%)
  flights                                                                                        compared to 161 cents/gallon
                                                                                                                 on 19 Feb 21
                                                                                                           Source: IATA/Platts                              Source: ACI
                                                                                                                                                                          3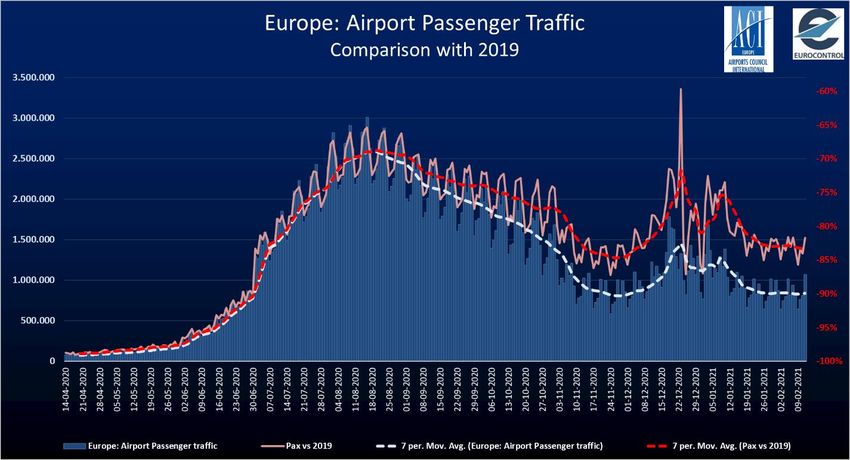
Overall traffic situation at network level

   9,740 flights on Wednesday
   3 March

   +7% with +670 flights over 2
   weeks (Wednesday 17
   February).

   35% of 2019 traffic levels.

                                             SUPPORTING EUROPEAN AVIATION   4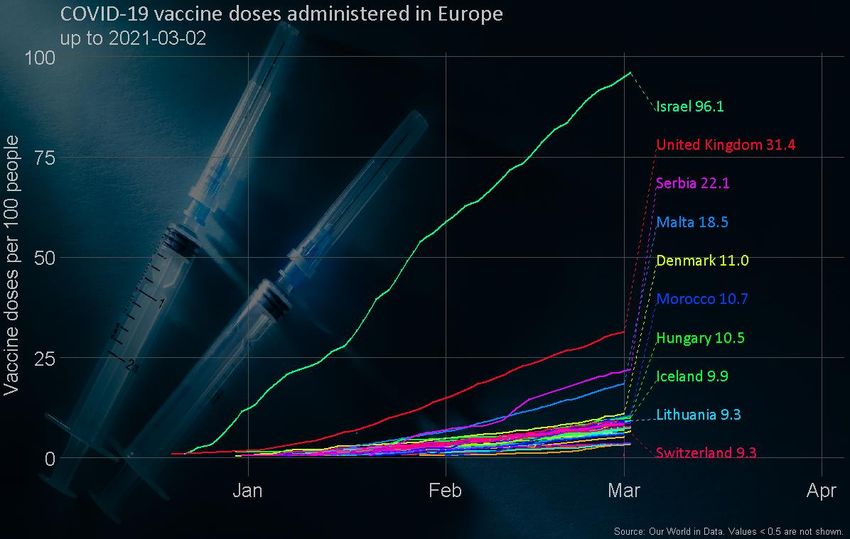
Current situation and scenarios

    Traffic at -65% on a rolling average over 7 days, slightly above
    the latest EUROCONTROL traffic scenarios published on 28
    January 2021 mainly due to:                                                     After having reached a minimum at network level in the 2nd
    •   Very active cargo traffic.                                                  week of February, the traffic is showing a positive steady
    •   Higher number of operations for top airlines than anticipated.              trend over the last three weeks.

 Note that a significant proportion of flight operations for some of the largest
 airlines are actually non-commercial, i.e. training flights and circular flights
 to maintain pilot ratings

                                                                                                                 SUPPORTING EUROPEAN AVIATION    5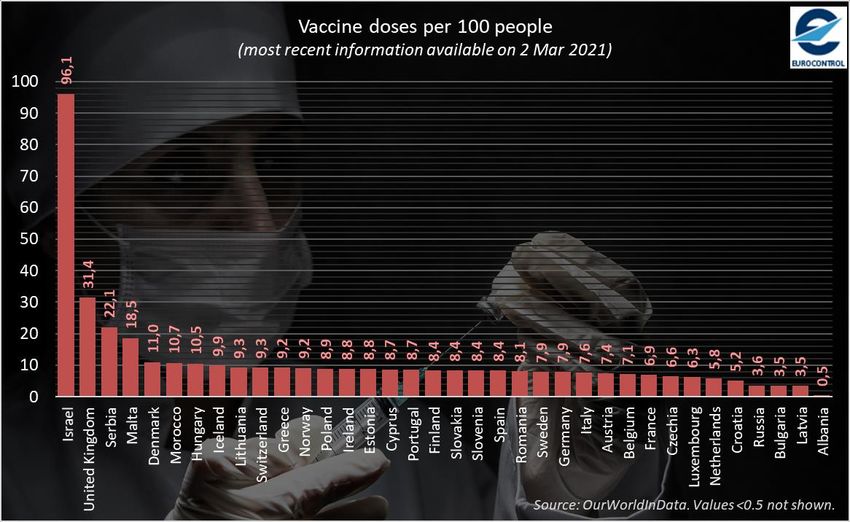
Aircraft operators (Daily flights)
Top 10
                                                                                                     Stability of the ranking.
    Rank                       Top 10   Aircraft Operators on Wed 03-03-2021
  evolution                                                                                          Lufthansa replacing
                                                             D over 2   % over 2
over 2 weeks Aircraft Operator             Dep/Arr Flights                         % vs 2019         Qatar on the 7th rank
                                                              weeks      weeks
            TURKISH AIRLINES               615                 +37        +6%        -51%
                                                                                                     and SAS replacing
            AIR FRANCE                     360                  +3        +1%        -67%            Bristow on the 9th.
            WIDEROE                        319                  -5        -2%        -16%
                                                                                                     2-digit increase for
            DHL EXPRESS                    278                  -1        -0%        +3%
            PEGASUS HAVA TASI.             249                 +22        +10%       -38%
                                                                                                     Pegasus, KLM,
            KLM ROYAL DUTCH AIRL           244                 +32        +15%       -64%
                                                                                                     Lufthansa, SAS and
            DEUTSCHE LUFTHANSA             195                 +20        +11%       -87%            Bristow.
            QATAR AIRWAYS COMP.            181                  +5        +3%        -24%
            SCANDINAVIAN AIRLINES SYSTEM   155                 +39        +34%       -84%
            BRISTOW NORWAY AS              148                 +30        +25%       +25%

                                                                                               SUPPORTING EUROPEAN AVIATION   6
Aircraft operators (Daily flights)
Top 40 – Latest operations

4 freight carriers within the top 40.
British Airways 14th, Ryanair 17th, easyJet 35th and Wizz Air 36th.

                                                                      SUPPORTING EUROPEAN AVIATION   7
Aircraft operators
Latest news
   European airlines                                               IAG reports 2020 net loss of €6.9Bn.
                                                                   Turkish Airlines reports a net loss of $836M in 2020; passenger
   KLM, which recently increased its firm order for Embraer
                                                                   revenue fell 66% while cargo revenue increased by 61%.
   E195-E2 aircraft from 21 to 25, receives its first of these
   aircraft for KLM Cityhopper.                                    Ryanair reports that it handled 0.5M passengers in February, a
                                                                   year-on-year decrease of 95%.
   Brussels Airlines sets out plans for 78 destinations this
   summer, with a focus on leisure destinations but also
   including a new route to Frankfurt.                            Worldwide airlines
   easyJet prices €1.2Bn of 2028 bonds at 1.875%, rated
   Baa3/BBB- and fully subscribed.                                 Aeroflot Group passenger numbers down 43% in January
                                                                   (domestic -8%, international -86%).
   Norwegian reportedly reaches agreement to cancel order
   for 88 A320neo aircraft; reports net loss for 2020 of NOK       Thai Airways reports for 2020 passenger numbers were 76%
   23Bn (€2.2Bn).                                                  down and cargo was 72% down; reports net loss of THB
   Condor will charter Boeing 767 cargo capacity to DHL            141,180M (€3.8Bn).
   Express.                                                        Emirates resumes Sao Paulo to Dubai flights but only for
   SWISS expects to be able to return operations to around         onward connecting passengers; launches a new economy
   65% of 2019 levels during 2021Q3.                               product allowing passengers to book up to three additional
   SAS reports that it has phased out five Boeing 737 and taken    seats to increase privacy/social distancing.
   delivery of three A320neo aircraft.
                                                                                                 SUPPORTING EUROPEAN AVIATION        8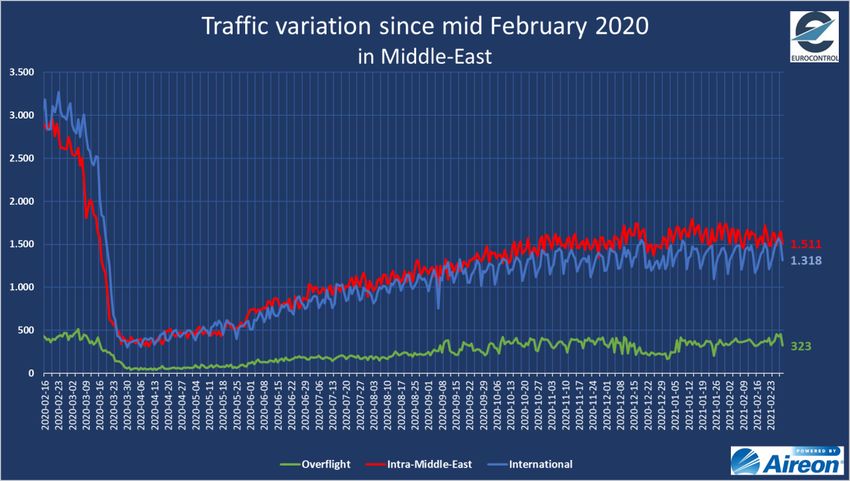
States (Daily Departure/Arrival flights)
Top 10
                                                                               Germany takes back the first
    Rank                      Top 10 States on Wed 03-03-2021                  rank.
  evolution
                                                         D over 2   % over 2   2-digit increase for Poland,
over 2 weeks State                   Dep/Arr Flights
                                                          weeks      weeks     UK, Italy, Germany, Turkey,
             Germany                  1666                 +173       +12%     Netherlands.
             France                   1503                   +3       +0%
             Turkey                   1204                 +110       +10%
                                                                               Stability for France.
             Spain                    984                   +73       +8%
             United Kingdom           977                  +115       +13%
             Norway                   815                   +58       +8%
             Italy                    773                   +89       +13%
             Netherlands              525                   +47       +10%
             Switzerland              331                   +15       +5%
             Poland                   281                   +77       +38%

                                                                               SUPPORTING EUROPEAN AVIATION   9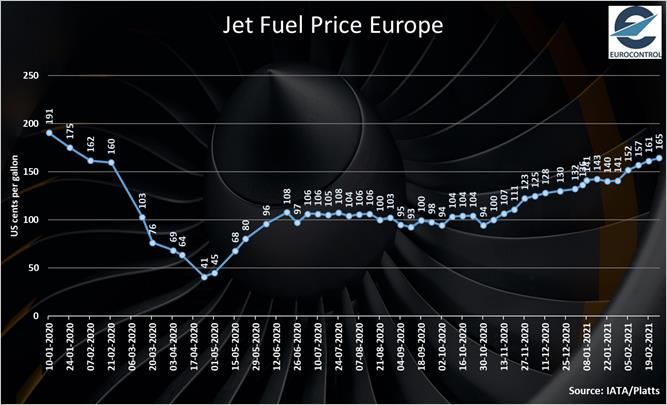
States (Daily Departure/Arrival flights)
Latest traffic situation

On 3 March 2021, traffic levels per States record declines ranging from -84% (Portugal)
to -43% (Bosnia-Herzegovina), compared to same day in 2019.

                                                                                          SUPPORTING EUROPEAN AVIATION   10
Industry & Associations
Latest news
Airbus estimates that the 863 aircraft it delivered in 2019 will emit
740 million tonnes of CO2 over the next 22 years – 66.6 grams of
CO2 per passenger kilometer.
IATA analysis is that airlines will remain cash negative throughout
2021, burning through $75-95 billion; reports that European
airlines are expected to take delivery of 352 aircraft in 2021,
compared with 193 in 2020.
ICAO appoints Juan Carlos Salazar as its new Secretary General.
SUPPORTING EUROPEAN AVIATION 11Traffic flows (Daily Departure/Arrival flights)
The main traffic flow is the intra-Europe flow with 7,170 flights on
Wednesday 3 March, which is increasing (+7%) over 2 weeks.
Intra-Europe flights are at -67% compared to 2019 while
intercontinental flows are at -59%.
SUPPORTING EUROPEAN AVIATION 12Country pairs (Daily Departure/Arrival flights)
Top 10
9 of the top 10 flows
Rank Top 10 Country-Pair on Wed 03-03-2021 are domestic.
evolution
∆ over 2 % over 2
over 2 weeks Country-Pair Dep/Arr Flights % vs 2019 All but 2 top domestic
week week
France France 714 -42 -6% -37%
flows showed an
Norway Norway 672 +56 +9% -29%
increase over 2 weeks,
Turkey Turkey 573 +61 +12% -37%
in particular Germany
Germany Germany 492 +85 +21% -55%
(+21%), Italy (+14%),
Spain Spain 480 +21 +5% -58%
Turkey (+12%) and UK
United Kingdom United Kingdom319 +31 +11% -70%
(+11%).
Italy Italy 317 +40 +14% -57% The German domestic
Greece Greece 154 -17 -10% -42% flow replaced the
Sweden Sweden 140 +3 +2% -71% Spanish flow in the 4th
France Germany 108 +17 +19% -70% rank.
SUPPORTING EUROPEAN AVIATION 13Country pairs (Daily Departure/Arrival flights)
Latest traffic situation
The busiest non-
domestic flows were
France-Germany (108
flights), UK-US (98
flights) and flows
from Germany to Italy
(85), US (83), UK (81)
and Spain (81).
SUPPORTING EUROPEAN AVIATION 14Outside Europe
USA
Peak in COVID-19 cases was reached early
January in the US but declined steadily since
(number of new cases). Air travel demand
remains severely depressed but could pick US Domestic flights: -43%
up meaningfully as vaccination rates and
travel restrictions are loosened.
Worldwide departures:
US domestic recorded a decline of 43% (vs -43% below 2019 levels
2019) and international traffic recorded a
decline of 43% (vs 2019) on 2 March. US International flights: -43%
On 2 March, US airline passenger volumes
were 58% below 2019 levels with domestic
down 56% and international down 69%.
The domestic US load factor averaged 60%
in most recent weeks vs 83% a year earlier.
SUPPORTING EUROPEAN AVIATION 15Outside Europe
Middle East China
Intra-Middle-East traffic stabilised just above 1,500 daily flights on 2 Chinese domestic flights recorded a huge drop on Chinese New Year (12
March (-44% compared to Feb 2019). Feb) but have rebounded since with 11,457 flights on 2 March. Recent
domestic levels are edging closer to the pre-COVID levels (only -4%
International traffic is at 1,318 flights (-57% compared to Feb 2019). compared to 1 Jan 2019).
Overflights are stable around 323 flights (-20% compared to Feb 2019). International flights have been recently increasing with 1,306 flights
(-68% compared to 1 Jan 2019). The same is true for overflights with 529
flights (-67% compared to 1 Jan 2019).
SUPPORTING EUROPEAN AVIATION 16Airports (Daily Departure/Arrival flights)
Top 10 and latest news
Heathrow Airport reports a pre-tax loss of £2
Rank Top 10 Airports on Wed 03-03-2021 billion for 2020; reports liquidity of £3.9
evolution billion.
D over 2 % over 2
over 2 weeks Airport Dep/Arr Flights
weeks weeks Aena reports a net loss of €127 million for
IGA Istanbul Airport 525 +31 +6% 2020; announces landing charge incentive
Paris/Charles-De-Gaulle 450 +4 +1% package for summer 2021.
Amsterdam 409 +21 +5% Tokyo Narita Airport reports passenger
Frankfurt 388 +48 +14% numbers in January down 93% (domestic -
Madrid/Barajas 348 +16 +5% 78%, international -96%).
Istanbul/Sabiha Gokcen 338 +26 +8%
Mumbai Airport reports January passenger
London/Heathrow 305 +51 +20%
numbers down 60% year on year (domestic -
Cologne/Bonn 229 +24 +12%
49%, international -86%).
Leipzig/Halle 214 -23 -10%
London Gatwick Airport states that in 2020 it
Oslo/Gardermoen 210 +28 +15%
reduced operating costs by over £140 million,
cut staffing levels by over 40%.
IGA Istanbul Airport traffic is increasing thanks to increase of Turkish domestic
Athens Airport reports February passenger
and flows from/to Russian Federation.
numbers down 86% year-on-year (domestic -
London/Heathrow traffic recorded a 20% increase (over the last 2 weeks), notably 76%, international -90%).
due to UK domestic flows increase, increased number of flights from/to China and
United States.
SUPPORTING EUROPEAN AVIATION 17Airports (Daily Departure/Arrival flights)
Latest operations
On 3 March 2021, traffic levels per airports record declines ranging from -61% (Nice)
to -96% (London/Gatwick), compared to same day in 2019.
Note: İGA Istanbul Airport was not in operation in January 2019 and therefore the comparison will be
meaningless until mid-April.
SUPPORTING EUROPEAN AVIATION 18Passengers
ACI recorded just above one
million passengers on 12
February 2021, a loss of 4.8
million passengers compared
to the equivalent day in 2019
(i.e. -82%).
SUPPORTING EUROPEAN AVIATION 19Market Segments
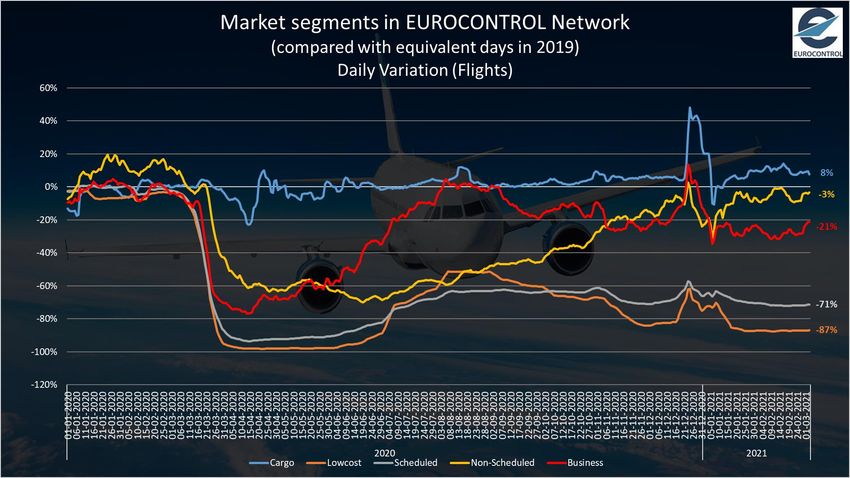
All-cargo is the only segment
consistently growing, posting
a +8% increase vs 2019.
Charter has recently slowed
down to -4% (vs 2019).
Business Aviation has recently
improved at -21% (vs 2019).
Traditional and Low-Cost,
while accounting the majority
of flights (respectively 49%
and 26% of all flights in 2020),
remain severely depressed.
Recent days showed they are
down to -71% and -87%
respectively (vs 2019).
SUPPORTING EUROPEAN AVIATION 20Vaccination updates
Vaccination: inoculations against COVID-19 have started at the end of 2020 as shown with the daily number of COVID-19
vaccination doses administered per 100 people on the left graph. On the right one: only Israel, UK, Serbia and Malta
have reported that more than 15% of people have received even one dose early March.
SUPPORTING EUROPEAN AVIATION 21Economics
GDP (Oxford Economics): Downward revision for Q1 2021 (from
+1.5% in July 2020 to +1% in December 2020, down to
-0.6% in Feb21). The remaining quarters in 2021 are expected to
record some positive growth.
At an annual level, 2021 is likely to record 4% growth in the base
scenario.
Jet fuel prices have started to rise in February, from around
150 cts/gal early February to 165 cts/gal on 26 February.
Current prices are comparable to year-ago levels, just before
the COVID-19 outbreak start.
SUPPORTING EUROPEAN AVIATION 22To further assist you in your analysis, EUROCONTROL provides the following additional
information on a daily basis (daily updates at approximately 7:00 CET for the first item and
12:00 CET for the second) and every Friday for the last item:
1. EUROCONTROL Daily Traffic Variation dashboard:
www.eurocontrol.int/Economics/DailyTrafficVariation (or via the COVID-19 button on the
top of our homepage www.eurocontrol.int)
• This dashboard provides traffic for Day+1 for all European States; for the largest airports;
for each Area Control Centre (ACC); and for the largest airline operators.
2. COVID Related-NOTAMS with Network Impact (i.e. summary of airspace restrictions):
https://www.public.nm.eurocontrol.int/PUBPORTAL/gateway/spec/index.html
• The Network Operations Portal (NOP) under “Latest News” is updated daily with a
summary table of the most significant COVID-19 NOTAMs applicable at 12.00 UTC.
3. NOP Recovery Plan.
https://www.public.nm.eurocontrol.int/PUBPORTAL/gateway/spec/index.html
• This report, updated every Friday, is a special version of the Network operation Plan
supporting aviation response to the COVID-19 Crisis. It is developed in cooperation with
the operational stakeholders ensuring a rolling outlook. © EUROCONTROL - February 2021
This document is published by EUROCONTROL for information purposes. It may be copied in whole
or in pa rt, provided that EUROCONT ROL is me ntioned as the s ource and it is not used for commercial
purposes (i.e. for financial gain). The information in this document may not be modified without
For more information please contact aviation.intelligence@eurocontrol.int prior written permission from EUROCONTROL.
www.eurocontrol.int
SUPPORTING EUROPEAN AVIATION 23You can also read


