The new RZ€ - Economy of breeding in focus - vit
←
→
Page content transcription
If your browser does not render page correctly, please read the page content below
Service & Daten
              aus einer Quelle

The new RZ€
- Economy of breeding in focus

July 2020

Genetic Evaluation Unit
Vereinigte Informationssysteme Tierhaltung w.V. (vit)
Heinrich-Schröder-Weg 1, 27283 Verden
Email: zws@vit.de
Background

◼ Dairy farms have different breeding goals
    ▪ Decreasing profits → breeding must follow (only) economy

◼ The well-known Total Merit Index RZG
    ▪ Basis: economic values of traits
    ▪ Additional breeding philosophy aspects
    ▪ Expressed on relative scale (average 100, genetic spreading 12)

◼ The relative scale
    ▪ Advantage: comparable across traits, for indices applicable, too
    ▪ Disadvantage: no information on absolute differences

◼ ➔ in practice relative breeding values often are perceived as abstract values
  and the phenotypic and economic importance are often mis-interpreted

◼ ➔ this is also true for the Total Merit Index RZG

                                        page 2
The new TMI concept
◼ Continuation of RZG on relative scale
▪ incl. non-economic breeding aspects (e.g. conformation)
▪ Traits with direct economic impact according to ratio of margins
▪ ➔ from April 2021 onward Health traits and young stock survival included
◼ NEW: additional TMI on Euro scale = RZ€
▪ Includes only/all evaluated traits with direct economic impact
▪ → orientated strictly on economy
▪ scale: Euro differences in margin
▪ based on lifetime of cow (ca. 3 lactations)
▪ basis (± 0 €): average cow alive (4-6 years old cows)
page 3RZ€ - the principle
◼ RZ€ = Euro differences in profit compared to average cow
▪ caused by differences in genetics
◼ This needs:
1.) How much phenotypic units equal to one point relative breeding value?
▪ 12 relative points = 1 genetic standard deviation (Sg)
2.) Margin of one additional phenotypic unit (e.g. +1 kg protein)
▪ Marginal income minus marginal cost
page 41.) EBV differences phenotypic differences (I)
Relative EBV daughter trait
daughter phenotype 12 points EBV ◼ Derived from sire-EBV-
( all lact.) ≈ +/- differences daughter-
RZS cell count (tsd/ml) 218* 83* phenotype-differences
RZN longevity (days) 1115 259
▪ 24 points sire-EBV-diff.
RKFit survival rate (%) until 15 mo. 93.0* 4.4*
equals 1 Sg=12 points in
1st-to-last heifer 1st-to-last heifer (days) 31.3 6.2 daughters (in daughters
NR heifer NR heifer (%) 72.0 5.0 half of sire difference is
calv.-1st calv.-1st (days) 84.2 9.0 expressed)
1st-to-last cows 1st-to-last cows (days) 51.5 10.1
NR cows NR cows (%) 55.7 6.3
CE direct difficult calvings (%) 3,5* 2.0*
SB direct still born calves (%) 5.8* 2.4*
CE daughter difficult calvings (%) 3.2* 1.7*
SB daughter still born calves (%) 5.8* 3.1*
dairy type dairy type (scores) 81.9 0.9
body body (scores) 82.1 1.1
feet & legs feet & legs (scores) 80.6 1.0
udder udder (scores) 81.2 1.0
stature stature (cm) 148.4 2.1
RZD milking speed (kg/min.) 2.42 0.40
page 51.) EBV differences phenotypic differences (II)
◼ Published health EBV are indices of several single traits (except RZudderfit)
◼ ➔ +/- 12 points index EBV causes differences in several traits at the same time
Diff. in 6 traits at the same time for
12 points RZhoof index
Diff. in 3 traits at the same time for
12 points RZrepro index
Diff. in 3 traits at the same time for
12 points RZmetabol index
*) spreading on phenotypic scale is skewed
page 61.) EBV differences phenotypic differences (III)
◼ EBV for milk production traits are expressed on phenotypic scale (kg resp. %)
▪ ➔ +/-1 kg cow EBV = +/- 1 kg phenotypic yield / lactation
▪ ➔ +/-1 kg bull EBV = +/- 0.5 kg daughter yield / lactation
daughter phenotype ◼ Derived from sire-EBV-
sire EBV daughter trait realized Sg
( all lact.) differences daughter-
milk kg milk kg (305 d) 9058 690 phenotype-differences
fat kg fat kg (305 d) 360.7 25.1
protein kg protein kg (305 d) 305.8 19.7
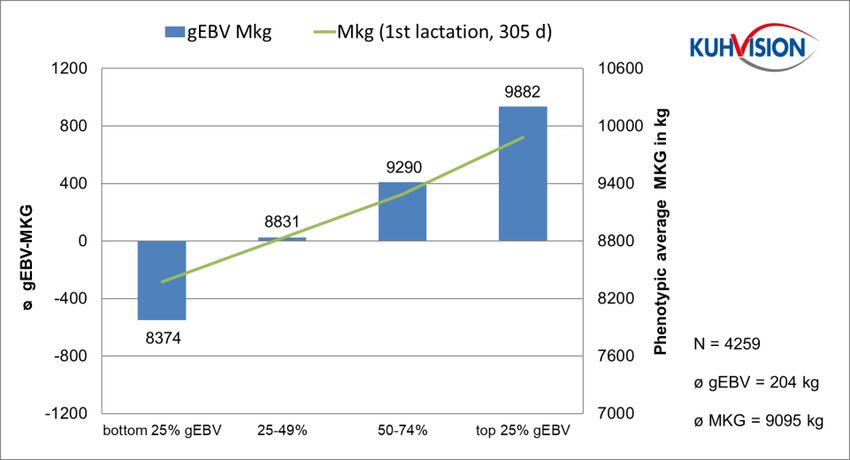
gEBV
+937 Data from herd genotyping:
◼ ±1,488 kg EBV diff. of young females
gEBV
-551 ◼ equals ± 1,508 kg true diff. in 305 d yield
◼ ➔ ± 1 kg EBV = ± 1 kg yield/lactation
page 72.) Margin of one additional phenotypic unit (I)
◼ ceteris paribus everything else is kept constant
◼ ➔ exclusively/all directly associated returns and costs (no double counting)
◼ Example for this principle:
2 cows in the same herd (= same management conditions) show in all traits
because of same genetic pattern the same performance, except for milk kg
Cow 1: Cow 2:
◼ EBV M kg +500 = 9500 kg ◼ EBV M kg +501 = 9501 kg
◼ RZN 105 = 1100 d herdlife ◼ RZN 105 = 1100 d herdlife
◼ RZR 100 = 128 d open ◼ RZR 100 = 128 d open
◼ … ◼ …
◼ ➔ Return: +1 kg milk * 0.33 € = 0.33 €
◼ ➔ Cost: +0.5 kg concentrate * 0.26 € = 0.13 €
◼ ➔ Margin: 0.33 € - 0.13 € = 0.20 € / kg milk
page 82.) Margin of one additional phenotypic unit (II)
◼ ceteris paribus everything else is kept constant
◼ ➔ exclusively directly associated returns and costs (no double counting)
◼ Example Mastitis: one (additional) case
▪ Costs for treatment
◼ Included in milk EBV and valued there
▪ Discarded milk ▪ The EBV for milk includes all genetic
▪ Less milk in lactation after cure - based differences regardless the
▪ Culling because of severe Mastitis - cause, i.e.EBV milk is not corrected for
Mastitis
◼ Included in RZN and valued there
▪ The EBV for herdlife (RZN) includes all
genetic based cullings regardless the
reason, i.e. includes cullings because of
Mastitis
page 9RZ€: Margin based on lifetime of cow
◼ Most EBV refer to performance in one lactation or one calving
▪ e.g. milk yield: EBV +100 kg = per 305 day lactation
◼ → the EBV is realized more than once in life of a cow
◼ Life of an average Holstein cow:
▪ ᴓ HOL cow: 1,100 d herd life (3.01 years), 410 d calving interval (BRS statistic)
1st 2nd 3rd
calving calving calving culled
410 d CI 410 d CI
→ 360 d milking + 50 d dry 360 d milking + 50 d dry 280 d milking
1,100 days herdlife (3.01 Jahre)
◼ RZ€ includes margin of the cow itself, not the margin generated by the next generations
▪ 1/2 of genetic superiority is transferred to next generation (daughter); she transfers 1/2 to next …
▪ → long term total margin is even bigger as expressed in RZ€
page 10Calculation of margin
◼ Assumed costs and return are based on
▪ Figures used in management consultations
▪ health: real data from veterinarians
▪ Literature
▪ Economic figures found by University of Kiel in cooperation with RSH in
representative dairy herds
▪ Own calculations of vit
◼ Experiences since introduction of RZG in 1996 show
▪ Costs and returns per unit vary over time
▪ The ratio of costs/returns and with that margin is much more stable
▪ → margins to calculate RZ€ should be verified ca. every 5 years
page 11Margin for individual traits
page 12Margin: Milk production traits
◼ Margin per kg
return1) costs (feed) margin
per Fat kg 3.73 € - 1.17 € 2.56 € / kg
per Protein kg: 5.60 € - 1.51 € 4.09 € / kg
per Lactose kg2) 0 € - 0.50 € -0.50 € / kg
▪ 1) paid are delivered amount of fat and protein
▪ payment Friesland Campina, DMK, MUH-Arla
▪ 2) 4.8% not paid lactose per kg delivered milk, causes costs
➔ Margin per standard deviation and lifetime of cow:
EBV st.dev. margin n lact. margin/st.dev.
▪ Fat kg: 25.1 kg x 2.56 €/kg x 2.75 x 1.12 3) = 197.72 €
▪ Protein kg: 19.8 kg x 4.09 €/kg x 2.75 x 1.12 3) = 248.76 €
▪ Lactose kg: 33.1 kg x -0.50 €/kg x 2.75 x 1.123) = - 51.13 €
3)EBV refer to 305 day lactation.
Factor to correct for total milk in full lactation (360 d) = 1,12
page 13Margin: herd life
◼ Main economic effect is replacement cost
▪ Difference return culled cow to (rearing) cost of replacement heifer
◼ Cost replacement heifer = 1,800 €
◼ Return culled cow = 701 €
▪ 1000 € for 42.5 % healthy cow at end of lactation (BCS>=3)
▪ 650 € for 42.5% skinny cow (BCSMargin: fertility traits (I)
◼ 5 evaluation traits: NR heifers/cows, first-last heifers/cows, calving-first cows (CF)
▪ Non-Return-Rate (NR) and first-to-last-insemination (FL) both describe conception
→ Valueing conception via FL = closer to true conception (= no double counting)
◼ Economic impact of CF and FL
▪ Both increase calving interval (CF + FL +pregnancy length = CI)
▪ „Base“ costs per day prolonged CI – independent from causal trait
▪ Less calves per life (with constant herdlife) = 0.33 € / day CI
▪ Less milk per day herdlife ?
▪ „additional“ costs per day CI if caused by worse conception
▪ Additional costs for re-insemination
▪ 35€ per re-ins. incl. work of owner per 1 cycle ➔ 21 days / 35 € = 1.67 €/day
Holstein cow with >9,500 kg milk in 305 days is not drying off with one day prolonged CI
- but less milk in the additional day in milk
- but less dry days per life, too (with constant herdlife)
➔ + 1 day CI causes no extra costs because of less milk per lifetime of cow
page 15Margin: fertility traits (II)
◼ First-to-Last (FL) heifers
▪ 1 x per lifetime realized = 1 x 6.21 Sg x 1.67 € = 10.35 € / 12 points EBV FL-heifer
◼ Calving-to-First-insemination cows (CF)
▪ 2 x per life realized = 2 x 9.01 Sg x 0.33 € = 6.05 € / 12 points EBV CF
◼ First-to-Last (FL) cows
▪ 2 x fully realized = 2 x 10.10 Sg x (1.67 + 0.33 €) = 40.40 € / 12 points EBV FL-cows
▪ 0.69 x in culling lactation = 0.69 x 10.10 Sg x 1.67 € = 11.64 € / points EBV FL-cows
▪ About 70 % of cows are inseminated in culling lactation, but no impact on n born calves per lifetime
page 16Margin: still born calf (SB)
◼ Cost/loss per still born calf = 138 €
▪ male (75 €) + female for own replacement (200 €)
◼ Genetic standard deviation
▪ SB direct = 0.024 (+/- 2.4% SBd)
▪ SB maternal = 0.031 (+/- 3.1% SBm)
◼ margin/loss per lifetime of cow (3 calvings):
➔ SBd: 0.024 x 138 € x 3 = 9.87 € / 12 points EBV SBd
➔ SBm: 0.031 x 138 € x 3 = 12.81 € / 12 points EBV SBm
page 17Margin: calving ease (CE)
CE class Add. diff. % CEm Diff. % CEd
cost/case CEm €/Sg CEd €/Sg
1 (easy) 0* +5.6 % 0 +5.8 % 0
2 (normal) 10 -3.8 % 0.383 -3.9 % 0.390
3 (difficult) 49** -1.7 % 0.817 -1.8 % 0.903
4 (caesarean) 256.52 -0.1 % 0.143 -0.1% 0.383
margin/12 points EBV 1.343 € 1.676 €
*) standard/reference
**) 20% with vet assistance
◼ €/Sg perm lifetime of cow (3 calvings):
CEm: 1.343 x 3 = 4.03 € / 12 points EBV CEm
CEd: 1.676 x 3 = 5.03 € / 12 points EBV CEd
◼ Overall farmers report a low percentage of calving problems (Margin: health traits
◼ EBV for health traits are based on treatments and diagnoses
◼ ➔ not in all traits recorded diagnoses lead necessarily to treatments i.e. to
additional costs
▪ In particular for claw disorders (e.g. Tylom/Interdigital Hyperplasia)
◼ ➔ for each health EBV the percentage of treatments that causes extra
costs must be defined (% severe/treated from all recorded diagnoses)
▪ This varies from 100 % (e.g. Displaced Abomasum, Mastitis)
▪ down to only 10% for Tylom/Interdigital Hyperplasia
page 19Margin: health traits
◼ Margin per genetic standard deviation (Sg) health index
Costs per Total costs /
% treated from Costs per ± incidence rate
treated case Total cost / Sg Sg+life [€]
diagnoses diagnose [€] /Sg index
[€]** (2.75 lact.)
RZudderfit (Mastitis) 186.02 100 186.02 0.120 22.32 61.39
Dermatitis Digitalis 32.00 30 9.60 0.120* 1.15*
Sole Ulcer 68.90 50 34.45 0.132* 4.55*
Digital Phlegmon 62.00 50 31.00 0.108* 3.35*
White Line disease 32.00 50 16.00 0.064* 1.02*
Laminitis 32.00 50 16.00 0.035* 0.56*
Interdigital Hyperplasia 73.52 10 7.35 0.044* 0.32*
RZhoof 10.95 30.13
Ovarian Cycle Disorders 28.00 50 14.00 0.115* 1.61*
Metritis 97.71 30 29.31 0.074* 2.17*
Retained Placenta 99.59 50 49.80 0.049* 2.44*
RZrepro 6.22 17.10
Displased Abomasum 289.28 100 289.28 0.031* 8.97*
Milk Fever 139.71 100 139.71 0.017* 2.38*
Ketosis 131.38 100 131.38 0.024* 3.15*
RZmetabol 14.50 39.86
**) Vet/hoof
trimmer, drugs, working *) changes in all included traits in index at the same time
time farmer, wasted milk for 12 points health index
page 20Margin: Young stock survival (calf fitness)
◼ RZcalffit refers to young stock losses in period 3 - 458 days
▪ Animal losses within first 48 h are includes in still birth
◼ → costs/losses of a died young animal within this period
Proportion
age cost/value % losses in Proportionally
losses in
period /animal [€] period costs [€]
periods
day 3-14 179* 1.86 0.26 45.62
day 15-60 367 2.37 0.33 119.50
day 61-120 485 1.24 0.17 82.62
day 121-200 604 0.83 0.11 68.81
◼ 12 points RZcalffit (Sg)
day 201-458 989 0.98 0.13 133.14
equals ±4.4% losses
Sum 7.28 1,00 449.70
*) male and female for own replacement (see still born calves)
◼ margin for lifetime of cow (3 calvings):
◼ 449.70 € x 0.044 Sg x 3 x 0.921) = 54.61 € / 12 points RZcalffit
1) only calves alive at day 3 (8 % still born calves already in SB taken into account)
page 21Margin: cell count
◼ Has cell count (SCS) own economic weight (independent from mastitis)?
▪ Higher SCS → farms more/longer affected by delivery stop because of milk quality
(>3x above 400,000 cells per ml)
▪ But proportion of delivered milk affected is very low
▪ Lower SCS → more milk can get quality bonus
▪ Not all dairies pay bonus (and with bonus no higher milk price)
→ Calculation of margin per trait unit is difficult
→ And total direct value most probably would be very low
◼ ➔ no own/direct economic weight for cell count (EBV RZS)
▪ Independent from incidence rate for mastitis
page 22Margin: conformation traits (I)
◼ Economic impact of conformation traits predominantly is indirect through
relationship with other traits (e.g. longevity)
▪ But these indirect economic effects are already valued with the respective traits
◼ ➔ Differences in conformation – with all other traits/performances the same –
have a small direct own economic weight
◼ A direct economic impact is realized when breeding animals are sold
▪ And here mainly for fresh heifers traded on auctions
◼ Heifer sales (BRS statistic 2018):
▪ from 1,827,808 Holstein herdbook cows
▪ 14,925 via auctions sold (fresh) Holstein heifers (1/3 of these exported)
▪ 91,432 exported Holstein heifers
▪ Includes exported heifers sold on auctions
▪ ??? privately sold heifers (i.e. not in BRS statistic)
▪ Calculated as same number as sold via auctions
▪ ➔ 0.19 sold heifers per herdbook cow and life (thereof ¼ fresh, ¾ pregnant)
page 23Margin: conformation traits (II)
◼ 0.19 sold heifers per herdbook cow and life (thereof ¼ fresh, ¾ pregnant)
◼ Value per point score (Master thesis S. Schierenbeck: heifer prices on MAR auctions)
▪ Dairy Type = 0 € / score (no significant difference in price)
▪ Body = 10.08 € / score
▪ Feed&Legs = 11.25 € / score
▪ Udder = 17.91 € / score
▪ Value for body and F&L adapted for pregnant heifers, too
◼ Economic impact
▪ Body : 0.191 x 10.08€ x 1.09 Sg = 2.09 € / 12 points EBV body
▪ F&L : 0.191 x 11.25€ x 1.01 Sg = 2.18 € / 12 points EBV feet&legs
▪ Udder: 0.0491)x 17.91€ x 0.98 Sg = 0.86 € / 12 points EBV udder
▪ 1) exclusively for fresh sold heifers (auction + private)
◼ ➔ Conformation totallyThe margins per trait in summary
◼ From the ration of margins per Sg resp. per EBV unit (point relative
EBV resp. kg) the relative Weighting in RZ€ can be derived
€/EBV
RZ€ €/Sg+life
point+life
Resulting relativ weights (%)
Fat (kg) 197,72 7,88 20,7
Protein (kg) 248,76 12,56 26,0 41 milk production traits
F/P free milk (kg) -51,13 -0,07 -5,3
RZN 258,69 21,56 27,0 27 productive life
FtL heifers 10,35 0,86 1,1
CtF (cows) 6,05 0,50 0,6 7 daughter fertility
FtL cows 52,06 4,34 5,4
SB direct 9,87 0,82 1,0
SB maternal 12,81 1,07 1,3
3 calving traits
CE direct 5,03 0,42 0,5
CE maternal 4,03 0,34 0,4
RZudderfit 61,39 5,12 6,4
Rzhoof 30,13 2,51 3,1
16 health traits
RZrepro 17,10 1,43 1,8
RZmetabol 39,86 3,32 4,2
Rzcalffit 54,61 4,55 5,7 6 young stock survival
Sum 100,0 100
page 25Spreading / scale RZ€
◼ (active) AI bulls are strongly selected (top of the population)
◼ Females from herd genotyping show the spreading in the entire population
▪ 213,538 HOL young females born 2018/2019 ( RZG 118, RZ€ +801)
▪ they are 18 points RZG or 801€ superior compared to cow alive with RZG 100 / RZ€ ±0
Min. -1,800 RZ€ Max. +3,000 RZ€
◼ RZ€ of bulls: daughters realize half of difference of sire RZ€
page 26Selection differential with RZ€
◼ Relative breeding progress within complexes with selection by RZ€
◼ With maximization of economic progress significant phenotypic progress in
all health and functional traits is achieved, too
▪ This includes conformation and SCS not directly included in RZ€
▪ For RZE ca. 2/3 of progress compared to selection by RZG is achieved
page 27Summary
◼ Ratio of margins for classical traits not changed significantly compared to 2008
◼ New health traits and young stock survival have substantial economic values
▪ And are economically taken into account instead of traits with indirect effects (e.g. RZS)
▪ ➔ health and young stock survival in RZG, too (in April 2021)
◼ Selection by RZ€ ensures for most dairy farms maximum progress in
profitability
▪ The scale ‘€ margin difference’ compared to average cow makes economic impact of
selection alternatives directly visible
◼ The pure economic Total Merit Index matches with the expectation of the society
according accepted breeding goals, too
▪ The sum of health traits is weighted higher compared to milk production traits (59 : 41)
page 28The new RZ€
- differences in margin with one look !
page 29You can also read