THE PATH TO VALUE KEY TRENDS: Accenture Post and Parcel Industry Research 2019 - CTT
←
→
Page content transcription
If your browser does not render page correctly, please read the page content below
KEY TRENDS:
THE PATH
TO VALUE
Accenture Post and Parcel
Industry Research 2019

CTT eCommerce Day
November 2019
OVER A DECADE OF RESEARCH
 Accenture post and parcel research

   2006            2009             2010           2011   2012   2013   2014   2015   2016   2017   2018

The unfolding story in 2019

Copyright © 2019 Accenture. All rights reserved.                                                           2
THE STATE OF THE DELIVERY INDUSTRY:
DECLINING MAIL, PROFITLESS PARCELS
 3 Year Revenue Development – Aggregate(1)
 [USD Bn, FY 2015 – FY 2018]
                                                               Favorable mix
                                                               shifts for most
                                                                 and higher                     Continued
                                    e-Commerce
                                                              pricing in the US                 decline                           Price
                                    led volume
                                                                                                                                  increases                     +$4 bn                                                     $375 bn
                                    growth                          +$8 bn                         -$8 bn
                                                                                                                                   $0.2                                                       -$2 bn

                                     +$40 bn

      $333 bn

                                  Median Margin Posts:(2)                    3.7%             Median Margin Posts:(4)                    10.7%

                                  Median Margin Integrators:(3)              9.7%

  Total Revenue                      Parcel                       Parcels                          Mail                         Mail                          Logistics                       Others                 Total Revenue
Posts & Integrators                  Volume                     Rev per Unit                      Volume                     Rev per unit                     Revenue                                              Posts & Integrators
       2015                                                                                                                                                                                                               2018
 Based on 13 companies listed in the footnotes. 55% of our peer-set; - $ 16bn not included as
 only companies which report mail and parcel revenue as well as volume could be considered
Note: (1) Aggregate sum of data from Austria Post, Canada Post, DPDHL, FedEx, La Poste, Post Nord, Poste Italiane, PostNL, Royal Mail, Swiss Post, UPS, USPS, Yamato; Rise due to Parcel Volume = (Volume 2018 – Volume 2017) * Revenue
per unit 2017; Rise due to Rev per unit = (Revenue per unit 2018 - Revenue per unit 2017) * Volume 2018; (2) Median margins of 9 posts that report parcel margins separately: Austria Post, Canada Post, CTT, La Poste, PostNL, Posten Norge,
Royal Mail, SingPost, Swiss Post; (3) Integrators include Aramex, DPDHL, Fedex, UPS; (4) Median margin includes Austria Post, CTT, Posten Norge, PostNL, Swiss Post; Exchange rate as of June 2019
Source: Annual reports; Accenture Client Value Services

Copyright © 2019 Accenture. All rights reserved.                                                                                                                                                                                                3
CONSUMERS EXPECT MORE FROM
CARRIERS: SPEED, RELIABILITY
AND CONTROL

     PRICE                         FREE            FAST   FREE + FAST         CONTROL

                                                                    We are here

Copyright © 2019 Accenture. All rights reserved.                                        4
CONSUMERS DEMAND MORE SPEED
The Rise in Same Day Delivery
The number of US digital buyers using same-day Groceries are the leading product
delivery nearly doubled YoY in 20181 category wanted the same day1
Delivery options that US Internet Users have used Items that US Internet Users want to be received via
when making digital purchases in the last 12 months, same-day delivery vs. actually received, by
Feb 2017 and Feb 2018 Category, Feb 2018 (% of respondents)
64% 19% 26% 4%
2017 Groceries Beauty products
Same-day 17%
delivery
31% 2018 46% 4% 24% 4%
Healthcare products Electronics
42% 7% 22% 2%
Next-day 40% Specialty snacks Appliances
delivery 46%
41% 5% 21% 2%
Alcohol
Clothing, shoes,
28% 5% and accessories
Two-day 67%
Household products
delivery 78%
28% 4% Want Received
Source: https://www.gopeople.com.au/blog/same-day-delivery-trends-and-statistics-to-guide-your-business/
Copyright © 2019 Accenture. All rights reserved. 5WHY LAST MILE MATTERS?
NA Retail & Hospitality eCommerce Consumer Spend by
Fulfilment Channel(1)
[USD bn] CAGR CAGR
1,460.0 [2015 – 2018F] [2018F – 2021F]
Fulfilled from Store +10.9%
1,330.0
Fulfilled from Fulfillment Center
Fulfilled from Warehouse
370.0
(25.3%)
33.4% 24.9%
1,180.0 300.0
(22.6%)
1,070.0 230.0
+14.1% (19.5%)
190.0
930.0
(17.8%) 400.0
820.0
130.0 390.0 (27.4%) 11.9% 4.6%
(14.0%) (29.3%)
720.0 110.0 370.0
80.0 (13.4%) 350.0 (31.4%)
(11.1%) 320.0 (32.7%)
280.0 (34.4%)
250.0 (34.1%)
(34.7%)
690.0
530.0 580.0 640.0
(47.3%) 10.8% 9.2%
480.0 (49.2%) (48.1%)
390.0 430.0 (49.5%)
(52.4%) (51.6%)
(54.2%)
2015 2016 2017 2018F 2019F 2020F 2021F
Source: (1) Retail’s Radical Transformation/Real Opportunities, August 2018 by IHL Group
Copyright © 2019 Accenture. All rights reserved. 6INVENTORY IS GETTING CLOSER
AMAZON’S QUEST FOR 1 DAY PRIME AND SAME-DAY
1995 2005 2017
1 Facility 6 Facilities 787 Facilities
Including 458 Whole Foods
Source: MWPVL.com, amazon.com,
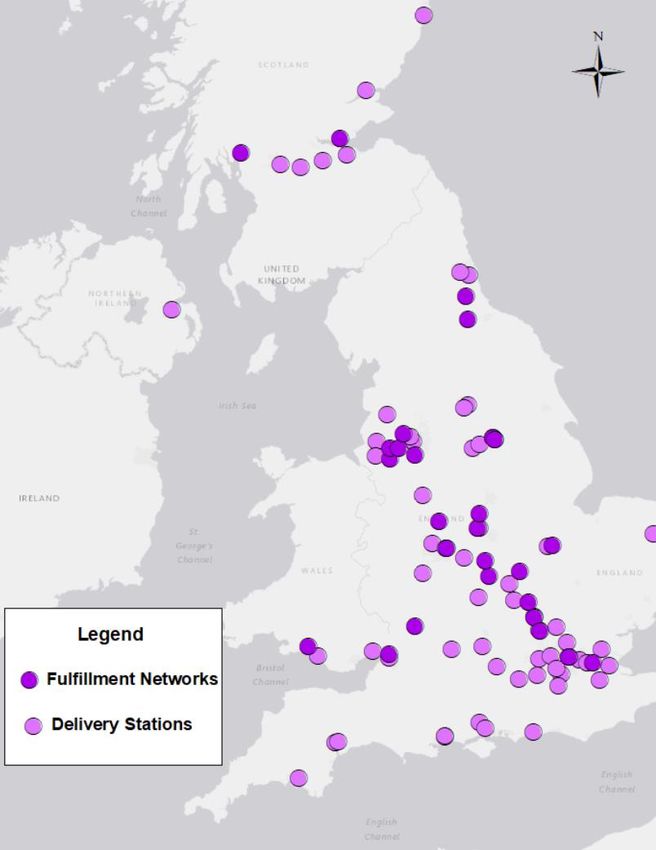
Copyright © 2019 Accenture. All rights reserved. 7INVENTORY IS GETTING CLOSER EUROPE: ACHIEVING DENSITY ONE COUNTRY AT A TIME Source: MWPVL.com, amazon.com, Copyright © 2019 Accenture. All rights reserved. 8
MILEWAY IS INVESTING IN URBAN DELIVERY
CENTERS ACROSS EUROPE’S ECONOMIES
Mileway Offers Urban Logistics Hubs Within Close Proximity To Europe’s Major Cities,
Enabling Clients To Shorten Delivery Times, Grow Their Customer Base And Expand
Geographically                                  Rotterdam:
                                                300k+
                                                                                                  41                               Amsterdam:
                                                                                  Manchester:
                                                                                                  3.1                              400k+
                                                                    Glasgow:      200k+
                                                                                                  7.3                              40
                                                                    150k+         73
                                                                                                                                   6.4
                                                                    18            4.8                        Copenhagen:
                                                     Edinburgh:                                                                    10.0
                                                                    3.6           2.7                        100k+
                                                     120k+          8.3                                                              Hanover:
                                                                                                             15
                                                     14                                                                              250k+
                                                                                                             8.0
                                                     2.0                                                                             18
                              Liverpool:                                                                     6.7                              Berlin:
                                                     8.6                                                                             5.4
                              250k+                                                                                                  13.9     100k+
                              37                                    Cardiff:                                      Dusseldorf:                 7
                              4.4                                   200k+                                         350k+                       4.0
                              6.8                                   40                                            23                          14.3
                                                                    3.6                                           2.9
                                 Birmingham:                        5.0                                           15.2   Munich:
                                 150k+                   Paris:                                                          100k+
                                 27                      600k+                                                           7
                                               London:                    Lyon:
                                 4.1                     73                                                  Frankfurt: 4.8
                                               50k+                       200k+
                                 5.6                     35.1                                                400k+       14.3
                                               25                         17
                                                         8.2              35.5                               35
                                               5.7                                                           3.0
                                               2.0                        11.8
                                                                                                             11.4
                                                                                                Barcelona:
                                                                                                55k+                                            Portfolio size (sqm)
                                                          Madrid:                               3
Note: (1) Average capacity is calculated as                                                                                                     Number of assets
portfolio size/ number of assets; Source:
                                                          20k+                                  54.0                                            Population density (‘000 per
Company website; Accenture Client Value                   1                                     18.3                                            km^2)
Services                                                  10.8
                                                                                                                                                Average capacity(1) (‘000
                                                          20.0
                                                                                                                                                sqm/unit)
Copyright © 2019 Accenture. All rights reserved.                                                                                                                               9
RETAILERS ADAPTING USING THEIR
STORES FOR LOCAL DELIVERY
Two Models To Speed Up Delivery And Meet Consumers Needs
Retailer Example Characteristics Fulfillment Model
Scale
Marketplace Amazon Analytics From own fulfillment centers
Subscription services
At least 35 orders per year
High density of stores Adapting own stores as
Grocery Walmart, Carrefour
Cold chain and special packaging
Deep pockets
warehouses and FCs
Low to high store density
Use shared warehouses (3PLs) and
Mass Merchant Nordstrom, Macy’s High cart values
own stores
Less frequent purchases
Use shared warehouses (3PLs) and
Retail Chains Sephora, Zara Variable density of stores
own stores (Shopping Centers)
Losing retail space
Increasingly going DTC - direct to
DTC Nike, Nespresso
consumer – but challenge in getting Use shared warehouses (3PLs)
consumers to their websites
Copyright © 2019 Accenture. All rights reserved. 10SEISMIC SHIFT IN ECOMMERCE
FULFILLMENT: METABOLISM OF
FULFILLMENT IS CHANGING
1 2 3 4
FASTER SMALLER LOCAL ATOMIZATION
CYCLES SHIPMENTS DELIVERIES OF INVENTORY
Source: Retail and Supply Chain SMEs; Accenture analysis
Copyright © 2019 Accenture. All rights reserved. 11SAME-DAY – DEEP INDUCTION –
LOCAL DELIVERY HAS BEEN AROUND IN THE US FOR YEARS
Volume (in 000) by product Revenue (in 000 USD) by product
type for USPS from 2010-17 CAGR type for USPS from 2010-17 CAGR
2.800.000 Parcel Select 39.8% 9.000.000
2.600.000 Priority Mail 6.3%
8.000.000
2.400.000
2.200.000 7.000.000
2.000.000
6.000.000
1.800.000 Parcel Select 41.3%
1.600.000 5.000.000
1.400.000
1.200.000 4.000.000
1.000.000 Priority Mail 4.0%
3.000.000
800.000
600.000 2.000.000
400.000 Parce Return 13.5% Express Mail -1.1%
1.000.000
200.000 Express Mail -5.0% Parce Return 15.9%
0 0
2010 2011 2012 2013 2014 2015 2016 2017 2010 2011 2012 2013 2014 2015 2016 2017
Source: USPS
Copyright © 2019 Accenture. All rights reserved. 12ECONOMICS OF LAST MILE B2C ARE NOT
PRETTY
Many delivery companies squeezed by new asset light startups
FINANCIALS FOR TRADITIONAL COMPETITION FROM LAST MILE
DELIVERY COMPANY DELIVERY STARTUPS
B2B B2C
Cost per stop $5.00 $5.50
Parcels per stop ~3 ~1.05
Cost per parcel $1.67 $5.23
First time delivery 97% 85%
rate
Source: Accenture Analysis; Industry Research
Copyright © 2019 Accenture. All rights reserved. 13B2C PARCELS MEAN HIGHER
VOLATILITY AND THE NEED FOR
GREATER INVESTMENTS IN CAPACITY
UPS Avg. and Max. Daily Shipping Volume (mn)1 Amazon Prime Day - 20182
45
Global Prime Day
40
4.2 Bi Sales – July 16 2018
35
1.7x Jump in sales from 2017
30
25
China Singles Day3,4
20
15
$25.5 Sales recorded in 24
hours in 20173
+bn
10
2009 2010 2011 2012 2013 2014 2015 2016 2017 Greater than average daily
12x shipping volume in 20174
Maximum Shipments in a Day Average Shipments in a Day
Source: (1) Financial Reports and News Reports; Accenture Estimates; (2) Statista and Amazon; (3) TechCrunch; (4) Alibaba Group
Copyright © 2019 Accenture. All rights reserved. 14POSTS NEED TO ADAPT TO NEW LAST
MILE DELIVERY MODELS NOW
From To
Static Dynamic
5 Days/Week 7 Days/week
Traditional Fulfillment Disruptive Supply Chain
Hub And Spoke Deep Induction and Two Wave Delivery
Constant Labor Variable Labor
Single Model Ecosystem
Conventional Ops Data driven Ops
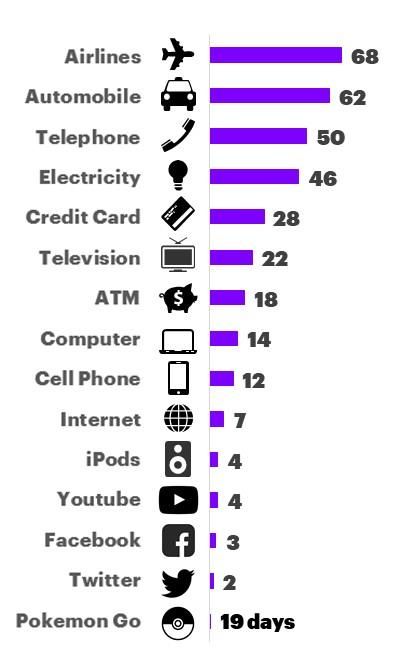
Copyright © 2019 Accenture. All rights reserved. 15BECAUSE THE PACE OF CHANGE IS
ACCELERATING
Acceleration: Number Of Global VC Funding – Supply Chain Examples of Exponential Growth
Years To Reach 50M Users1 And Logistics – Number And Value of Startups In Postal and Parcel
Of Investments2 Sector3
Deal Value [USD bn] 598 Since 2013, Cainao expanded from
Deal Count [#] 558 a Chinese logistics player into a
global one valued at ~USD 15 bn
12900
Lalamove, a HK based on-demand
451 delivery company, now has
389
presence across Asia and is valued
at ~USD 1 bn in less than 6 years
9220
8755
Glovo, a Spanish on demand
234 courier service started in 2015 now
operates in 19 countries -valued at
5076 USD 0.7 bn
87 109 3254 Launched in 2013, Deliveroo is a
495
food delivery company that has
436
1010 expanded across Europe and Asia
2012 2013 2014 2015 2016 2017 2018 2019H1 with funding >USD 1,5 bn
Source: 1 - Visual Capitalist; 2 – CBInsights; 3 – Press releases, Accenture Research
Copyright © 2019 Accenture. All rights reserved. 16FOR MORE INFORMATION ABOUT ACCENTURE
Accenture is a leading global professional services
André Pharand company, providing a broad range of services and solutions
Global Consulting Leader in strategy, consulting, digital, technology and operations.
Accenture Post and Parcel Industry Combining unmatched experience and specialized skills
across more than 40 industries and all business functions –
underpinned by the world’s largest delivery network –
andre.pharand@accenture.com
Accenture works at the intersection of business and
/in/andre-pharand technology to help clients improve their performance and
create sustainable value for their stakeholders. With
@andre_pharand 477,000 people serving clients in more than 120 countries,
Accenture drives innovation to improve the way the world
works and lives. Visit us at www.accenture.com.
www.accenture.com/PostandParcel
This document makes descriptive reference to trademarks that
may be owned by others. The use of such trademarks herein is not
an assertion of ownership of such trademarks by Accenture and is
Copyright © 2019 Accenture. All rights reserved. not intended to represent or imply the existence of an association
Accenture and its logo are trademarks of Accenture. between Accenture and the lawful owners of such trademarks.You can also read