Impacts of climate change on fire regimes and carbon stocks of the U.S. Pacific Northwest
←
→
Page content transcription
If your browser does not render page correctly, please read the page content below
JOURNAL OF GEOPHYSICAL RESEARCH, VOL. 116, G03037, doi:10.1029/2011JG001695, 2011

Impacts of climate change on fire regimes and carbon stocks
of the U.S. Pacific Northwest
Brendan M. Rogers,1,2 Ronald P. Neilson,1 Ray Drapek,3 James M. Lenihan,3
John R. Wells,3 Dominique Bachelet,4 and Beverly E. Law1
Received 18 February 2011; revised 13 June 2011; accepted 6 July 2011; published 22 September 2011.
[1] The diverse vegetation types and carbon pools of the U.S. Pacific Northwest
(PNW) are tightly coupled to fire regimes that depend on climate and fire suppression.
To realistically assess the effects of twenty‐first‐century climate change on PNW fire
and carbon dynamics, we developed a new fire suppression rule for the MC1 dynamic
general vegetation model that we ran under three climate change scenarios. Climate
projections from the CSIRO Mk3, MIROC 3.2 medres, and Hadley CM3 general
circulation models, forced by the A2 CO2 emissions scenario, were downscaled to a
30 arc‐second (∼0.6 km2) grid. Future climates amplify the already strong seasonality of
temperature and precipitation across the domain. Simulations displayed large increases in
area burned (76%–310%) and burn severities (29%–41%) by the end of the twenty‐first
century. The relatively dry ecosystems east of the Cascades gain carbon in the future despite
projections of more intense wildfires, while the mesic maritime forests lose up to 1.2 Pg C
from increased burning. Simulated fire suppression causes overall carbon gains yet leaves
ecosystems vulnerable to large future fires. Overall, our simulations suggest the
Pacific Northwest has the potential to sequester ∼1 Pg C over the next century unless
summer droughts severely intensify fire regimes.
Citation: Rogers, B. M., R. P. Neilson, R. Drapek, J. M. Lenihan, J. R. Wells, D. Bachelet, and B. E. Law (2011), Impacts of
climate change on fire regimes and carbon stocks of the U.S. Pacific Northwest, J. Geophys. Res., 116, G03037,
doi:10.1029/2011JG001695.

1. Introduction                                                             length and atmospheric CO2 concentration may enhance
                                                                            ecosystem productivity and carbon sequestration that may or
  [2] Changes in twenty‐first‐century climate are projected                 may not mitigate the impacts of summer drought and wildfires
to cause an increase in wildfires in many ecosystems
                                                                            [Cubasch et al., 2001], although progressive nitrogen limita-
[Flannigan et al., 2009], which may adversely affect the
                                                                            tion may attenuate the CO2 fertilization effect [Thornton et al.,
terrestrial carbon sink [Kasischke et al., 1995; Williams et al.,
                                                                            2009, 2007].
2004; Mouillot and Field, 2005]. The U.S. Pacific Northwest
                                                                              [3] Historic fire return intervals are estimated at 200–
(PNW) contains a wide variety of tightly coupled biomes
                                                                            500 years in the mesic forests in the western third of the
and fire regimes, which have been sensitive to past climatic
                                                                            PNW and they were usually large, stand‐replacing fires that
shifts during the Holocene and medieval warm period
                                                                            occurred in rare conditions of high winds and drought. In
[Whitlock et al., 2003] and may be vulnerable to future
                                                                            contrast, the drier mixed conifer forests in the eastern PNW
changes. This sensitivity stems in part from the PNW’s strong
                                                                            were adapted to shorter fire return intervals on the order of
seasonality of cool wet winters and warm‐hot dry summers,                   10–50 years [Agee, 1996]. Anthropogenic fire suppression
which becomes amplified in most climate projections [Mote
                                                                            has substantially altered natural fire regimes and vegetation
and Salathé, 2010]. On a per area basis, the PNW contains
                                                                            compositions in many of these eastern (semi)arid ecosys-
some of the world’s highest biomass forests with a tremen-
                                                                            tems. Fire suppression is estimated to have decreased burned
dous potential for carbon storage [Hudiburg et al., 2009;
                                                                            area by an order of magnitude since the mid‐twentieth cen-
Smithwick et al., 2002]. Future increases in growing season
                                                                            tury [Pacala et al., 2001], promoting woody encroachment
    1
                                                                            [Hessburg et al., 2000] and denser forests with higher
      Department of Forest Ecosystems and Society, Oregon State             abundances of small trees and ladder fuels that increase
University, Corvallis, Oregon, USA.
    2
     Now at Department of Earth System Science, University of California,   vulnerability to large fires [Stephens et al., 2009]. Although
Irvine, California, USA.                                                    certain agencies are starting to selectively let some fires burn,
    3
      USDA Forest Service Pacific Northwest Research Station, Corvallis,    for the most part similar fire suppression efforts are expected
Oregon, USA.                                                                to continue into the future [Berry, 2007] and thus represent
    4
     Conservation Biology Institute, Olympia, Washington, USA.
                                                                            an essential control on U.S. fire regimes.
Copyright 2011 by the American Geophysical Union.
                                                                              [4] A number of studies have predicted substantial increases
0148‐0227/11/2011JG001695                                                   in annual burn area for the PNW; however, these studies

                                                                     G03037                                                          1 of 13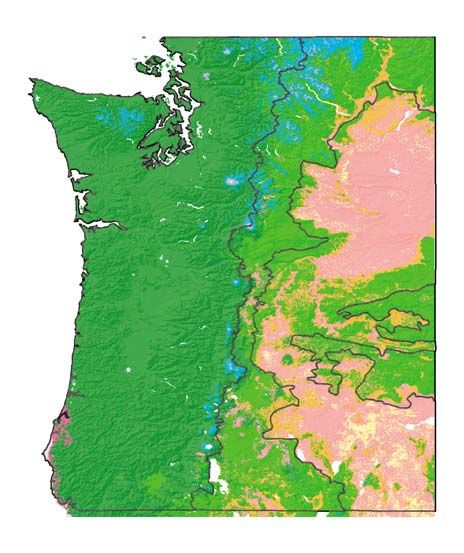
G03037 ROGERS ET AL.: PACIFIC NORTHWEST CLIMATE CHANGE EFFECTS G03037
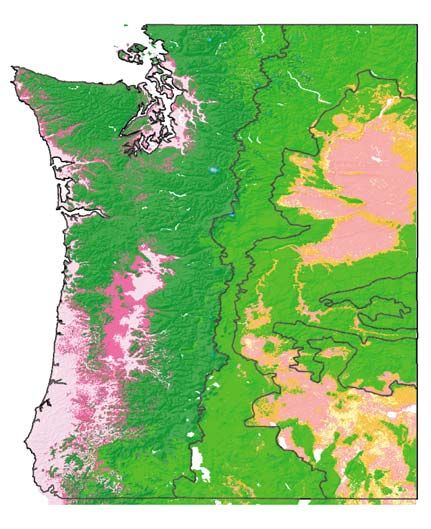
Figure 1. U.S. Pacific Northwest study domain: WF = Western Forests, EF = Eastern Forests, CP =
Columbia Plateau.
either simulate much larger domains [e.g., Bachelet et al., projected future climates and conducted sensitivity analyses
2004] or use statistical fire models [e.g., McKenzie et al., to highlight the potential changes and most important drivers.
2004; Littell et al., 2010]. Statistical models provide a
straightforward and species‐specific approach, yet they depend 2. Data and Methods
upon the choice of explanatory variable, may be extrapolated
beyond the scope of their historical climates used for fitting, 2.1. Study Domain
are unable to account for CO2 fertilization effects and biotic [6] Our study domain covers roughly the western three‐
feedbacks, do not couple fire regimes to carbon stocks, and quarters of Oregon and Washington (Figure 1). For analysis
are difficult to construct for the PNW’s mesic maritime purposes, level III ecoregions [Bailey, 1995] that displayed
forests because of low annual burn area [Littell et al., 2010]. similar historical climates and vegetation types, and reacted
Instead, it has been suggested that mechanistic ecosystem in comparable ways in the future, were aggregated into three
models that include fire, such as dynamic general vegetation regions: Western Forests, Eastern Forests, and the Columbia
models (DGVMs), be used on regional domains to understand Plateau. Western Forests experience a maritime climate with
the future role of fire in the PNW [Gavin et al., 2007; Littell high rainfall, averaging 2003 mm of mean annual precipi-
et al., 2010]. However, because of the estimated decrease in tation (MAP) between 1971 and 2000, and are comprised of
burn area due to fire suppression, DGVMs without explicit high‐biomass conifer forests characterized by long fire
suppression rules are expected to overestimate burned area return intervals (∼200–500 years). Eastern Forests are con-
by an order of magnitude across the U.S. siderably drier (717 mm MAP) and burn more frequently
[5] The twenty‐first‐century carbon budget of the PNW (∼50 years). The Columbia Plateau is the driest of the
will likely be a balance between competing processes, such regions (295 mm MAP), and is dominated by grasslands,
as increased spring precipitation and CO2 fertilization versus shrublands, and woodlands.
summer drought and intensified fire regimes. Because of the
region’s high diversity, different ecoregions within the PNW 2.2. Input Data
may respond in contrasting ways to these interacting factors. [7] The MC1 DGVM requires inputs of soil (depth, texture,
Based on paleoclimate data and other modeling efforts, fire and bulk density), monthly climate, and yearly ambient CO2.
will likely play a crucial role, although anthropogenic sup- Soils data were modified from Kern [1995]. Historical cli-
pression exerts a dominant control on burned area. In order mate data (1895–2006) were obtained from the PRISM [Daly
to assess which processes may dominate the PNW’s carbon et al., 2008] model at 30‐arc‐second resolution (∼0.6 km2).
budget and fire regimes over the coming century and where, Future climate projections were obtained from three general
we used a DGVM, the MAPSS‐CENTURY 1 model (MC1) circulation models (GCMs), chosen for their representative
[Bachelet et al., 2001], that is able to capture the interactions range of temperature changes, forced by the IPCC SRES A2
and feedbacks between major ecosystem processes. We emissions scenario [Nakićenović et al., 2000]: CSIRO Mk3
developed a new fire suppression rule for MC1 based on [Gordon, 2002], MIROC 3.2 medres [Hasumi and Emori,
metrics of modeled fire intensity that directly relate to fire- 2004], and Hadley CM3 [Johns et al., 2003] (hereafter
fighting capabilities. We then ran MC1 over the PNW on a CSIRO, MIROC, and Hadley).
fine‐scale grid (30 arc‐seconds) under historical and three
2 of 13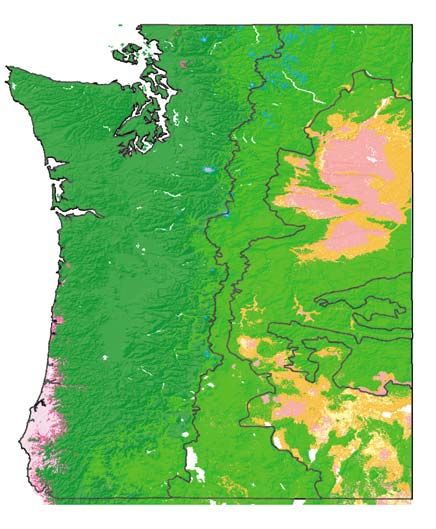
G03037                     ROGERS ET AL.: PACIFIC NORTHWEST CLIMATE CHANGE EFFECTS                                          G03037

   [8] GCM climate fields were downscaled to our 0.6 km2           pression tactics and limitations, historical burned area, and
grid using the delta, or perturbation, method [Fowler et al.,      effects on ecosystem composition. Fireline intensity, or flame
2007]. For each climate variable (monthly vapor pressure,          length, and rate of spread at the fire front, both of which are
precipitation, mean temperature, and mean daily maximum            simulated by the model using Rothermel ground fire algo-
and minimum temperatures) and each future month, anoma-            rithms [Rothermel, 1972], are two main metrics that deter-
lies between future and mean monthly historical (1971–2000)        mine the feasibility and strategy of suppression [NWCG,
GCM‐simulated values were calculated. Difference anoma-            1996]. Based on these observations, simulated fires were
lies were used for temperature and ratio anomalies were used       allowed to burn naturally if thresholds for fireline intensity
for vapor pressure and precipitation (capped at a maximum of       (3.1 MW m−1) or rate of spread (0.51 m s−1) were exceeded.
five). To reduce GCM biases in temperature ranges, maxi-           Below these thresholds, burned area was capped at 0.06% of
mum and minimum temperature difference anomalies were              the grid cell per fire.
calculated with respect to mean temperatures, normalized
against 1971–2000 observations, and applied to future mean         2.4. Calibration and Validation
temperatures. Anomalies were downscaled to our fine reso-            [11] MC1 historical output was compared to a wide
lution grid using binomial interpolation and then applied to       variety of observations in the PNW for calibration and
the mean high‐resolution historical climatology from the           validation purposes. Model fire suppression thresholds were
PRISM model. More sophisticated downscaling techniques             obtained by optimizing the comparison in our study domain
are available, such as higher‐order statistical methods and        between MC1 historical burn area and (1) gridded 1° × 1° data
regional climate models. However, the more complex sta-            from Westerling et al. [2003], and (2) the 95% rule, which
tistical techniques add little skill over the delta method in      states that that approximately 95% of historical fires in the
producing monthly climatologies [Diaz‐Nieto and Wilby,             western U.S. have been suppressed since the mid‐twentieth
2005; Maurer and Hidalgo, 2008]. Regional climate models           century, and the remaining 2%–5% escaped fires burn
capture the effects of local climate feedbacks, topography,        approximately 95% of the area [Graham et al., 1999]. The
and meteorology, yet they retain the large‐scale biases in         resulting model thresholds are similar to values at which fire
upper air patterns inherited from the GCMs and remain              fighting becomes ineffective. When fireline intensities reach
somewhat impractical for deriving century‐long data sets of        between 1.7 MW m−1 and 3.5 MW m−1, torching, crowning,
multiple scenarios because of computing resource demands           and spotting may occur and control efforts at the fire front
[Fowler et al., 2007; Salathe et al., 2007]. Domain‐averaged       will probably be ineffective [Agee, 1996]. Similarly, spread
interannual precipitation variability was measured in two          rates over 0.5 m s−1 (1.1 mph) may thwart suppression
ways: the standard deviation of annual precipitation calcu-        efforts, in part because of the difficulty in continually walking
lated relative to (1) a scenario’s linear trend, and (2) a sce-    this speed in complex terrains. The previous fire suppres-
nario’s previous year’s precipitation.                             sion rule reduced all fires’ burn areas by 87.5%. While the
                                                                   implementation of this rule leads to favorable comparisons
2.3. Model Description                                             with observations across the continental U.S., it cannot dis-
  [9] MC1 originated from a coupling between the MAPSS             criminate between fire intensities, which greatly affect the
biogeography model [Neilson, 1995], the CENTURY bio-               success of suppression efforts, and thus results in distinctly
geochemistry model [Parton et al., 1987], and MCFIRE, a            different projected ecosystem impacts.
mechanistic fire model [Lenihan et al., 1998]. The biogeo-           [12] Vegetation types simulated with full fire for the period
chemistry module simulates water and nutrient cycling, plant       1971–2000 were compared to the potential vegetation map
productivity and mortality, and organic matter decomposi-          devised by Kuchler [1975], in which vegetation types were
tion. Competition between woody and herbaceous life forms          aggregated into 35 classes as part of the Vegetation/Ecosystem
is constrained by temperature and available soil water,            Modeling and Analysis Project (VEMAP) [Kittel et al.,
nutrients, and light. The biogeography module assigns veg-         1995]. Biogeography thresholds were calibrated so that
etation types based on woody versus herbaceous biomass             modeled vegetation better matched Kuchler’s map. Simulated
stocks and climatic indices. MCFIRE simulates the occur-           combustion factors (fraction of biomass combusted by fire)
rence, intensity, and effects of fire. Its complexity lies some-   for different carbon pools from the 2002 Biscuit Fire in
where between the detailed local‐ to regional‐scale empirical      southwestern Oregon were compared to data compiled and
and cellular automata models [e.g., Finney and Ryan, 1995;         analyzed by Campbell et al. [2007].
Hargrove et al., 2000; Yang et al., 2004; Yassemi et al., 2008]      [13] Simulated carbon fluxes and pools were compared to
and the simpler fire modules of global scale GCMs [e.g.,           four data sets. An aggregated database of periodic Forest
Thonicke et al., 2001; Kloster et al., 2010]. MCFIRE is thus       Inventory and Analysis (FIA) plots in Oregon described by
able resolve multiple fuel classes, moisture contents, and fire    Hudiburg et al. [2009] was used to calibrate net primary
intensities without requiring detailed landscape data inputs,      production (NPP), mortality, and live and dead aboveground
therefore making it suitable for regional‐scale studies using      and belowground carbon pools. MC1 was run under varying
GCM‐derived input fields. Additional details on MCFIRE             conditions, including full fire, fire suppression, and no fire,
are given by Lenihan et al. [1998]. MC1 is routinely               to emulate plots classified by ecoregion and disturbance
implemented on time scales of months to centuries and on           history. A gridded map of aboveground forest biomass
spatial scales from 30 arc‐seconds (∼800 m) to 0.5° (∼50 km).      developed by Blackard et al. [2008], who interpolated FIA
Additional information on general model formulation is             plots using Moderate Resolution Imaging Spectroradiometer
provided by Bachelet et al. [2001].                                (MODIS) satellite data, was used to validate ecoregion‐
  [10] A new fire suppression rule based on metrics of fire        specific aboveground forest carbon over the entire domain.
intensity was implemented to better represent actual sup-          A separate comparison was carried out using data on old‐

                                                             3 of 13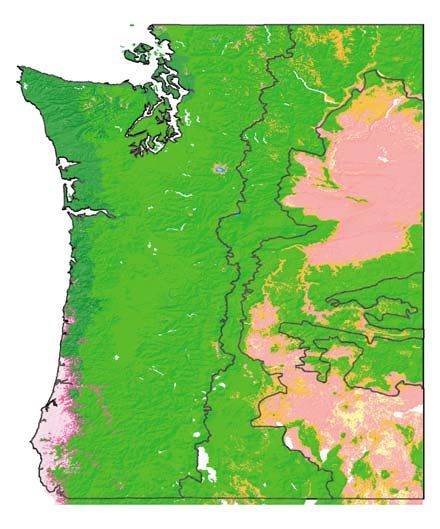
G03037                    ROGERS ET AL.: PACIFIC NORTHWEST CLIMATE CHANGE EFFECTS                                       G03037

                                                                pression was initiated in 1940, as this decade marks the
                                                                beginning of widespread successful fire suppression [Pyne,
                                                                1982].
                                                                  [15] Two Monte Carlo sensitivity analyses were conducted
                                                                to test the dependencies of model output on the choice of
                                                                input parameters and climate scenario. In each analysis, 100
                                                                randomly selected points were run through the entire time
                                                                series (historical and three future GCMs) for the same 100
                                                                different choices of parameters, which were selected ran-
                                                                domly from a Latin hypercube of ±20%. The first sensitivity
                                                                analysis changed 30 parameters that controlled key elements
                                                                of productivity, mortality, decomposition, CO2 fertilization,
                                                                evapotranspiration, and thresholds for fire suppression (see
                                                                Table S1 in the auxiliary material).1 Nitrogen was either
                                                                chosen to be limiting or not, and future climates were
                                                                selected from the three GCMs run through either the B1,
                                                                A1B, or A2 CO2 emissions scenario [Nakićenović et al.,
                                                                2000]. Only the fire suppression thresholds (rate of spread
Figure 2. Mean monthly historical (1971–2000) tempera-
                                                                and fireline intensity) were changed for the second analysis.
ture, precipitation, water stress, and net primary production
(NPP). Water stress is defined as 100*(1 – ws/PET), where
ws = mean monthly available soil water and PET = potential      3. Results and Discussion
evapotranspiration.                                             3.1. Historical Comparisons
                                                                  [16] During the historical period (hereafter 1971–2000
growth forests in the Western Forests region from three data    means), the study domain averaged 8.4°C and 1182 mm
sets: Smithwick et al. [2002], the periodic FIA plots used by   mean annual precipitation (MAP), with a clear distinction
Hudiburg et al. [2009], and the Environmental Protection        between cool wet winters and warm‐hot dry summers.
Agency (EPA) plots used in the ORCA regional carbon             Simulated NPP peaks in June, decreases mid‐summer due to
study [Hudiburg et al., 2009; Sun et al., 2004]. To ensure      water stress, and again in the fall due to temperature lim-
simulated grid‐cells were undisturbed, fire was turned off      itations (Figure 2).
in MC1. Old‐growth forests are defined as those older than        [17] MC1 results compared favorably with observations
180 years, measured by the Spies and Franklin, or Van Tuyl,     during the historical period, although there are a few sources
method [Spies and Franklin, 1991; Van Tuyl et al., 2005].       of disagreement. First, MC1 vegetation distribution fails to
The majority of all plot data were collected between 1991       capture the mixed open forests of the Willamette Valley and
and 2001, with a few observations post‐2001. Simulated          the pattern of grasslands and shrublands on the exterior
annual averages of the model variables from 1991 to 2001        edges of the Columbia Plateau (Figure 3). However, Native
were therefore used for data‐model comparisons. The sea-        Americans and European settlers greatly modified the fire
sonality of NPP in MC1 was also compared to the MODIS           regime in the Willamette Valley [Whitlock and Knox, 2002],
Aqua satellite product [Running et al., 2004] and eddy          thus allowing the establishment and maintenance of mixed
covariance data from the Metolius Intermediate Pine site        oak forests and woodlands. Additionally, the Columbia
[Law et al., 2003], the only AmeriFlux site within the          Plateau is particularly vulnerable to both grass [Keane et al.,
domain that resolved NPP. In all plot‐based comparisons,        2008] and woodland [Belsky, 1996] encroachment, promoted
MC1 results were extracted from the grid‐cell containing the    by late‐twentieth‐century climate trends, fire suppression, and
location of a given observational plot. Model parameters for    early‐twentieth‐century grazing. These issues complicate the
woody and herbaceous mortality, productivity, evaporation,      assignment of potential vegetation communities in the two
and transpiration were augmented during calibration to the      regions.
measured carbon flux and stock data. When interpreting            [18] Second, while MC1 captures the broad spatial patterns
these comparisons, it should be noted that AmeriFlux tower      of burn areas (Table 1), it often misses the magnitude and
data and models of satellite spectral data undoubtedly incor-   timing of individual fire years (Figure 4). Although climate
porate a land‐use history or spectral calibration that could    exerts a dominant control on fires at large spatial and tem-
bias the calibration. Additionally, comparisons with plot       poral scales [Flannigan et al., 2000], fine‐scale patterns of
data must take into account disturbance history and the         ignition, weather, and suppression render temporal patterns
method of plot selection, which may differ between data sets    of burn area more difficult to match on an annual basis.
and misrepresent the domain as a whole.                         Simulated large (un‐suppressed) fires account for 95.2% of
                                                                the overall simulated burned area.
2.5. Simulation Protocols                                         [19] Third, MC1 overestimates combustion factors (frac-
  [14] MC1 was first run with a mean 1895–2006 climate          tion of biomass combusted by fire) in the Biscuit Fire and
for up to 3000 years to establish initial carbon pools, and     may therefore overestimate carbon losses from fires through-
second spun up with a de‐trended and looped 1895–2006           out the domain and time series. High severity fires typically
time series for an additional 3000 years to establish stable
fire dynamics and vegetation responses. Historical simula-         1
                                                                     Auxiliary materials are available in the HTML. doi:10.1029/
tions began in 1895, and future scenarios in 2007. Fire sup-    2011JG001695.

                                                           4 of 13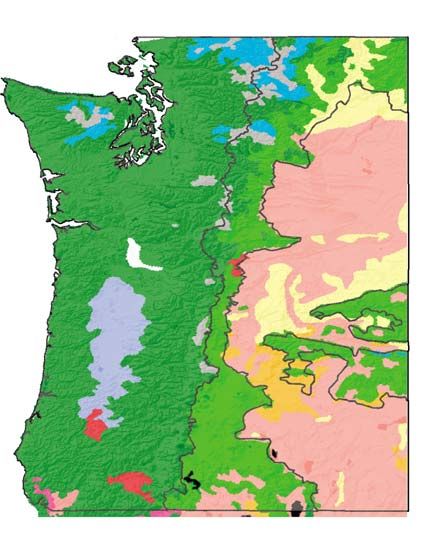
G03037                    ROGERS ET AL.: PACIFIC NORTHWEST CLIMATE CHANGE EFFECTS                                       G03037

         Figure 3. Simulated most common vegetation types with full fire for the historical (1971–2000) and
         future (2070–2099) periods under the three climate projections: The CSIRO Mk3 [Gordon, 2002],
         MIROC 3.2 medres [Hasumi and Emori, 2004], and Hadley CM3 [Johns et al., 2003] models run through
         the A2 CO2 emissions scenario [Nakićenović et al., 2000]. Also shown is the aggregated potential
         vegetation map from Kuchler [1975].

account for ∼20% of burned area in the PNW (G. Meigs,           lating the interannual variability of precipitation relative to
manuscript in review), and observations made by Campbell        a scenario’s linear trend, the future CRISO projection
et al. [2007], disaggregated by carbon pools to match MC1’s     displayed more (167 mm yr−1), MIROC displayed similar
structure, show low, medium, and high severity combustion       (149 mm yr−1), and Hadley displayed less (124 mm yr−1)
factors from the Biscuit Fire to be 0.14, 0.17, and 0.23,       variability than the historical time series (149 mm yr−1).
respectively. MC1 simulates a mean of 0.26.                     Results were similar when variability was calculated rela-
  [20] Finally, MC1 overestimates carbon stocks in Western      tive to a scenario’s previous year’s precipitation (CSIRO =
Forests (Figure 5b). However, many areas within Western         184 mm yr−1, MICOC = 149 mm yr−1, Hadley = 125 mm yr−1,
Forests, particularly the Coast Range, the Willamette Valley,   and Historical = 151 mm yr−1).
and to some extent the western Cascades, were subject             [22] Mote and Salathé [2010] compared 21 GCMs used
to heavy human influence during the twentieth century,          in the IPCC AR4 [Alley et al., 2007] to CRU version 2.02
including land conversion, logging, and urbanization. These     climate data [Mitchell et al., 2004] over the PNW and found
activities all acted to decrease total ecosystem carbon         that each of our three selected GCMs showed its own
[Smithwick et al., 2002]. Comparisons with old‐growth           strengths and weaknesses. Notably, Hadley produced one of
forests yielded mixed results depending on the data source      the lowest precipitation biases (both annually and season-
(Figure 5c), which may in part result from differing methods    ally), yet was relatively poor in representing the spatial
of plot selection.                                              distribution of meteorological fields and had a near‐zero
                                                                twentieth‐century temporal temperature trend. MIROC dis-
3.2. Future Projections                                         played one of the lowest temperature biases, yet one of the
  [21] Future climate projections (2070–2099 means) dis-        highest precipitation biases. CSIRO ranked highest of all
play both similarities and differences in the seasonality
and magnitudes of changes. Temperatures rise ubiquitously
                                                                Table 1. Historical Burn Areas From Westerling et al. [2003] and
(Figure 6a) with larger increases in summer than winter
                                                                MC1 Simulated With Fire Suppression
(Figure 6c). Consistent with the findings of Mote and Salathé
[2010], increased precipitation generally occurs in winter                          Observations (1980–2004)   MC1 (1980–2004)
and decreased precipitation occurs in summer months                  Region               (% area yr–1)         (% area yr–1)
(Figure 6d). Comparatively speaking, the CSIRO climate          All Domain                   0.321                   0.326
projection is cool and wet (+2.6°C and +176 mm MAP),            Western Forests              0.164                   0.143
MIROC is hot and wet (+4.2°C and +82 mm MAP), and               Eastern Forests              0.498                   0.638
                                                                Columbia Plateau             0.416                   0.362
Hadley is hot and dry (+4.2°C and −78 mm MAP). Calcu-

                                                           5 of 13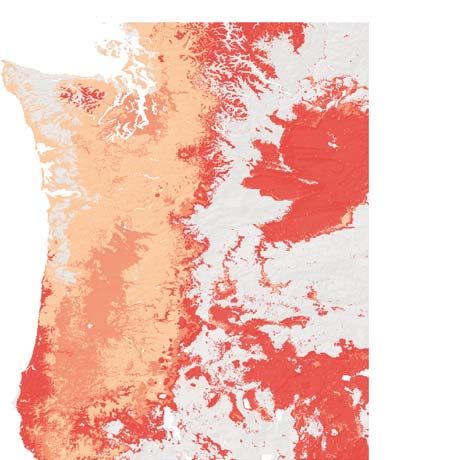
G03037                     ROGERS ET AL.: PACIFIC NORTHWEST CLIMATE CHANGE EFFECTS                                          G03037

         Figure 4. Comparison of domain‐wide burned area between Westerling et al. [2003] and MC1. Time
         series are shown for MC1 simulations with full fire and fire suppression.

models for its twentieth‐century temperature trend, yet had         variability, burn area decreased by 88% compared to histor-
the highest positive temperature bias. Otherwise, the three         ical. It should be noted that while precipitation variability is
GCMs selected here performed close to average for all other         important for the dynamic fire model, overall drying trends
metrics considered.                                                 can be the most important factor in some cases, such as under
   [23] With MIROC and Hadley, climate projections lengthen         the Hadley scenario, where interannual precipitation vari-
the growing season and amplify the already strong simulated         ability decreases but burn area increases dramatically due to
seasonal climatic cycles, thereby increasing NPP during the         more frequent summer droughts in Western Forests.
rainy season and decreasing summer NPP by exacerbating                [25] The simulated twenty‐first‐century PNW carbon bud-
summer drought. Under CSIRO’s milder conditions, NPP                get is a balance between biomass losses from intensified
increases and water stress decreases year‐round (Figures 6e         summer drought and fire, and biomass gains from higher
and 6f). As a general trend, the relative seasonal amplitude        rainy season NPP due to increased precipitation, longer
of simulated plant functions and stresses are amplified             growing seasons, and/or CO2 fertilization. The domain gains
by future climate projections, thereby increasing summer            1.1 Pg C under CSIRO and 0.9 Pg C under MIROC.
drought stress and susceptibility to fires, but also increasing     Thresholds of summer drought are surpassed such that 1.2 Pg
productivity during the rest of the year. These ecosystem           C are lost under Hadley due to large and frequent fires in
responses have been observed in the tree ring record [Villalba      Western Forests. To put this in context, 1 Pg C is approxi-
et al., 1994] and predicted under projected future climates for     mately 1=8 of our current global annual fossil fuel emissions
lodgepole pines in other parts of the American West                 [Le Quéré et al., 2009] and 23 times the size of Oregon and
[Smithwick et al., 2009]. It should be noted that MC1 does not      Washington’s current combined annual emissions [Oregon
contain a radiation constraint on NPP. The model may                Department of Energy, 2010; Waterman‐Hoey and Nothstein,
therefore overestimate increased productivity due to warmer         2006].
temperatures in non‐summer months, causing the build‐up of            [26] Domain‐wide impacts have distinct regional differ-
fuel loads and depletion of soil water, and hence overestimate      ences. Western Forests, typically considered stable with
responses to summer drought and susceptibility to fire.             long fire return intervals, proved to be the most vulnerable
   [24] Simulated fires increase under all climate projections      of the three regions in MC1. These mesic maritime forests
across the domain (Table 2). Although these increases               are largely unable to benefit from increased winter precipi-
appear late in the twenty‐first century under CSIRO and             tation because, as has been observed [e.g., Harr, 1977], soils
MIROC, Hadley’s hot and dry conditions cause large fires            are already saturated in winter. Instead, the region suffers
early to mid‐twenty‐first century (Figure 7), primarily in          from more intense summer droughts and incurs the greatest
Western Forests. Because of woody encroachment in the               relative increases in fires (Table 2). Large fires are simulated
Columbia Plateau and larger and more frequent fires in              in years with summer droughts substantially worse than
Western and Eastern Forests under all three scenarios, burn         those during the historical period. These droughts occur
severities (kg C m−2 burned) steadily increase across the           more often under CSIRO and MIROC after 2070 and are
domain throughout the twenty‐first century (Figure 7) and           mainly limited to the southwest part of the domain, but they
result in large increases in biomass consumption (Table 2).         occur much more frequently under Hadley throughout the
More frequent forest fires also generally decrease the              twenty‐first century and cause fires throughout most of the
interannual variability in burn severities. These intensifica-      Western Forests region. Under this latter projection, burn
tions of PNW fire regimes are caused by three main factors          area and biomass consumption increase by an order of
in the model: (1) increased frequency and intensity of              magnitude and the region loses nearly a quarter of its large
droughts in mesic regions, (2) elevated fuel loads in xeric         ecosystem carbon stocks. Western Forests are also subject to
regions, and (3) higher interannual variability of precipitation,   relatively large‐scale forest type conversions, with expan-
particularly in CSIRO. When a three‐year running average            sions of subtropical mixed forests under MIROC and tem-
filter was applied to CSIRO precipitation by month, which           perate coniferous forests under Hadley, and losses of
preserves seasonality and long‐term means but dampens               subalpine forests under all three projections (Figure 3). Taken

                                                              6 of 13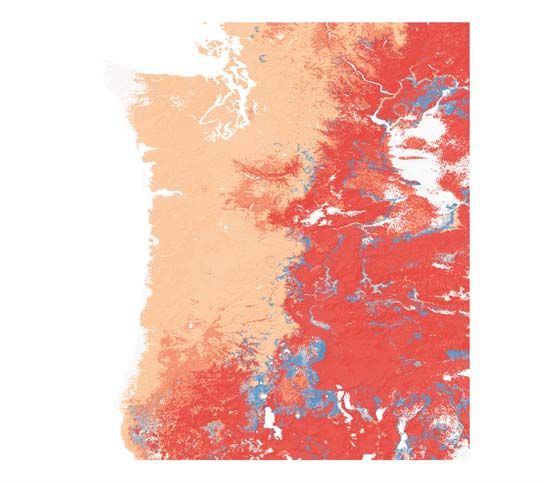
G03037                    ROGERS ET AL.: PACIFIC NORTHWEST CLIMATE CHANGE EFFECTS                                       G03037

         Figure 5. Comparisons of carbon pools and fluxes between MC1 and observations: (a) FIA plots
         across Oregon from Hudiburg et al. [2009] (5,093 plots, 90.4% on public lands, with stand ages of
         212 ± 134 years), (b) aboveground live forest carbon from Blackard et al. [2008], (c) old‐growth plots and
         MC1 run without fire (Smithwick data [Smithwick et al., 2002] contain 37 plots on public lands with stand
         ages of 429 ± 257 years; EPA data [Hudiburg et al., 2009] contain 8 plots on public lands with stand ages of
         417 ± 215 years; and FIA data [Hudiburg et al., 2009] contain 1,607 plots, 98.2% on public lands, with stand
         ages of 332 ± 123 years), (d) domain‐wide monthly net primary production (NPP) from the MODIS Aqua
         product [Running et al., 2004] (with a 24‐day moving average filter), and (e) NPP derived from flux mea-
         surements at the Metolius Intermediate Pine site tower [Law et al., 2003] (44.4523° lat, −121.5574° lon).

together, simulations of Western Forests under Hadley con-      Forests gain carbon in all three scenarios despite intensified
ditions resemble the climate, vegetation, and fire regimes of   fire regimes because of longer growing seasons, greater
the late Holocene Thermal Maximum [Whitlock et al., 2003].      synchrony between spring growth and precipitation, and
In comparison, both the Columbia Plateau and Eastern            woody encroachment in the case of the Columbia Plateau

                                                           7 of 13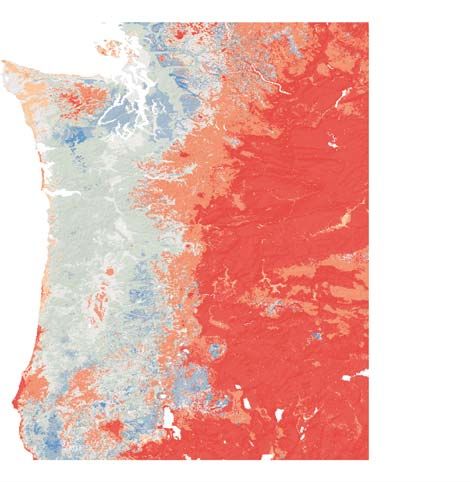
G03037                     ROGERS ET AL.: PACIFIC NORTHWEST CLIMATE CHANGE EFFECTS                                         G03037

         Figure 6. Projected annual (a) temperature and (b) precipitation, and monthly changes in (c) tempera-
         ture, (d) precipitation, (e) water stress, and (f) net primary production (NPP). Shaded areas in (a) and
         (b) indicate the time periods used for analysis in (c)–(f) (1971–2000 and 2070–2099).

(Table 2, Figure 8). The highest spatial agreements between         due to suppression because (1) simulated (and observed)
projections occur in the cases of increased fires and eco-          historical fire suppression is causing elevated fuel loads in
system carbon in the eastern domain, and vegetation shifts in       semi‐arid ecosystems and (2) current fire suppression (as
Western Forests (Figure 8).                                         assumed in the model) will not be as effective against
                                                                    intense future fires. Paradoxically, because absolute biomass
3.3. Sensitivity Analyses                                           consumption is less and ecosystems continue to gain carbon
  [27] A number of full‐domain fire sensitivity analyses were       after the initiation of simulated fire suppression, suppression
conducted in order to assess the influence of fire and fire         results in greater carbon gains (or smaller losses) than full
suppression on the carbon balance. MC1 was first run with           fire simulations (Figure 7). Nonetheless, suppression is
fire suppression turned off (full fire) and second with all fires   unable to curtail the large carbon losses under Hadley’s hot
turned off (no fire). As expected, fire suppression always          and dry climate. Because the domain is a carbon sink under
produces less burn area and biomass consumption than full           Hadley when fire is turned off, carbon losses are due entirely
fire. However, when compared to results for historical periods      to large conflagrations in high‐biomass forests. A third
with the same fire rules, fire suppression results in greater       sensitivity analysis was conducted wherein the suppression
relative and absolute increases in burn area and biomass            thresholds of fireline intensity and rate of spread were raised
consumption than does full fire, under all scenarios (Table 3).     until future burn area matched historical levels. To reach that
This suggests an intensification of future PNW fire regimes         goal, fire suppression needed to be effective on fires that

                                                              8 of 13
G03037 ROGERS ET AL.: PACIFIC NORTHWEST CLIMATE CHANGE EFFECTS G03037
Table 2. Historical (1971–2000 Means) and Future (2070–2099 were 30% more intense under CSIRO, 41% more intense
Means) Changes to Fire Regimes and Carbon Stocks by Ecoregion under MIROC, and 287% more intense under Hadley cli-
Percent Changes
mate projections. Finally, MC1 was run with the previous
fire suppression rule that reduced all burn areas by 87.5%.
Region Variable Historical CSIRO MIROC Hadley
While historical burn area is similar to those simulated with
All Domain Burn areaa 0.326 +76.3 +95.0 +310.1 the new rule (both rules were calibrated to historical data
Biomass consumedb 8.95 +127.9 +165.3 +477.6 in the U.S.), this simple reduction in burn area results in
Ecosystem carbonc 29.4 +12.2 +9.9 −13.4
Western Burn area 0.143 +161.5 +159.6 +1177.4
distinctly different impacts under climate change: ecosystem
Forests Biomass consumed 5.74 +153.2 +182.1 +1313.4 carbon increases under all scenarios (7%–15%) and burn
Ecosystem carbon 44.4 +2.5 +1.7 −23.9 area changes only slightly (±25%).
Eastern Burn area 0.638 +110.6 +141.0 +133.4 [28] These fire sensitivity analyses suggest that fire will
Forests Biomass consumed 21.9 +116.3 +163.0 +116.6 exert a dominant control over future PNW biomass stocks
Ecosystem carbon 22.5 +24.7 +22.1 −1.7
Columbia Burn area 0.362 −28.5 −11.2 +28.4 and that the simulation of fire impacts is strongly influenced
Plateau Biomass consumed 3.79 +101.6 +126.1 +171.0 by how fire suppression is modeled. More importantly in
Ecosystem carbon 12.2 +47.5 +37.4 +26.0 terms of management, the model suggests that current
a
Percent area burned per year. suppression efforts may become less effective against more
b
Unit of measure is g C m−2 yr−1. intense future fires.
c
Unit of measure is kg C m−2. [29] Two Monte Carlo parameter sensitivity analyses were
also conducted. The first, in which 100 points were run
through 100 random selections of parameters related to
fundamental model processes, revealed that our model
Figure 7. Changes in burn area, burn severity, and ecosystem carbon with fire suppression, as well as
ecosystem carbon with full fire and no fire. Shaded areas cover the historical period. Fire suppression was
initiated in 1940.
9 of 13G03037 ROGERS ET AL.: PACIFIC NORTHWEST CLIMATE CHANGE EFFECTS G03037
3.4. Uncertainties
[31] These results come with numerous sources of
uncertainty, some of which may be quantified using Monte
Carlo sensitivity analyses such as those above, and others
that are more overreaching. The primary control on twenty‐
first‐century climate change will be the trajectory of anthro-
pogenic CO2 emissions, which depends on political and
social decisions and are thus highly unpredictable. Addi-
tionally, as seen in this study, individual GCMs display
their own biases and unique projections for the PNW. Our
downscaling method cannot correct for these GCM‐simulated
biases in annual means and seasonal, interannual, and/or
interdecadal climate variability. The method can also not
account for local biosphere‐atmosphere feedbacks such as
increased warming over regions that lose snowpack. More-
over, the monthly time step in MC1 may miss physiologi-
cally important daily changes such as differential warming
between day and night. This version of MC1 assumes no
nitrogen limitation and may therefore miss carbon‐nitrogen
feedbacks associated with warming and changing fire regimes.
Because MC1 does not take radiation effects on NPP into
account, it may overestimate future increases in productivity
and vulnerability to fire by overestimating growth responses
Figure 8. Number of future scenarios that agree on a to temperature and related water use. MC1 does not include
change from the historical baseline. Changes in the positive inter‐cell communication, which at smaller scales is impor-
and negative direction are given by positive and negative tant for hydrology, erosion and sedimentation, and fire spread.
numbers for carbon and burn area. Changes of less than While some vegetation changes are driven by competition
5% (carbon) and 10% (burn area) from historical on a grid- and incorporate biogeochemical processes, others rely strictly
cell basis were deemed insignificant. on physiologically based climatic indices. The rates of veg-
etation change, and influences of adaptation, may therefore
not be accurately captured.
[32] MC1 does not account for many direct impacts on
conclusions are relatively conservative (Figure 9). Because the landscape. Changes to agriculture area, farming prac-
the number of augmented parameters was high (30), the tices, harvested land, and/or rotation ages may affect car-
output spread is considerable. However, when the 100 points bon stocks in ways unaccounted for in this study. Our fire
were aggregated together to represent a sample of the full suppression rule is based on physical metrics of fire
domain, the median historical ecosystem carbon and burn intensity, but it includes no information on human popu-
area values were close to those from the original run. Addi- lation densities, forest fragmentation, fire fighting policies
tionally, in almost every case, the future Monte Carlo simu- and budgets, or ignition sources. While lightning is the
lations result in less ecosystem carbon and more future burn primary ignition source in the PNW [Rorig and Ferguson,
area than our original run. The exception is MIROC burn 1999], changing storm patterns, arson rates, or population
area, where the median change is slightly less than value expansion could influence future fires. MC1 does not sim-
from the original run (+78% versus +95%). This suggests ulate insects and pathogens, yet mortality from pest out-
that uncertainty in our input parameters leads to more breaks has been increasing [van Mantgem et al., 2009] and
unfavorable projections for the PNW (i.e., more fires and tends to increase fire vulnerability in low elevation dry
less carbon sequestration). forests. Finally, the model does not account for herbivory,
[30] A second parameter sensitivity analysis was con- which could greatly reduce post‐fire forest regeneration.
ducted by varying only thresholds for fire suppression. With
the exception of simulations using the CSIRO climate,
results from this analysis are much more tightly constrained
than those from the previous (see above). Compared to the Table 3. Burn Area and Biomass Consumed Simulated With Full
original full domain run, slightly less area burns during the Fire and Fire Suppressiona
historical period (mean of 0.26% versus 0.33%) while Burn Area Biomass Consumed
slightly more area burns in the future (+350% versus +310% (% area yr−1) (g C m−2 yr−1)
changes under Hadley and +127% versus +95% changes Scenario full fire fire suppression full fire fire suppression
under MIROC). The effects on ecosystem carbon are neg- b
Historical 1.94 0.33 24.2 08.9
ligible: changes are within 1% of the original run. Under CSIROc 1.92 (−1.1) 0.57 (+76.3) 31.5 (+30.1) 20.4 (+127.9)
CSIRO, however, much more area burns than does in the MIROCc 2.01 (+3.9) 0.63 (+95.0) 33.7 (+39.5) 23.7 (+165.3)
original run (+352% versus +76.3%) and the domain gains Hadleyc 2.75 (+41.6) 1.34 (+310.1) 61.5 (+154.3) 51.7 (+477.6)
substantially less carbon (+8.4% versus +12.2%). This again a
Values in parentheses denote percent changes from historical.
suggests that uncertainty in our fire suppression thresholds b
Mean 1971–2000.
results in exacerbated future projections. c
Mean 2070–2099.
10 of 13G03037 ROGERS ET AL.: PACIFIC NORTHWEST CLIMATE CHANGE EFFECTS G03037
Figure 9. Probability density functions of (a) historical and (b) future changes to ecosystem carbon, and
(c) historical and (d) future changes to burn area from a Monte Carlo sensitivity analysis. One hundred
points were simulated with 100 different choices of 30 parameters, chosen from a ±20% Latin hypercube.
Points were aggregated to a single value for each of the 100 runs. Stars represent median values from the
Monte Carlo runs, and dots represent values from the original full domain run.
Many of these issues suggest model results should be con- caution there are large model uncertainties, including those
sidered relatively conservative. inherited from GCM‐projected climates. If future wildfires
increase only moderately, either through effective suppres-
4. Conclusions sion or relatively benign climate changes, the study domain
may sequester more than 1 Pg C during the twenty‐first
[33] A growing body of research suggests that we can century. Possible mitigation options, both for the PNW and
expect a significant amplification of fire regimes across North other temperate forests, could include funding long‐term
America during the twenty‐first century. Our simulated fuels reduction in low‐elevation semi‐arid forests, gaining a
increases in area burned for the Pacific Northwest (76%– larger acceptance for the role of fire prescription and letting
310%) under future climate conditions lie in general agree- certain fires burn naturally in restoring a more natural fire
ment with previously published studies for the northwestern regime, establishing longer rotation periods to maximize
U.S. [Littell et al., 2010; McKenzie et al., 2004] as well as carbon storage and allow for large trees in uneven aged stands
larger forested regions of North America [e.g., Westerling that are more resistant to disturbance, identifying and moni-
and Bryant, 2008; Balshi et al., 2009; Spracklen et al., 2009]. toring ecosystem stressors that can trigger large fires and
The MC1 model suggests ubiquitous increases in fire inten- cause vegetation shifts, and protect grasslands and open
sities (energy released) and severities (biomass burned), savannas that can sequester carbon belowground and are
exacerbated by the legacy of fire suppression. The (semi)arid therefore less vulnerable to fire losses.
biomes east of the Cascades appear capable of future biomass [34] It is increasingly recognized that fires exert critical
gains despite intensification of fire regimes because of controls on terrestrial carbon stocks, species distributions,
increased productivity in non‐summer months. The maritime forest age classes, and surface energy budgets. This study
forests west of the Cascades, however, appear vulnerable to underscores that importance and the influence that anthro-
increases in summer drought and fire occurrence, and could pogenic fire suppression has on burn area in the U.S. Pacific
possibly lose up to 1.2 Pg C by the end of the twenty‐first Northwest, a result that likely applies to modeling fire in
century. Simulated fire suppression was unable to curtail this many other industrialized countries. Elsewhere, particularly
large fire‐induced carbon source. This suggests a risk to the the sub‐tropics and tropics, anthropogenic ignition and
future sustainability of carbon sequestration and forest har- deforestation may be equally or more important. Further
vesting efforts in these high biomass forests, although we studies that couple land surface processes to regional cli-
11 of 13G03037 ROGERS ET AL.: PACIFIC NORTHWEST CLIMATE CHANGE EFFECTS G03037
mate, include socio‐economic and demographic influences J.‐L. Wybo, and L. Buisson, pp. 183–189, Int. Emergency Manage. and
on fire suppression and ignition, and account for agriculture, Eng. Soc., Nice, France.
Flannigan, M. D., B. J. Stocks, and B. M. Wotton (2000), Climate change
forestry, and urbanization are needed to further understand and forest fires, Sci. Total Environ., 262(3), 221–229, doi:10.1016/
and predict future ecosystem responses in the PNW. This S0048-9697(00)00524-6.
region is particularly important because of its sensitivity to Flannigan, M. D., M. A. Krawchuk, W. J. de Groot, B. M. Wotton, and L. M.
Gowman (2009), Implications of changing climate for global wildland fire,
climate changes, its vast array of biomes and fire regimes, Int. J. Wildland Fire, 18(5), 483–507, doi:10.1071/WF08187.
and its large biomass stocks and their suggested relationship Fowler, H. J., S. Blenkinsop, and C. Tebaldi (2007), Linking climate
to fire. Further refinement of climate and ecosystem models, change modelling to impacts studies: Recent advances in downscaling
as well as studies that validate and provide metrics of accu- techniques for hydrological modelling, Int. J. Climatol., 27(12), 1547–1578,
doi:10.1002/joc.1556.
racy across model ensembles, will help narrow the uncer- Gavin, D. G., D. J. Hallett, F. S. Hu, K. P. Lertzman, S. J. Prichard, K. J.
tainty in assessing terrestrial responses to climate change. Brown, J. A. Lynch, P. Bartlein, and D. L. Peterson (2007), Forest fire
and climate change in western North America: Insights from sediment
charcoal records, Front. Ecol. Environ., 5(9), 499–506, doi:10.1890/
[35] Acknowledgments. This work was funded through Oregon State 060161.
Gordon, H. B. (2002), The CSIRO Mk3 climate system model, CSIRO
University by the USDA Forest Service (07‐JV‐11261957‐476_INV‐
DA5 10 0) a nd T he Na tu r e Co ns er va n cy ( CSG _GCCI _0 20 30 6, Atmos. Res. Tech. Pap., 60, 130 pp., Commonw. Sci. and Ind. Res.
CSG_GCCI_113006). We thank David Conklin for code fixes, Lauren Hahl Organ., Aspendale, Victoria, Australia.
Graham, R. T., A. E. Harvey, T. B. Jain, and J. R. Tonn (1999), The effects
and Maureen McGlinchy for downscaling assistance, Chris Daly and the
PRISM group for providing climate data, Tara Hudiburg for assistance with of thinning and similar stand treatments on fire behavior in western for-
calibration data, and James Randerson for editorial comments. ests, Gen. Tech. Rep., PNW‐GTR‐463, 27 pp., Pac. Northwest Res. Stn.,
For. Serv., U.S. Dep. of Agric., Portland, Oreg.
Hargrove, W. W., R. H. Gardner, M. G. Turner, W. H. Romme, and D. G.
References Despain (2000), Simulating fire patterns in heterogeneous landscapes,
Ecol. Modell., 135(2–3), 243–263, doi:10.1016/S0304-3800(00)00368-9.
Agee, J. K. (1996), Fire Ecology of Pacific Northwest Forests, Island Press, Harr, R. D. (1977), Water flux in soil and subsoil on a steep forested slope,
Washington, D. C. J. Hydrol. Amsterdam, 33(1–2), 37–58.
Alley, R. B., et al. (2007), Summary for policymakers, in Climate Change Hasumi, H., and S. Emori (Eds.) (2004), K‐1 Coupled GCM (MIROC)
2007: The Physical Science Basis. Contribution of Working Group I to Description, K‐1 Tech. Rep. 1, 34 pp., Cent. for Clim. Syst. Res., Tokyo,
the Fourth Assessment Report of the Intergovernmental Panel on Climate Japan. [Available online at http://www.ccsr.u‐tokyo.ac.jp/kyosei/hasumi/
Change, edited by S. Solomon et al., pp. 1–18, Cambridge Univ. Press, MIROC/tech‐repo.pdf]
Cambridge, U. K. Hessburg, P. F., B. G. Smith, R. B. Salter, R. D. Ottmar, and E. Alvarado
Bachelet, D., J. M. Lenihan, C. Daly, R. P. Neilson, D. S. Ojima, and W. J. (2000), Recent changes (1930s–1990s) in spatial patterns of interior
Parton (2001), MC1: A dynamic vegetation model for estimating the dis- northwest forests, USA, For. Ecol. Manage., 136(1–3), 53–83,
tribution of vegetation and associated ecosystem fluxes of carbon, nutri- doi:10.1016/S0378-1127(99)00263-7.
ents, and water, Version 1.0., Gen. Tech. Rep., PNW‐GTR‐508, 95 pp., Hudiburg, T., B. Law, D. P. Turner, J. Campbell, D. Donato, and M. Duane
Pac. Northwest Res. Stn., For. Serv., U.S. Dep. of Agric., Portland, Oreg. (2009), Carbon dynamics of Oregon and Northern California forests
Bachelet, D., R. P. Neilson, J. M. Lenihan, and R. J. Drapek (2004), and potential land‐based carbon storage, Ecol. Appl., 19(1), 163–180,
Regional differences in the carbon source‐sink potential of natural vege- doi:10.1890/07-2006.1.
tation in the U.S.A, Environ. Manage., 33(S1), S23–S43, doi:10.1007/ Johns, T. C., et al. (2003), Anthropogenic climate change for 1860 to 2100
s00267-003-9115-4. simulated with the HadCM3 model under updated emissions scenarios,
Bailey, R. G. (1995), Description of the Ecoregions of the United States, Clim. Dyn., 20(6), 583–612, doi:10.1007/s00382-002-0296-y.
U.S.D.A. For. Serv., Washington, D. C. Kasischke, E. S., N. L. Christensen, and B. J. Stocks (1995), Fire, global
Balshi, M. S., A. D. McGuire, P. Duffy, M. Flannigan, J. Walsh, and warming, and the carbon balance of boreal forests, Ecol. Appl., 5(2),
J. Melillo (2009), Assessing the response of area burned to changing cli- 437–451, doi:10.2307/1942034.
mate in western boreal North America using a Multivariate Adaptive Keane, R. E., J. K. Agee, P. Fulé, J. E. Keeley, C. Key, S. G. Kitchen,
Regression Splines (MARS) approach, Global Change Biol., 15(3), R. Miller, and L. A. Schulte (2008), Ecological effects of large fires on
578–600, doi:10.1111/j.1365-2486.2008.01679.x. U.S. landscapes: benefit or catastrophe?, Int. J. Wildland Fire, 17(6),
Belsky, A. J. (1996), Viewpoint: Western juniper expansion: Is it a threat 696–712, doi:10.1071/WF07148.
to arid northwestern ecosystems?, J. Range Manage., 49, 53–59, Kern, J. S. (1995), Geographic patterns of soil water‐holding capacity in
doi:10.2307/4002725. the contiguous United States, Soil Sci. Soc. Am. J., 59(4), 1126–1133,
Berry, A. (2007), Forest Policy Up in Smoke: Fire Suppression in the doi:10.2136/sssaj1995.03615995005900040026x.
United States, Property and Environ. Res. Cent., Bozeman, Mont. Kittel, T. G. F., N. A. Rosenbloom, T. H. Painter, D. S. Schimel, and
Blackard, J. A., et al. (2008), Mapping U.S. forest biomass using nation- VEMAP Modelling Participants (1995), The VEMAP integrated data-
wide forest inventory data and moderate resolution information, Remote base for modelling United States ecosystem/vegetation sensitivity to cli-
Sens. Environ., 112(4), 1658–1677, doi:10.1016/j.rse.2007.08.021. mate change, J. Biogeogr., 22, 857–862, doi:10.2307/2845986.
Campbell, J., D. Donato, D. Azuma, and B. Law (2007), Pyrogenic carbon Kloster, S., N. M. Mahowald, J. T. Randerson, P. E. Thornton, F. M.
emission from a large wildfire in Oregon, United States, J. Geophys. Hoffman, S. Levis, P. J. Lawrence, J. J. Feddema, K. W. Oleson,
Res., 112, G04014, doi:10.1029/2007JG000451. and D. M. Lawrence (2010), Fire dynamics during the 20th century
Cubasch, U., et al. (2001), Projections of future climate change, in Climate simulated by the Community Land Model, Biogeosciences Discuss.,
Change 2001: The Scientific Basis: Contribution of Working Group I to 7, 565–630, doi:10.5194/bgd-7-565-2010.
the Third Assessment Report of the Intergovernmental Panel on Climate Kuchler, A. (1975), Potential Natural Vegetation of the United States, 2nd
Change, edited by J. T. Houghton et al., pp. 526–582, Cambridge Univ. ed., Am. Geogr. Soc., New York.
Press, Cambridge, U. K. Law, B. E., O. J. Sun, J. Campbell, S. Van Tuyl, and P. E. Thornton (2003),
Daly, C., M. Halbleib, J. I. Smith, W. P. Gibson, M. K. Doggett, G. H. Taylor, Changes in carbon storage and fluxes in a chronosequence of ponderosa
J. Curtis, and P. P. Pasteris (2008), Physiographically sensitive mapping of pine, Global Change Biol., 9(4), 510–524, doi:10.1046/j.1365-2486.
climatological temperature and precipitation across the conterminous 2003.00624.x.
United States, Int. J. Climatol., 28(15), 2031–2064, doi:10.1002/joc.1688. Le Quéré, C., M. R. Raupach, and J. G. Canadell (2009), Trends in the
Diaz‐Nieto, J., and R. L. Wilby (2005), A comparison of statistical down- sources and sinks of carbon dioxide, Nat. Geosci., 2(12), 831–836,
scaling and climate change factor methods: Impacts on low flows in the doi:10.1038/ngeo689.
River Thames, United Kingdom, Clim. Change, 69(2–3), 245–268, Lenihan, J. M., C. Daly, D. Bachelet, and R. P. Neilson (1998), Simulating
doi:10.1007/s10584-005-1157-6. broad‐scale fire severity in a dynamic global vegetation model, North-
Finney, M. A., and K. C. Ryan (1995), Use of the FARSITE fire growth west Sci., 72(4), 91–101.
model for fire prediction in U.S. National Parks, in Globalization of Littell, J. S., E. E. Oneil, D. McKenzie, J. A. Hicke, J. A. Lutz, R. A.
Emergency Management and Engineering: National and International Norheim, and M. M. Elsner (2010), Forest ecosystems, disturbance,
Issues Concerning Research and Applications, edited by J. D. Sullivan,
12 of 13G03037 ROGERS ET AL.: PACIFIC NORTHWEST CLIMATE CHANGE EFFECTS G03037
and climatic change in Washington State, USA, Clim. Change, 102, Stephens, S. L., J. J. Moghaddas, C. Edminster, C. E. Fiedler, S. Haase,
129–158, doi:10.1007/s10584-010-9858-x. M. Harrington, J. E. Keeley, E. E. Knapp, J. D. McIver, and K. Metlen
Maurer, E. P., and H. G. Hidalgo (2008), Utility of daily vs. monthly large‐scale (2009), Fire treatment effects on vegetation structure, fuels, and potential
climate data: An intercomparison of two statistical downscaling methods, fire severity in western US forests, Ecol. Appl., 19(2), 305–320,
Hydrol. Earth Syst. Sci., 12(2), 551–563, doi:10.5194/hess-12-551-2008. doi:10.1890/07-1755.1.
McKenzie, D., Z. Gedalof, D. L. Peterson, and P. Mote (2004), Climatic Sun, O. J., J. Campbell, B. E. Law, and V. Wolf (2004), Dynamics of carbon
change, wildfire, and conservation, Conserv. Biol., 18(4), 890–902, stocks in soils and detritus across chronosequences of different forest types
doi:10.1111/j.1523-1739.2004.00492.x. in the Pacific Northwest, USA, Global Change Biol., 10(9), 1470–1481,
Mitchell, T. D., T. R. Carter, P. D. Jones, M. Hulme, and M. New doi:10.1111/j.1365-2486.2004.00829.x.
(2004), A Comprehensive Set of High‐Resolution Grids of Monthly Cli- Thonicke, K., S. Venevsky, S. Sitch, and W. Cramer (2001), The role of fire
mate for Europe and the Globe: The Observed Record (1901‐2000) and disturbance for global vegetation dynamics: Coupling fire into a Dynamic
16 Scenarios (2001–2100), Univ. of East Anglia, Norwich, U. K. Global Vegetation Model, Glob. Ecol. Biogeogr., 10(6), 661–677,
Mote, P. W., and E. P. Salathé (2010), Future climate in the Pacific North- doi:10.1046/j.1466-822X.2001.00175.x.
west, Clim. Change, 102, 29–50, doi:10.1007/s10584-010-9848-z. Thornton, P. E., J.‐F. Lamarque, N. A. Rosenbloom, and N. M. Mahowald
Mouillot, F., and C. B. Field (2005), Fire history and the global carbon (2007), Influence of carbon‐nitrogen cycle coupling on land model
budget: A 1° × 1° fire history reconstruction for the 20th century, Global response to CO2 fertilization and climate variability, Global Biogeochem.
Change Biol., 11(3), 398–420, doi:10.1111/j.1365-2486.2005.00920.x. Cycles, 21, GB4018, doi:10.1029/2006GB002868.
Nakićenović, N., et al. (2000), Emissions Scenarios: A Special Report of Thornton, P. E., S. C. Doney, K. Lindsay, J. K. Moore, N. Mahowald, J. T.
Working Group III of the Intergovernmental Panel on Climate Change, Randerson, I. Fung, J.‐F. Lamarque, J. J. Feddema, and Y.‐H. Lee
Cambridge Univ. Press, Cambridge, U. K. (2009), Carbon‐nitrogen interactions regulate climate‐carbon cycle feed-
Neilson, R. P. (1995), A model for predicting continental‐scale vegetation backs: Results from an atmosphere‐ocean general circulation model,
distribution and water balance, Ecol. Appl., 5(2), 362–385, doi:10.2307/ Biogeosciences, 6(10), 2099–2120, doi:10.5194/bg-6-2099-2009.
1942028. van Mantgem, P. J., et al. (2009), Widespread increase of tree mortality
National Wildfire Coordinating Group (NWCG) (1996), Wildland Fire rates in the western United States, Science, 323(5913), 521–524,
Suppression Tactics Reference Guide, Natl. Wildfire Coord. Group, doi:10.1126/science.1165000.
Boise, Idaho. Van Tuyl, S., B. E. Law, D. P. Turner, and A. I. Gitelman (2005), Variability
Oregon Department of Energy (2010), Oregon greenhouse gas inventory in net primary production and carbon storage in biomass across Oregon
from 1990 through 2007, including emissions associated with the use forests—An assessment integrating data from forest inventories, intensive
of electricity, http://www.oregon.gov/ENERGY/GBLWRM/Oregon_ sites, and remote sensing, For. Ecol. Manage., 209(3), 273–291,
Gross_GhG_Inventory_1990‐2007.htm. doi:10.1016/j.foreco.2005.02.002.
Pacala, S. W., et al. (2001), Consistent land‐ and atmosphere‐based U.S. Villalba, R., T. T. Veblen, and J. Ogden (1994), Climatic influences on the
carbon sink estimates, Science, 292(5525), 2316–2320, doi:10.1126/ growth of subalpine trees in the Colorado Front Range, Ecology, 75(5),
science.1057320. 1450–1462, doi:10.2307/1937468.
Parton, W. J., D. S. Schimel, C. V. Cole, and D. S. Ojima (1987), Analysis Waterman‐Hoey, S., and G. Nothstein (2006), Washington’s Greenhouse
of factors controlling soil organic matter levels in Great Plains grass- Gas Emissions: Sources and Trends, Washington State Dep. of Comm.,
lands, Soil Sci. Soc. Am. J., 51(5), 1173–1179, doi:10.2136/sssaj1987. Trade and Econ. Dev., Energy Policy Div., http://www.pnucc.org/
03615995005100050015x. documents/WACTEDGreenHouseGasEmissions.pdf.
Pyne, S. J. (1982), Fire in America: A Cultural History of Wildland and Westerling, A. L., and B. P. Bryant (2008), Climate change and wildfire in
Rural Fire, Princeton Univ. Press, Princeton, N. J. California, Clim. Change, 87, 231–249, doi:10.1007/s10584-007-9363-z.
Rorig, M. L., and S. A. Ferguson (1999), Characteristics of lightning Westerling, A. L., T. J. Gershunov, T. J. Brown, D. R. Cayan, and M. D.
and wildland fire ignition in the Pacific Northwest, J. Appl. Meteorol., Dettinger (2003), Climate and wildfire in the western United States, Bull.
38(11), 1565–1575, doi:10.1175/1520-0450(1999)038 Am. Meteorol. Soc., 84(5), 595–603.
2.0.CO;2. Whitlock, C., and M. A. Knox (2002), Prehistoric burning in the Pacific
Rothermel, R. C. (1972), A mathematical model for predicting fire spread Northwest: Human versus climatic influences, in Fire, Native Peoples,
in wildland fuels, Res. Pap. INT‐115, 40 pp., Intermountain For. and and the Natural Landscape, edited by T. R. Vale, pp. 195–231, Island
Range Exp. Stn., U. S. Dep. of Agric., Ogden, Utah. Press, Washington, D. C.
Running, S. W., R. R. Nemani, F. A. Heinsch, M. Zhao, M. Reeves, and Whitlock, C., S. L. Shafer, and J. Marlon (2003), The role of climate and
H. Hashimoto (2004), A continuous satellite‐derived measure of global vegetation change in shaping past and future fire regimes in the north-
terrestrial primary production, BioScience, 54(6), 547–560, doi:10.1641/ western U.S. and the implications for ecosystem management, For. Ecol.
0006-3568(2004)054[0547:ACSMOG]2.0.CO;2. Manage., 178(1–2), 5–21, doi:10.1016/S0378-1127(03)00051-3.
Salathe, E. P., Jr., P. W. Mote, and M. W. Wiley (2007), Review of sce- Williams, R. J., L. B. Hutley, G. D. Cook, J. Russell‐Smith, A. Edwards,
nario selection and downscaling methods for the assessment of climate and X. Chen (2004), Assessing the carbon sequestration potential of
change impacts on hydrology in the United States Pacific Northwest, mesic savannas in the Northern Territory, Australia: Approaches, uncer-
Int. J. Climatol., 27(12), 1611–1621, doi:10.1002/joc.1540. tainties and potential impacts of fire, Funct. Plant Biol., 31(5), 415–422,
Smithwick, E. A. H., M. E. Harmon, S. M. Remillard, S. A. Acker, and J. F. doi:10.1071/FP03215.
Franklin (2002), Potential upper bounds of carbon stores in forests of the Yang, J., H. S. He, and E. J. Gustafson (2004), A hierarchical fire fre-
Pacific Northwest, Ecol. Appl., 12(5), 1303–1317, doi:10.1890/1051-0761 quency model to simulate temporal patterns of fire regimes in LANDIS,
(2002)012[1303:PUBOCS]2.0.CO;2. Ecol. Modell., 180(1), 119–133, doi:10.1016/j.ecolmodel.2004.03.017.
Smithwick, E. A. H., M. G. Ryan, D. M. Kashian, W. H. Romme, D. B. Yassemi, S., S. Dragicevic, and M. Schmidt (2008), Design and imple-
Tinker, and M. G. Turner (2009), Modeling the effects of fire and climate mentation of an integrated GIS‐based cellular automata model to char-
change on carbon and nitrogen storage in lodgepole pine (Pinus contorta) acterize forest fire behaviour, Ecol. Modell., 210(1–2), 71–84,
stands, Global Change Biol., 15(3), 535–548, doi:10.1111/j.1365- doi:10.1016/j.ecolmodel.2007.07.020.
2486.2008.01659.x.
Spies, T. A., and J. F. Franklin (1991), The structure of natural young,
D. Bachelet, Conservation Biology Institute, 2505 Vista Ave S.E.,
mature, and old‐growth Douglas‐fir forests in Oregon and Washington, Olympia WA 98501, USA.
in Wildlife and Vegetation of Unmanaged Douglas‐Fir Forests, edited R. Drapek and J. M. Lenihan, USDA Forest Service, Pacific Northwest
by L. F. Ruggiero et al., Gen. Tech. Rep., PNW‐GTR‐285, pp. 93–122,
Research Station, Corvallis Forestry Sciences Laboratory, 3200 S.W.
Pac. Northwest Res. Stn., For. Serv., U.S. Dep. of Agric., Portland, Oreg. Jefferson Way, Corvallis, OR 97331, USA.
Spracklen, D. V., L. J. Mickley, J. A. Logan, R. C. Hudman, R. Yevich, B. E. Law, R. P. Neilson, and J. R. Wells, Department of Forest
M. D. Flannigan, and A. L. Westerling (2009), Impacts of climate Ecosystems and Society, Oregon State University, Corvallis, OR 97331,
change from 2000 to 2050 on wildfire activity and carbonaceous aero- USA.
sol concentrations in the western United States, J. Geophys. Res., 114,
B. M. Rogers, 3302 Croul Hall, Department of Earth System Science,
D20301, doi:10.1029/2008JD010966. University of California, Irvine, CA 92697, USA. (bmrogers@uci.edu)
13 of 13You can also read