Impacts of life satisfaction, job satisfaction and the Big Five personality traits on satisfaction with the indoor environment - eScholarship
←
→
Page content transcription
If your browser does not render page correctly, please read the page content below

Impacts of life satisfaction, job satisfaction and the Big Five personality
traits on satisfaction with the indoor environment

Toby Cheung* 1, Lindsay T. Graham2, Stefano Schiavon2
1
    Berkeley Education Alliance for Research in Singapore (BEARS), Singapore.
2
    Centre for the Built Environment (CBE), University of California, Berkeley, US.
*Corresponding email: toby.cheung@bears-berkeley.sg

Abstract
Providing indoor environmental quality (IEQ) that satisfies building occupants is an essential
component for sustainable and healthy buildings. Existing studies mainly analyse the
importance of environmental factors on occupant satisfaction but often overlook the influence
of personal factors. Here, we aim to explore the impact of personal factors like life
satisfaction, job satisfaction, the Big Five personality traits, sex, and age on occupant IEQ
satisfaction. We conducted a cross-sectional assessment in nine air-conditioned commercial
buildings in Singapore and surveyed 1162 individuals on their satisfaction with 18 IEQ
parameters. Using proportional odds ordinal logistic regression, we found that occupants with
higher job and life satisfactions were, respectively, 1.3 – 2.3 and 1.3 – 2 times more likely
satisfied with the 18 IEQ parameters. The odds ratios (OR) for overall environment
satisfaction and job and life satisfaction were 2.1 (95% CI: 1.8 – 2.6) and 1.9 (95% CI: 1.6 –
2.3). We speculate that occupants’ satisfaction with their job and the overall environment are
entwined, meaning that a better workspace could improve job satisfaction and vice versa. We
observed some associations between the Big Five personality traits and some IEQ
parameters, but the corresponding effects were small. Due to the substantial relationship
between job and overall workspace satisfaction observed in this study, we recommend
including job satisfaction questions in future post occupancy evaluations (POEs).
Keywords: Indoor Environmental Quality (IEQ), Job Satisfaction, Life Satisfaction, Post
Occupancy Evaluation (POE), Big Five Personality Traits

Highlights
● We conducted post-occupancy surveys in 9 buildings (1162 respondents) in Singapore
● Occupants high in job satisfaction are 1.3 – 2.3 times more satisfied with IEQ
● Occupants high in life satisfaction are 1.3 – 2 times more satisfied with IEQ
● Weak relationships between the Big Five personality traits and IEQ satisfaction
● Recommend including occupants job satisfaction questions in future POE assessments

Building and Environment, March 2022, Volume 212   1           https://doi.org/10.1016/j.buildenv.2022.108783
                                                                      https://escholarship.org/uc/item/84r525hj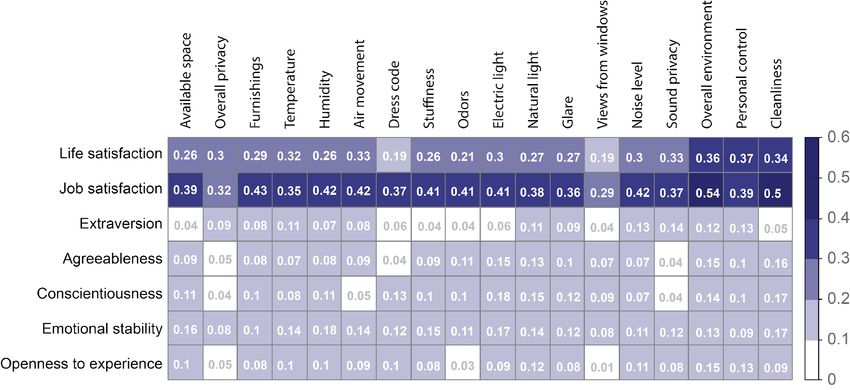
Graphical Abstract

1 Introduction
A building’s success is often determined by how well indoor environmental quality (IEQ)
supports the occupants within it. This type of success typically is measured by assessing how
satisfied occupants are with distinct elements of their environment or the overall space [1,2].
For example, perceptions of thermal comfort, lighting, air quality and acoustics are known to
influence the overall environmental satisfaction [3–7]. And these perceptions can be tied to
measurable physical parameters (e.g., temperature, illuminance, carbon dioxide concentration
and sound pressure levels). For instance, architectural parameters such as office type, spatial
layout, desk location (distance from a window), window view, amount of available space, the
comfort of one’s furnishings, space cleanliness, façade design, window to wall ratio and
building orientation also show a strong relationship in predicting environmental satisfaction
[8–12]. In addition to being able to tie perceptions to physical features, the literature shows
perceptions can also be tied to some personal factors (such as metabolic rate). Thermal
comfort, for instance, is often related to four physical parameters (air temperature, mean
radiant temperature, air speed, and relative humidity), and two personal characteristics
(clothing insulation and metabolic rate) [13].
Though findings have been inconsistent and sometimes small, age and sex have also been
shown to have an impact on occupants’ satisfaction with office IEQ [12,14–16]. If
physiological differences (i.e., sex and age) can play an important role in occupants’
satisfaction, other individual differences may also be important. People have different
expectations, perceptions and reactions to the indoor environment. For example, we know
occupants’ perceptions can influence each other; overall environmental satisfaction is
affected by a person’s satisfaction with other IEQ parameters, such as cleanliness and amount
of space [9,17]. There is also evidence showing that symptoms, like those common to sick
building syndrome (SBS) relate to occupants’ satisfaction with the physical environment
[18]. However, not all self-reported factors are helpful in environmental satisfaction
prediction. Some studies have suggested that occupants’ past experience and expectations
may influence perceptions of the indoor environment [19,20] (e.g., subject’s assumption to a

Building and Environment, March 2022, Volume 212   2           https://doi.org/10.1016/j.buildenv.2022.108783
                                                                      https://escholarship.org/uc/item/84r525hj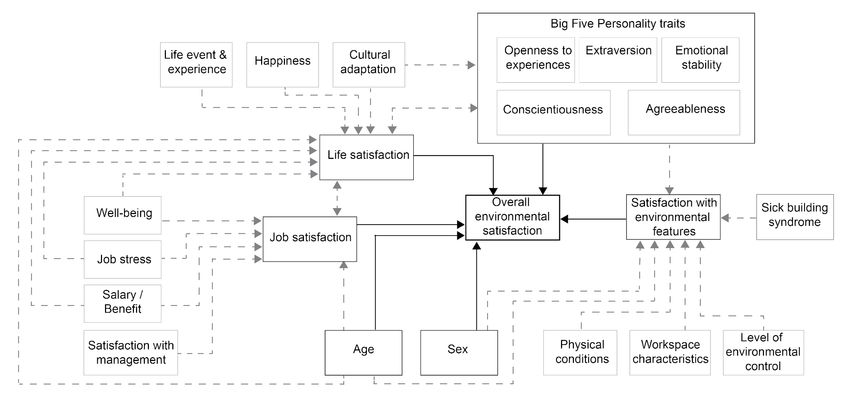
green standard certified building), but these factors are difficult to translate into quantifiable
metrics. Furthermore, it is challenging to draw conclusions about seemingly influential, yet
dynamic personal factors (like emotion or mood) that tend to shift continuously.
One human factor possibly subject to fluctuation that has consistently shown to have a
positive relationship with environmental satisfaction is job satisfaction [21–24]. This
relationship is linked to important outcomes for employers such as job stress [25], employee
benefits and salary [26], physical and mental well-being [27], and satisfaction with
management [22]. This relationship also appears to be linked with age—in general, job
satisfaction tends to improve as we get older [28]. Further, work like the Cost-effective
Open-Plan Environments (COPE) project showed that higher overall environment
satisfaction enhances job satisfaction [22,29]. We speculate that the job – environment
satisfaction relationship can also be explained in an alternative direction. For example, staff
who are more satisfied with their workspace environment (i.e., fewer complaints or higher
tolerance) might in turn be more satisfied with their job.
Though complex and dynamic characteristics like those mentioned above may prove
challenging to pinpoint, how might more static or stable characteristics like life satisfaction or
personality influence perceptions? Life satisfaction has been linked to significant life and
personal outcomes such as marriage and job stability and satisfaction [30,31], life events and
experiences [32], overall happiness [33] and even personality [34]. There is evidence
showing that life satisfaction may also be linked to environmental perceptions. For example,
in one study, poor air quality and high workplace noise levels appeared to markedly diminish
life satisfaction [35]. This work raises the question—would higher life satisfaction in
occupants allow for higher tolerance (i.e., more satisfaction) with the surrounding
environment? Unfortunately, the life–environmental quality satisfaction relationship currently
remains vastly unexplored.
Like life satisfaction, personality has also been linked to a wide range of significant life
outcomes including health, relationship quality, job satisfaction, job selection, culture and
even performance [36–39]. There are a few studies that investigate the relationship between
personality and occupants’ satisfaction with IEQ in workspaces. For example, a study of 389
occupants in five offices reported that more extroverted and more agreeable workers were, in
general, more satisfied with the physical environment in open plan offices [40]. In another
study surveying 190 respondents in 17 multi-tenant offices results showed those people
higher in Extraversion, Openness to experience and Agreeableness also have higher
satisfaction with the overall office environment [41]. Similarly, in a study of 327 employees
within 13 organizations, a small but significant effect was found between personality traits
and environmental satisfaction [42]. A laboratory test of 180 occupants also found
personality to have an indirect influence on people’s satisfaction with more abstract IEQ
factors (i.e., views from window, level of control and privacy) [43]. And interestingly, a
longitudinal study following 19 occupants for three to seven months shows that those higher
in Extraversion were more likely to be stressed by workspace IEQ [44]. With variables like
personality, a larger sample size is often desired to understand generalizability and true effect,

Building and Environment, March 2022, Volume 212   3             https://doi.org/10.1016/j.buildenv.2022.108783
                                                                        https://escholarship.org/uc/item/84r525hj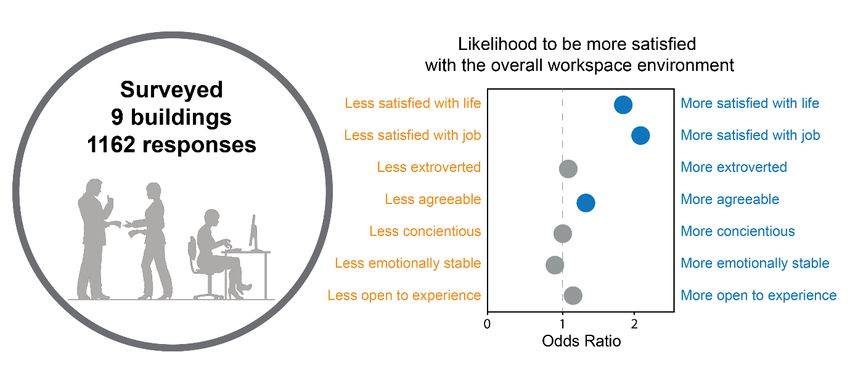
therefore studies like these mentioned above have limitations. However, they do offer some
valuable insights into this relatively unexplored domain.
Using our knowledge of these psychological characteristics (personality, life and job
satisfaction) along with the literature, we have developed a conceptual model to begin
exploring the connections between these variables and environmental factors (Figure 1). The
model suggests that the overall environmental satisfaction in the workspace is affected by
satisfaction with other individual environment features, physiological personal factors (age
and sex), and psychological personal factors (satisfaction with life, job and the Big Five
personality traits). Other factors in the lighter grey box are considered to be potential
variables that may have an impact to overall environmental satisfaction via satisfaction with
environmental features and personal factors. Despite an association found between life
satisfaction and personality traits, results from four large scale independent surveys suggested
that personality variables could only explain 0.1 – 1.8% of the variance of overall life
satisfaction [45]. Participants’ life satisfaction and personality traits are assumed to be
independent variables in the current study. Past work shows the relationship between life and
job satisfaction to be highly correlated and bi-directional [31], therefore, within our model,
their impact to overall environment satisfaction is separately determined.

           Figure 1 Conceptual model between overall environmental satisfaction and related variables.

This study aims to evaluate the impacts of psychological personal factors, specifically life
satisfaction, job satisfaction, and the Big Five personality traits, on occupants’ satisfaction
with indoor environmental parameters in workspaces. These relationships are rarely explored.
Participants’ age and sex are collected as control parameters in the analysis.

2 Methodology
2.1 Sampling scope
Nine Green Mark certified air-conditioned office buildings in Singapore were surveyed
resulting in 1162 individual responses. To maintain consistency, our participants only
included staff who were performing office work and had personal workstations, and excluded

Building and Environment, March 2022, Volume 212        4                 https://doi.org/10.1016/j.buildenv.2022.108783
                                                                                 https://escholarship.org/uc/item/84r525hj
any individuals working within any non-office spaces within the same building. In each
building, at least 10 % of the total occupancy were surveyed. We provided an individual
survey link for each building, and the facility management team for each space distributed
this link to all target occupants. This study is approved by the Office for Protection of Human
Subjects from the University of California Berkeley. The surveyed database with anonymized
data is openly and freely available online [46].
2.2 Survey parameters
In this study, we collected self-reports of occupants’ (i) satisfaction with their workspace
environment, (ii) demographics, (iii) life satisfaction, (iv) job satisfaction, and (v) Big Five
personality traits.
2.2.1 Environment satisfaction
To assess satisfaction with the workspace environment, we surveyed 18 IEQ parameters
including temperature, humidity, air movement, flexibility of dress code, electrical lighting,
natural lighting, glare, views from windows, stuffiness, odours, noise level, sound privacy,
cleanliness, available space, furnishings, level of personal control, overall privacy and overall
environment. Each satisfaction question starts with: “How satisfied are you with the …”
followed by the environmental factors in question. The participants answered these questions
using a 7-point Likert scale: “very satisfied” (+3), “satisfied” (+2), “somewhat satisfied”
(+1), “neither satisfied nor dissatisfied” (0), “somewhat dissatisfied” (-1), “dissatisfied” (-2),
and “very dissatisfied” (-3).
2.2.2 Demographics
The questionnaire also asked participants to report their sex (male or female) and age group
(21 – 30, 31 – 40, 41 – 50, 51 – 60, and 61 or above).
2.2.3 Life satisfaction
The satisfaction with life scale (SWLS) was used to assess occupants’ life satisfaction [47].
This tool is widely used within the social sciences as a measure of the life satisfaction
component of subjective well-being. The scale has high internal consistency and good
test-retest reliability [48]. There are 5 related questions in this tool as shown in Appendix
Figure A1. This scale also uses a 7-point Likert scale: “Strongly agree” (7), “Agree” (6),
“Somewhat agree” (5), “Neither agree nor disagree” (4), “Somewhat disagree” (3),
“Disagree” (2), and “Strongly disagree” (1). To generate a score for each participant,
responses to these 5 questions were averaged. An occupant with a higher score on the SWLS
indicates that they are more satisfied with their life.
2.2.4 Job satisfaction
Participant job satisfaction could be a multi-directional index [23]. However, to limit survey
fatigue and cognitive load on participants we reduced this to a single-item measure with a
scale that mimicked the last item on the SWLS. The item asked: “Taking everything into
consideration, I am satisfied with my job as a whole” We used the same 7-point Likert scale
for SWLS in this question. Higher scores in job satisfaction indicate that a person is more
satisfied.
Building and Environment, March 2022, Volume 212 5 https://doi.org/10.1016/j.buildenv.2022.108783
https://escholarship.org/uc/item/84r525hj2.2.5 Big Five personality traits
We operationalized personality utilizing the Five Factor Model (FFM) [49] which defines
one’s consistent thoughts, feelings, and behaviours in terms of traits—also known as the “Big
Five” personality traits. Within this framework, it is believed that each individual possesses a
unique level of each trait: Extraversion, Agreeableness, Conscientiousness, Emotional
Stability, and Openness to Experience [49]. Each of these traits is assessed on a continuum
and are also comprised of a number of “facets”, or sub-traits that help define them. Those
high in Extraversion are talkative, assertive, sociable and sensation seeking. Those high in
Agreeableness tend to be warm, trusting, altruistic and compassionate. Those high in
Conscientiousness are dutiful, reliable, self-disciplined, and organized. Individuals high in
Emotional Stability are unflappable, not easily anxious or depressed, and are secure. And
people high in Openness to Experience are usually characterized as creative, imaginative,
intellectually curious, and comfortable with abstract thoughts and ideas.
In the current study, we focus our assessment on the high-level traits rather than the facets
and do so using the Ten Item Personality Inventory (TIPI) [50]. (See Appendix Figure A2).
The TIPI is a widely used and validated short measure of the Big Five intended to reduce
participant fatigue and cognitive load. Also, it demonstrates high convergence with other
longer measures of personality [50]. Each of the five personality factors is measured with two
items aimed at capturing the polarity of each trait. For example, the trait Emotional Stability
(i.e., Neuroticism) is measured with two items: (i) Clam, emotionally stable and (ii) Anxious,
easily upset. In the case of Emotional Stability, the second item is reversed scored, and then
the two items are averaged for a final “Emotional Stability Score”. Those high in Emotional
Stability will have a higher score, and those lower in Emotional Stability (i.e., high in
Neuroticism) will have a lower score. Before each item, the participant sees the statement “I
see myself as…:”, and reports whether or not they strongly disagree or strongly agree with
the statement. The scale reflects a 7-point Likert scale, with scale points similar to that of the
SWLS and job satisfaction item.
2.3 Statistical analysis
2.3.1 Correlations between parameters
We want to understand if there is any monotonic relationship, not necessarily linear, between
the personal factors and the occupant’s satisfaction with their environment. Applying the
Spearman rho (ρ) approach, we evaluated the correlation coefficient between satisfaction
with the 18 IEQ parameters and the other personal variables: (i) job satisfaction, (ii) life
satisfaction, and (iii) the Big Five personality traits. The correlation coefficient is considered
statistically significant when the corresponding p-value < 0.05.
2.3.2 Proportional odds ordinal logistic regressions
We applied proportional odds ordinal logistic regressions to identify which personal factors
(i.e., life satisfaction, job satisfaction, Big Five personality traits, sex, and age) have a higher
influence on the 18 IEQ satisfaction parameters. For life satisfaction, job satisfaction and the
Big Five personality traits, we used the scores resulting from the SWLS, a 7-point job
satisfaction item and the TIPI as the numeric inputs. For sex, the “female” factor acted as the
base case and “male” as the alternative case. For participant age, we took the median year
Building and Environment, March 2022, Volume 212 6 https://doi.org/10.1016/j.buildenv.2022.108783
https://escholarship.org/uc/item/84r525hjvalue to represent each age group. For example in the “21 – 30” age group and the “31 – 40”
gage group the representing years were 25 and 35 years old respectively. The age inputs in
the regression analysis were further normalized by 10, meaning, one-step of a sensitivity
change in the age group was 10 years instead of 1 year. Occupant satisfaction responses on
the 7-point Likert scale in each of the 18 IEQ parameters were the dependent variables in
terms of factors (e.g., Satisfied, Very dissatisfied).
An odds ratio (OR) is used to measure the association between a predictor and the dependent
variable [51]. For example, when examining “life satisfaction” with “temperature
satisfaction”, if an odds ratio of 2 is found, we know that a one-unit increase in a life
satisfaction score (e.g. 1.5 to 2.5) leads to a 2 fold increase in the odds of a one-scale
temperature satisfaction increase (e.g., Somewhat satisfied to Satisfied). In addition, the
above interpretation is based on an assumption that all other variables within the same
analysis remain unchanged. In other words, the two participants (one’s life satisfaction score
= 1.5 and the others score = 2.5) being compared are both extroverted, satisfied with their
job, the same sex, and from the same age group. Analysis using ORs provides direct insight
into the strength of the relationship between the predictor and dependent variable. It also
allows us to compare the magnitude of the odds (i.e., likelihood of the impacts) between
predictors to the output. In short, a higher OR means a higher impact from a personal factor
to the IEQ satisfaction parameter. These analyses were performed in R version 4.1.1 [52]. We
used the “polr” function in “MASS” package to develop the logistic regression model [53].
3 Results
A total of 1162 occupants were surveyed in 9 air-conditioned office buildings in this study.
Within the database, 626 (54 %) of respondents were female and 496 (43 %) were male,
while the remaining 3 % did not specify. 254 participants (22 %) reported being 21 – 30 years
of age, 401 (35 %) reported being 31 – 40, 290 (25 %) were 41 – 50, 145 (12 %) were 51 –
60, and 31 (3 %) were 61 years or older. 41 participants chose not to report their age. The
survey sample and the percentage of the sampling rate (in bracket) for Buildings 1 – 9 are: B1
215 (22 %), B2 70 (78 %), B3 65 (85 %), B4 82 (63 %), B5 108 (13 %), B6 17 (94 %), B7
108 (15 %), B8 351 (23 %), and B9 146 (39 %). In addition, 880 participants (76 %) sat in
open plan offices, 125 (11 %) were located in private or enclosed offices, and 157
participants did not specify their workspace type.
Building and Environment, March 2022, Volume 212 7 https://doi.org/10.1016/j.buildenv.2022.108783
https://escholarship.org/uc/item/84r525hj3.1 Distribution of IEQ satisfaction
Figure 2 A summary of satisfaction votes for the 18 IEQ parameters. The sequence is arranged from highest
satisfaction (top) to lowest satisfaction (bottom). The percentage of satisfied (green) and dissatisfied (red) are
reported for each parameter.
Using Cronbach’s Alpha (α) with a 95 % Confidence Interval (CI), we evaluated the internal
consistency of the IEQ satisfaction subscale consisting of 18 items (α = 0.92, CI: 0.91 – 0.93)
[excellent] [54]. The responses for all 18 IEQ satisfaction questions were negatively skewed,
meaning that the distribution mean is less than the median (i.e., more observed satisfied
responses than dissatisfied responses). The most skewed parameter is satisfaction with
electric light (-1.32) and the least skewed parameter is satisfaction with sound
privacy (-0.03).
Figure 2 presents a summary of the distribution in satisfaction for each of the 18 IEQ
parameters surveyed in 9 office buildings in Singapore. The parameters are arranged in
descending order of satisfaction. The majority of the parameters (i.e., at least 50 % of the
data) fall between 0 “Neither satisfied nor dissatisfied” and 2 “Satisfied”, except satisfaction
with sound privacy. Building occupants were generally satisfied with the overall workspace
environment (% of Satisfaction, S% = 80 %). We found the three highest satisfied parameters
were satisfaction with electric light (S% = 85 %), cleanliness (84 %) and flexibility of dress
code (80 %), while the three highest dissatisfied parameters were satisfaction with sound
privacy (% of Dissatisfaction, D% = 42 %), personal control (25 %) and overall privacy (25
%).
3.2 Distributions of life satisfaction, job satisfaction and Big Five personality traits
Figure 3 shows box plots of the personal factors surveyed: life satisfaction, job satisfaction,
Extraversion, Agreeableness, Conscientiousness, Emotional Stability, and Openness to
Building and Environment, March 2022, Volume 212 8 https://doi.org/10.1016/j.buildenv.2022.108783
https://escholarship.org/uc/item/84r525hjExperience. Our sample reflected a negative skew (i.e., the median respondent is above the
mean value of the scale) of the distribution for most variables. The corresponding skew
values are: life satisfaction (-0.71), job satisfaction (-1.48), Extraversion (0.05),
Agreeableness (-0.22), Conscientiousness (-0.41), Emotional Stability (-0.56), and Openness
to Experience (0.11). 50 % and 75 % of the participants were satisfied with their life (mean
[standard deviation] = 4.73 [1.31]) and current job (5.54 [1.06]) respectively. Additionally, on
average, participants were higher in Agreeableness (mean [s.d.] = 5.06 [0.94]),
Conscientiousness (5.26 [1]), Emotional Stability (5.01 [1.06]), and Openness to Experiences
(4.71 [0.91]). Meanwhile, participants were normally distributed with regards to Extraversion
around the central score (mean [s.d.] = 3.99 [1.20]).
Figure 3 Box plots for the normalized life satisfaction score, job satisfaction score and the Big Five personality
traits. The extremities of the boxes are from 25th to 75th percentile of the data. The bold vertical lines indicate the
median value and the pink colour dots represent the arithmetic means score for each parameter.
3.3 Correlation analysis
Figure 4 presents the spearman rho correlation coefficients (ρ) of the 18 IEQ satisfaction
parameters correlated with life satisfaction, job satisfaction and the Big Five personality
traits. We found that job satisfaction has the highest positive correlation with all 18 IEQ
satisfaction parameters, meaning that occupants who are more satisfied with their job, are
also more likely to be satisfied with the workspace environment, or vice versa, especially
with regards to the overall environment (ρ = 0.54), cleanliness (ρ = 0.50), and furnishings (ρ
= 0.43). Additionally, life satisfaction was the second most highly correlated variable with all
IEQ satisfaction parameters, especially in relation to perceived personal control levels (ρ =
0.37), the overall environment (ρ = 0.36), and cleanliness (ρ = 0.34).
Building and Environment, March 2022, Volume 212 9 https://doi.org/10.1016/j.buildenv.2022.108783
https://escholarship.org/uc/item/84r525hjFigure 4 Spearman rho correlation coefficients of 18 IEQ satisfaction parameters in the workspace correlated
with life satisfaction, job satisfaction and the Big Five personality traits (Extraversion, Agreeableness,
Conscientiousness, Emotional Stability and Openness to Experience).
When examining personality traits, Emotional Stability was significantly correlated with all
18 IEQ satisfaction parameters, suggesting that the more emotionally stable a person is, the
more likely they will be to report higher satisfaction with the workspaces environment—and
specifically when it comes to satisfaction with humidity (ρ = 0.18), electric light (ρ = 0.17)
and cleanliness (ρ = 0.17). However, these correlation coefficients were relatively low (from
0.08 to 0.18) when compared with job satisfaction. Occupants’ levels of Agreeableness,
Conscientiousness and Openness to Experiences correlate weakly (ρ = 0.08 – 0.17) with most
of the IEQ satisfaction parameters. However, there were a few exceptions where correlations
were stronger. Specifically, satisfaction with overall privacy, the flexibility of dress code and
sound privacy were more strongly correlated with Agreeableness; satisfaction with overall
privacy, air movement and sound privacy was more strongly correlated with
Conscientiousness; and satisfaction with overall privacy, odors and view from the window
was more strongly correlated with Openness to Experiences. Extraversion was weakly
correlated with even fewer IEQ satisfaction parameters. However, comparatively stronger
relationships were found between Extraversion and satisfaction with sound privacy (ρ =
0.14), personal control (ρ = 0.13) and noise level (ρ = 0.13). Lower correlation coefficients
are common when examining relationships between the Big Five personality traits and other
factors. For example, when examining how personality relates to the specific items in the
workspace, significant correlation coefficients were found between 0.21- 0.72 in one study
[55] and 0.13 - 0.20 in another study [39]. Though many coefficients reported here are quite
low, these should be viewed within the context that little is known within the field as to how
these personality traits “typically” relate to environmental satisfaction perceptions like those
measured here. Ideally, there would be a reference point for how the Big Five relate to
outcomes like those measured here [56]. However, this work adds to the small but growing
literature about relationships between personality and building perceptions.
Building and Environment, March 2022, Volume 212 10 https://doi.org/10.1016/j.buildenv.2022.108783
https://escholarship.org/uc/item/84r525hj3.4 Impacts of personal variables on IEQ satisfaction parameters
We further explored the relative impacts of personal factors on each IEQ satisfaction
parameter using a proportional odds ordinal logistic regression approach, as seen in Figure 5.
The odds ratio (OR) in the x-axis represents the chance of a one-scale increase in the IEQ
satisfaction responses (i.e., somewhat satisfied (+1) to satisfied (+2)) and for a one-unit
increase in the personal factors (i.e., life satisfaction score increased from 1 to 2). Further, we
assumed a case to be statistically significant if the 95% confidence interval (CI) does not
overlap the null value (e.g. OR = 1) [51].
In general, we found that occupants’ job satisfaction (OR: 1.3 – 2.3) has the strongest impact
on all 18 IEQ parameters compared to the other personal factors. Its impact was the highest
for satisfaction with cleanliness (OR = 2.3, CI: 1.9 – 2.7), overall environment (OR = 2.1, CI:
1.8 – 2.6), and natural light (OR = 1.8, CI: 1.5 – 2.2) — meaning that people who are most
satisfied with their job are 2 times more likely to report a one-scale point increase in their
satisfaction with the overall environment compared to those who are less satisfied with their
job.
The second most important personal factor for all 18 IEQ satisfaction parameters was life
satisfaction (OR: 1.3 – 2). Meaning that those participants who are more satisfied with their
life, are at least 1.3 times more likely to be satisfied with any of the 18 IEQ satisfaction
parameters (compared to those less satisfied with their life). The results showed that life
satisfaction has the most impact on satisfaction with sound privacy (OR = 2, CI: 1.7 – 2.4),
overall environment (OR = 1.9, CI: 1.6 – 2.3), and overall privacy (OR = 1.8, CI: 1.5 – 2.1).
Our findings showed that none of the Big Five traits yielded an odds ratio higher than 1.5
over the 18 IEQ parameters. In 83 over 90 cases, we observed the odd ratios crossing 1,
meaning that there is an insignificant impact of that personality trait on the corresponding
IEQ satisfaction parameter. In other words, there is no significant difference for that IEQ
satisfaction parameter when it is compared between occupants who are higher or lower in one
personality trait. Further, we found that some cases had an odds ratio of less than 1. This
implies that the occupants who are low in a personality trait has a higher likelihood,
calculated by a reciprocal of the odds ratio (i.e., 1/OR), to improve the corresponding IEQ
satisfaction parameter when compared to those who are high in the same trait.
We found that participants higher in Extraversion were more likely satisfied with their
workspace’s sound privacy (OR = 1.2, CI: 1 – 1.3) when compared to those who are more
introverted. Individuals higher in Agreeableness were more satisfied with the overall
workspace environment (OR = 1.4, CI: 1.1 – 1.7), cleanliness (OR = 1.2, CI: 1 – 1.5), and
natural light (OR = 1.2, CI: 1 – 1.5) compared with those who are less agreeable. Those
higher in Conscientiousness were more likely satisfied with the workspace’s electric light
(OR = 1.3, CI: 1.1 – 1.7)) and cleanliness (OR = 1.2, CI: 1 – 1.5), but less likely satisfied
with overall privacy (OR = 0.8, CI: 0.7 – 1) and sound privacy (OR = 0.8, CI: 0.7 – 1),
compared to those lower in Conscientiousness. Interestingly, we found no significant
difference for any IEQ parameters when examining levels of Emotional Stability. Lastly,
participants higher in Openness tended to be more satisfied with level of personal control
Building and Environment, March 2022, Volume 212 11 https://doi.org/10.1016/j.buildenv.2022.108783
https://escholarship.org/uc/item/84r525hj(OR = 1.2, CI: 1 – 1.4) in workspace when compared with those who were in the less open to
experience group.
Similarly, we found that both sex (OR: 1 – 1.2) and age (OR: 0.9 – 1.2) had little influence on
the 18 IEQ satisfaction parameters. Despite the low odds ratio ranges found for sex, our
findings show that male respondents were more likely satisfied with the workspace’s natural
light (OR = 1.3, CI: 1.1 – 1.6), humidity (OR = 1.3, CI: 1 – 1.6), and glare (OR = 1.3, CI: 1 –
1.6) than female respondents. Meanwhile, older participants were more likely satisfied with
workspaces’ temperature (OR = 1.1, CI: 1 – 1.3) and stuffiness (OR = 1.1, CI: 1 – 1.3), but
less likely satisfied with workspaces’ glare (OR = 0.9 (1/OR = 1.1), CI: 0.8 – 1) when
compared with their younger counterparts.
Building and Environment, March 2022, Volume 212 12 https://doi.org/10.1016/j.buildenv.2022.108783
https://escholarship.org/uc/item/84r525hjFigure 5 Proportional odds ordinal logistic regression on the 18 IEQ satisfaction parameters based on 9 personal factors. The darker and lighter blue dot are, respectively, indicating
the significant and insignificant (i.e., the whisker cut through OR = 1) cases. The whiskers represent the 95% confidence interval.
Building and Environment, March 2022, Volume 212 13 https://doi.org/10.1016/j.buildenv.2022.108783
https://escholarship.org/uc/item/84r525hj4 Discussion
4.1 Job and life satisfaction
Our findings suggest that participants who are more satisfied with their job are 1.3 – 2.3 times more
likely to be satisfied with their workspace environment when compared to those less satisfied;
especially with regards to cleanliness and the overall environment. A substantial correlation between
satisfaction with the overall environment and satisfaction with cleanliness in Singapore workspaces
was also observed in a previous study [17]. As a psychological construct, job satisfaction is
considered to be shaped by a combination of factors: a person’s mental, physical, social and
environmental conditions [57]. Additionally, the workspace environment itself can play an important
role in forming and affecting job satisfaction [21,24]. For instance, office employees who do not
receive adequate appreciation for their work tend to be more dissatisfied with the indoor
environmental quality of their workspace [16]. Further, the more positive an employee is about their
office environment, the less likely they will be to report some sort of physical or psychological
discomfort [58]. This integrated relationship between space and an employee’s perception of their
work may help reveal insights into why, in the current study, those higher in job satisfaction tend to
be more satisfied with all IEQ parameters, especially when it comes to satisfaction with the overall
environment. Given that this is an observational cross-sectional study, we cannot identify which
satisfaction criteria, job or environment, is the cause or effect of this relationship. However, we can
speculate that job and satisfaction with workspace environment and its features may be mutually
supportive. Future work should investigate the direction and intensity of the causal relationship and
potential covariant.
We also found that participants’ life satisfaction was highly correlated with their job satisfaction (ρ =
0.5, p-value ≤ 0.01); thus suggesting these two factors may influence one another as well.
Nevertheless, even when excluding the possible confounding effect of job satisfaction, our results
still suggest that those higher in life satisfaction are more likely (1.3 – 2 times) to also report higher
levels of satisfaction with all the IEQ parameters when compared with those less satisfied with life.
In general, we observed higher (or at least comparable) OR between job – environmental satisfaction
when compared to life – environmental satisfaction; interestingly, exceptions were found with
satisfaction with overall privacy and sound privacy. In our database, up to 76 % of the participants
were located in open plan offices. We speculate that subject’s satisfaction with privacy has a lower
impact to their job satisfaction because these participants have compromised (i.e., higher tolerance
to) the low privacy level in an open plan office. In contrast, it is reasonable to presume that those
participants who worked in private offices could be at the management level, likely paid a higher
salary thus with more resources to navigate life and its challenges, and therefore experiencing a better
quality of life (i.e., higher life satisfaction). A couple of studies have also explored the importance of
privacy on life satisfaction in both workspaces [59] and residential buildings [60].
It is worth noting that life satisfaction is an amalgamation of satisfaction within a number of life
domains, including work, relationships, family, personal development and health. To be high on
overall life satisfaction, one would likely be higher in each of, or the majority of, these domains. But
it’s important to consider that in this work, we are measuring life satisfaction as a whole, and have
only further assessed one of these domains (job satisfaction) in isolation. Examined together, these
findings suggest that perhaps those more satisfied with life, or with their job, may have stronger
tolerance for, and thus may tend to be more satisfied, with their workspace. In the interpretation of
our results, we are utilizing a top-down approach [61], meaning we are inferring that increased
Building and Environment, March 2022, Volume 212 14 https://doi.org/10.1016/j.buildenv.2022.108783
https://escholarship.org/uc/item/84r525hjsatisfaction with one’s life (or their job) would result in higher tolerance and satisfaction with their
workspace environment. But the reverse could also be true; those more tolerant with environments in
general (inside or outside of the workplace) may result in higher satisfaction with life or job
[22,29,35].
4.2 Big Five personality traits
Our findings suggested that those higher in Extraversion were more satisfied with sound privacy
when compared with those less extraverted. Compared to introverts, extroverts tend to be individuals
who are more sociable, talkative, and sensation or activity seeking within their environments [49].
These characteristics may help explain this greater degree for tolerance and satisfaction when it
comes to sound privacy within space. Similar findings in another study also reported that less
extroverted individuals were more sensitive to surrounding noise, as well to sound privacy [62].
We found that those higher in Agreeableness were more likely to be satisfied with the overall
workspace environment, cleanliness and natural light when compared to their less agreeable
counterparts, which it is aligned with a previous study [41]. Those lower in this trait tend to be less
cooperative, more focused on their own needs, and less likely to sympathize or perspective take with
others. Conversely, individuals high in Agreeableness tend to be cooperative and altruistic (among
other things). This regard for others, at times even above and beyond one’s regard for one’s self,
could help explain this difference for tolerance in the space overall.
In our sample, people with higher Conscientious scores proved to be more satisfied with electric light
and cleanliness, but less satisfied with overall privacy and sound privacy. Conscientious individuals
tend to be highly self-disciplined, dutiful, orderly, and organized [49]. It is reasonable to expect that a
person high in this trait may be more likely to keep their own surroundings organized and tidy to
some degree, perhaps tidying their own desk and immediate surroundings more regularly. On the
other hand, those lower in Conscientiousness may be more laid back and less aware of how their
surroundings are organized and maintained, thus caring less about cleanliness and the appearance of
the environment overall. In addition, those lower in this trait may be less deliberate and less likely to
appraise challenges, or more likely to have a stronger tolerance or flexibility in how they respond to
environmental characteristics that could influence privacy (like sound privacy and overall privacy;
see Figure 5). Similar findings also reported that lower conscientious individuals give less attention
to their concern for privacy compared to those higher in Conscientiousness [63].
It is interesting to note that this study yielded no significant differences in IEQ satisfaction and a
person’s level of Emotional Stability. This is counter to what we might expect based on our
knowledge of this trait. People lower in Emotional Stability tend to be more anxious and attuned to
their surroundings (theoretically in an effort to anticipate or mitigate sources of anxiety). Further, in
adjacent work looking at how the Big Five manifest within physical space, we tend to see Emotional
Stability present through the types of and arrangement of items within one’s surrounding
[36,39,55,64]. Therefore if Emotional Stability is linked to the types of things one puts into their
space, it is surprising to see it does not appear to influence one’s impressions of their surroundings.
We are currently unable to provide a solid answer for this finding, but it is worth further investigation
for similar studies in the future.
Lastly, we observed that people who are more Open to Experience were also more likely satisfied
with their level of personal control in the workspace. People high in this trait tend to be more
comfortable with abstract (vs. black and white) thinking and tend to be more accepting of cultures,
Building and Environment, March 2022, Volume 212 15 https://doi.org/10.1016/j.buildenv.2022.108783
https://escholarship.org/uc/item/84r525hjbehaviour, and lifestyles that differ from their own [49,65]. Shared space by definition requires
individuals to be with, and possibly influenced by, others. Perhaps those higher in Openness (i.e.,
more likely to not only accept, but even thrive, with parameters outside their immediate control, like
other individuals) are more able to adapt and need less personal control over these types of spaces.
Overall, these links between traits and perceptions of space are reasonable when considering the Five
Factor model of personality. It is believed that these traits interplay with our personal motives and
needs to inform and dictate the way we think, feel, and behave in our daily lives [66]. Winter et al.
theorize that personality traits act as a channel through which our motivations can be expressed in our
daily environments [66]. If spaces help support people’s daily motives and needs, by furthering our
understanding of the links between personality traits and physical space, we unlock deeper
understanding of not only how people relate to their environments, but potentially, how we can create
environments that are most supportive to the individual’s using them.
4.3 Sex and age
Despite the small odds ratios in general, our analyses revealed that males are more satisfied than
females in satisfaction with humidity, natural light, and glare. Similar findings are also reported in
another study using a predominantly North American POE database, which indicated that females
were more likely to be dissatisfied with the majority of the IEQ parameters analysed compared to
males, except with regards to overall environmental satisfaction. [67]. There could be a number of
reasons for findings like these. There is some evidence supporting this difference in sensitivity with
regards to thermal conditions [14], stuffy air [68], lighting and privacy [69], and other environmental
irritations [70]. Differences like these could indicate a more refined ability for women to detect IEQ
variance compared to men. But before drawing strong conclusions about sex differences, we should
also consider the evolution and history of the workforce, and thus the design of the common office
space. It is only in the past 2-3 decades that women have begun to equal men in the workforce [71].
Because of this gender gap, it’s reasonable to make the hypothesis that workspaces in general, and
the policies for these spaces, may not have been designed with women, or gender equality, in mind.
In addition to workplace and workforce culture, geographic culture also likely plays a role in
differences between sexes at work. We caution against drawing any clear individual differences in
psychological perceptions between the sexes without more substantial cultural investigation,
historical framing, and proper design of experiments that allow for the control of confounders and
causative analysis.
Although some studies show that younger occupants, compared to those that are older, are more
likely to be dissatisfied with the thermal environment, odors, and noise [14,68], our analyses did not
reveal significant differences with regards to age for most of the indoor environmental parameters.
We observed that older respondents were more satisfied with workspace temperature and stuffiness,
but dissatisfied with workspace glare compared to younger individuals. Most surveys conducted in
this study were in open plan offices, but we also surveyed senior-level employees (usually older in
age) who occupied enclosed offices with personal control over the air conditioning system. These
factors could explain why elder occupants were more satisfied with workspace temperature and
stuffiness. Physiology and the typical ageing processes are most likely the reason behind higher
dissatisfaction with glare for older occupants. Ageing eyes may change the shape of one’s lenses
which can cause scattered incident light rather than focused light on the retina, thus resulting more
glare. In addition, research shows older occupants with ageing eyes require three times longer to
recover from glare exposure compared to their younger counterparts [72]. Cataracts, common for
Building and Environment, March 2022, Volume 212 16 https://doi.org/10.1016/j.buildenv.2022.108783
https://escholarship.org/uc/item/84r525hjolder individuals, could also contribute to issues with glare [73]. In contrast, some other recent
studies reported opposite findings, showing that younger populations are more sensitive and likely to
complain about glare compared to older individuals [74,75]. Occupants’ age in the current study does
not appear to affect satisfaction with IEQ in a consistent and substantial way; which is aligned with
another large scale POE project [12].
4.4 Impacts to overall workspace environment
We examined the impact of occupants’ satisfaction with the overall workspace environment with
both those personal factors that were significant (i.e., job satisfaction, life satisfaction and
Agreeableness in Figure 5) and satisfaction with the 17 IEQ parameters. Detailed analyses on the
impact of the 17 IEQ satisfaction parameters to overall environment satisfaction in workspace have
been analysed and discussed in a previous study [17].
The results, shown in Figure 6, suggest that overall workspace satisfaction has a positive impact on
individual’s satisfaction with cleanliness (OR = 2.1, CI: 1.7 – 2.6), noise level (OR = 1.5, CI: 1.3
– 1.8), electric light (OR = 1.4, CI: 1.1 – 1.7), flexibility in dress code (OR = 1.4, CI: 1.2 – 1.6),
furnishings (OR = 1.3, CI: 1.2 – 1.5), personal control (OR = 1.3, CI: 1.1 – 1.5), sound privacy (OR =
1.2, CI: 1.1 – 1.4), air movement (OR = 1.2, CI: 1 – 1.5), natural light (OR = 1.2, CI: 1 – 1.4), and
views from a window (OR = 1.2, CI: 1 – 1.4). Compared with Figure 5, the impacts on satisfaction
with overall environment and job satisfaction (OR = 1.2, CI: 1 – 1.5), life satisfaction (OR = 1, CI:
0.8 – 1.2) and Agreeableness (OR = 1.2, CI: 1 – 1.3) were substantially lower. We anticipated this
change is due to a stronger correlation observed between the overall environment satisfaction and the
satisfaction with other IEQ parameters (ρ = 0.41 – 0.67) (values presented in a previous study [17])
than the correlation with job satisfaction (ρ = 0.54), life satisfaction (ρ = 0.36) and Agreeableness (ρ
= 0.15) (see Figure 5). Regardless of the drop in the odds ratio, job satisfaction in Figure 6 remains
an impactful variable in determining occupant’s satisfaction with the overall workspace environment.
Therefore, we recommend including job satisfaction as a core question in future POE assessments
because of its significance to the satisfaction with overall workspace environment. Inclusion of this
variable could allow for better prediction of overall environmental satisfaction in the workplace.
Building and Environment, March 2022, Volume 212 17 https://doi.org/10.1016/j.buildenv.2022.108783
https://escholarship.org/uc/item/84r525hjFigure 6 Proportional odds ordinal logistic regressions for the overall workspace environment satisfaction based on
personal factors and participants’ satisfaction with 17 IEQ parameters. Representations of the dot colour and whiskers are
the same as in Figure 5.
5 Limitations
There are some limitations to this study. First, this is an observational study. The major limitation of
an observational study is its inability to show the cause-and-effect association between dependent
(IEQ satisfaction) and independent variables (personal factors). We assumed the directional
relationship (i.e., personal factors affect subject IEQ satisfaction responses) based on limited
evidence in the literature and this may lead to biased effect estimations. Secondly, due to
under-exploration in this field, in particular the links between occupants’ IEQ satisfaction and their
life satisfaction and personality, it is possible that there are some undiscovered confounders in our
conceptual model (Figure 1). Nevertheless, our findings confirmed correlational relationships
between psychological factors and occupant satisfaction. These results could be useful evidence for
future causal research with better experimental control. Lastly, we assumed the 7-point satisfaction
scale as numeric inputs, i.e., very satisfied (+3), neither satisfied nor dissatisfied (0), and very
dissatisfied (-3), in our analysis. This scaling may not be typical in all disciplines, but similar
numeric transformations are commonly applied in multiple previous studies in the literature.
6 Conclusion
We conducted a post-occupancy evaluation (POE) assessment in 9 commercial buildings in
Singapore (1162 respondents), to evaluate the impact of their satisfaction with life, satisfaction with
job and personality traits on occupant’s indoor environmental quality (IEQ) satisfaction. These
analyses have rarely been explored in the field. Occupants were most satisfied with electric light (S%
= 85 %), cleanliness (84 %), and flexibility of dress code (80 %), while mostly dissatisfied with
sound privacy (D% = 42 %), personal control (25 %), and overall privacy (25 %). We found 50 % and
75 % of the participants were satisfied with their life and current job, respectively. Participants in our
database were higher in Agreeableness (mean [s.d.] = 5.06 [0.94]), Conscientiousness (5.26 [1]),
Emotional Stability (5.01 [1.06]), and Openness to Experiences (4.71 [0.91]), while the sample
reflected a more normal distribution with regards to Extraversion (3.99 [1.20]).
By applying an ordinal odds logistic regression, we found occupants’ job satisfaction has the largest
impact, while life satisfaction has the second-highest impact, on satisfaction with the overall
environment. We suspected increased satisfaction with one’s job and life would result in higher
satisfaction and tolerance with the workspace environment. However, a reverse explanation could
also be valid. This study cannot identify the actual cause and effect of this relationship. In general,
the Big Five personality traits have low correlations with most of the IEQ satisfaction parameters.
Nevertheless, our findings showed that those higher in Extraversion were more satisfied with sound
privacy; those higher in Agreeableness were more likely to be satisfied with the overall workspace
environment, cleanliness and natural light; those higher in Conscientious were more satisfied with
workspace’s electric light and cleanliness, but less satisfied with overall privacy and sound privacy;
and those higher in Openness to Experience were more satisfied with the level of personal control in
the workspace. Interestingly, we did not observe any significant impact on IEQ satisfaction and a
person’s level of Emotional Stability. Due to a substantially higher impact of job satisfaction on
overall workspace environment satisfaction compared with other IEQ satisfaction parameters, we
recommend including job satisfaction as a core question in future POE assessments.
Building and Environment, March 2022, Volume 212 18 https://doi.org/10.1016/j.buildenv.2022.108783
https://escholarship.org/uc/item/84r525hj7 Acknowledgement
This research was funded by the Republic of Singapore's National Research Foundation through a
grant to the Berkeley Education Alliance for Research in Singapore (BEARS) for the
Singapore-Berkeley Building Efficiency and Sustainability in the Tropics 2 (SinBerBEST2) Program.
BEARS has been established by the University of California, Berkeley as a center for intellectual
excellence in research and education in Singapore. We would like to thank Dr. Michael Kent for
reviewing the manuscript.
8 References
[1] Y. Al horr, M. Arif, M. Katafygiotou, A. Mazroei, A. Kaushik, E. Elsarrag, Impact of indoor
environmental quality on occupant well-being and comfort: A review of the literature,
International Journal of Sustainable Built Environment. 5 (2016) 1–11.
https://doi.org/10.1016/j.ijsbe.2016.03.006.
[2] P. Wargocki, M.J. Frontczak, S. Schiavon, J.D. Goins, E. Arens, H.L. Zhang, Satisfaction and
self-estimated performance in relation to indoor environmental parameters and building
features, in: Proceedings of 10th International Conference on Healthy Buildings, Brisbane,
2012.
[3] A. Astolfi, F. Pellerey, Subjective and objective assessment of acoustical and overall
environmental quality in secondary school classrooms, J Acoust Soc Am. 123 (2008) 163–173.
https://doi.org/10.1121/1.2816563.
[4] L. Huang, Y. Zhu, Q. Ouyang, B. Cao, A study on the effects of thermal, luminous, and acoustic
environments on indoor environmental comfort in offices, Building and Environment. 49 (2012)
304–309. https://doi.org/10.1016/j.buildenv.2011.07.022.
[5] M.A. Humphreys, Quantifying occupant comfort: are combined indices of the indoor
environment practicable?, Building Research & Information. 33 (2005) 317–325.
https://doi.org/10.1080/09613210500161950.
[6] H.-H. Liang, C.-P. Chen, R.-L. Hwang, W.-M. Shih, S.-C. Lo, H.-Y. Liao, Satisfaction of
occupants toward indoor environment quality of certified green office buildings in Taiwan,
Building and Environment. 72 (2014) 232–242. https://doi.org/10.1016/j.buildenv.2013.11.007.
[7] L.T. Wong, K.W. Mui, P.S. Hui, A multivariate-logistic model for acceptance of indoor
environmental quality (IEQ) in offices, Building and Environment. 43 (2008) 1–6.
https://doi.org/10.1016/j.buildenv.2007.01.001.
[8] P.M. Bluyssen, M. Aries, P. van Dommelen, Comfort of workers in office buildings: The
European HOPE project, Building and Environment. 46 (2011) 280–288.
https://doi.org/10.1016/j.buildenv.2010.07.024.
[9] M. Frontczak, S. Schiavon, J. Goins, E. Arens, H. Zhang, P. Wargocki, Quantitative
relationships between occupant satisfaction and satisfaction aspects of indoor environmental
quality and building design, Indoor Air. 22 (2012) 119–131.
https://doi.org/10.1111/j.1600-0668.2011.00745.x.
[10] M. Kwon, H. Remøy, M. van den Bogaard, Influential design factors on occupant satisfaction
with indoor environment in workplaces, Building and Environment. 157 (2019) 356–365.
https://doi.org/10.1016/j.buildenv.2019.05.002.
[11] K. Schakib-Ekbatan, A. Wagner, C. Lussac, Occupant satisfaction as an indicator for the
socio-cultural dimension of sustainable office buildings – Development of an overall building
index, Proceedings of Conference: Adapting to Change: New Thinking on Comfort, WINDSOR
2010. (2010).
[12] S. Schiavon, S. Altomonte, Influence of factors unrelated to environmental quality on occupant
satisfaction in LEED and non-LEED certified buildings, Building and Environment. 77 (2014)
148–159.
Building and Environment, March 2022, Volume 212 19 https://doi.org/10.1016/j.buildenv.2022.108783
https://escholarship.org/uc/item/84r525hjYou can also read