Indirect Impacts of COVID-19 on a Tropical Lobster Fishery's Harvest Strategy and Supply Chain
←
→
Page content transcription
If your browser does not render page correctly, please read the page content below
ORIGINAL RESEARCH
                                                                                                                                            published: 16 June 2021
                                                                                                                                   doi: 10.3389/fmars.2021.686065

                                            Indirect Impacts of COVID-19 on a
                                            Tropical Lobster Fishery’s Harvest
                                            Strategy and Supply Chain
                                            Éva Plagányi 1,2* , Roy Aijun Deng 1 , Mark Tonks 1 , Nicole Murphy 1 , Sean Pascoe 1,2 ,
                                            Steven Edgar 3 , Kinam Salee 1 , Trevor Hutton 1 , Laura Blamey 1 and Leo Dutra 1,2
                                            1
                                             Queensland Bioscience Precinct (QBP), CSIRO Oceans and Atmosphere, Brisbane, QLD, Australia, 2 Centre for Marine
                                            Socioecology, University of Tasmania, Hobart, TAS, Australia, 3 Ecosciences Precinct, CSIRO National Collections and
                                            Marine Infrastructure, Brisbane, QLD, Australia

                                            The Torres Strait tropical rock lobster Panulirus ornatus (TRL) fishery is of immense
                                            social, cultural and economic importance to the region’s Indigenous fishers from
                                            both Australia and Papua New Guinea (PNG). During 2020, the COVID-19 pandemic
                                            indirectly impacted this fishery as well as a number of other fisheries reliant on
                                            international export markets. The TRL fishery is managed using an empirical (data-
                                            based) Harvest Control Rule (eHCR) to rapidly provide a recommended biological catch
                                            (RBC), based on catch, fishery-independent survey indices and catch-per-unit-effort
                                            (CPUE). Here, we summarize the impacts of COVID-19 on each of these critical data
                                            inputs and discuss whether the eHCR was considered adequately resilient to this
                          Edited by:
                    Tommaso Russo,
                                            unprecedented disruption to the system. Next, we use a quantitative supply chain
  University of Rome Tor Vergata, Italy     index to analyze the impact of disruptions to the supply chain, and inform on potential
                      Reviewed by:          adaptation strategies. The catch and CPUE data were impacted to varying degrees
                 Giuseppe Scarcella,        by external constraints influencing fishing effort, but the fishery-independent survey
National Research Council (CNR), Italy
                     Peter Goethals,        wasn’t affected and hence there remains an unbroken survey time-series for the fishery
            Ghent University, Belgium       extending back to 1989. The eHCR was shown to be reasonably robust because it
                 *Correspondence:           incorporates longer-term trends over a 5-year period, and accords substantially more
                          Éva Plagányi
          eva.plaganyi-lloyd@csiro.au
                                            weighting (80%) to the fishery-independent survey rather than CPUE data which can be
                                            affected by trade and other disruptions. Despite the eHCR not having been tested for
                  Specialty section:        scenarios such as a global pandemic, this robustness is a positive given the types of
        This article was submitted to
        Marine Fisheries, Aquaculture
                                            disruptions we will likely face in future climate. The weak links identified in the supply
               and Living Resources,        chain were the same as those previously highlighted as sensitive to climate change
              a section of the journal
                                            disruptions. Our supply chain analysis quantifies the impact on system resilience of
         Frontiers in Marine Science
                                            alternative paths connecting producers to consumers and reinforces that supply chains
           Received: 26 March 2021
            Accepted: 24 May 2021           may be particularly vulnerable to external disruptions if they are not sufficiently diverse.
           Published: 16 June 2021
                                            Keywords: decision rules, fishery markets, fishery-independent survey, pandemic, MSE, fishery export
                              Citation:
       Plagányi É, Deng RA, Tonks M,
       Murphy N, Pascoe S, Edgar S,
      Salee K, Hutton T, Blamey L and
                                            INTRODUCTION
    Dutra L (2021) Indirect Impacts of
      COVID-19 on a Tropical Lobster
                                            The COVID-19 pandemic (Hui et al., 2020) has indirectly led to severe economic impacts on global
Fishery’s Harvest Strategy and Supply       and Australian seafood industries (Bennett et al., 2020). This has included disruptions in shipping
     Chain. Front. Mar. Sci. 8:686065.      activity (Huveneers et al., 2021; Notteboom et al., 2021), global markets (Knight et al., 2020),
     doi: 10.3389/fmars.2021.686065         food security (Steenbergen et al., 2020) and negatively impacted on commercial fisher’s health and

Frontiers in Marine Science | www.frontiersin.org                                 1                                           June 2021 | Volume 8 | Article 686065
Plagányi et al.                                                                                              COVID-19 Impacts on Lobster Fishery

wellbeing as well as added to the challenges of protecting                also evaluate how well the harvest control rule, management
workers on fishing vessels (Sorensen et al., 2020). A recent              system and supply chain were able to respond to the challenges
review highlighted widespread heterogenous ramifications on               that resulted due to the pandemic. To analyze the supply chain,
United States fisheries (White et al., 2021). The risk of crowding        we use a modeling approach that accounts for the relative
and inadequate physical distancing during fishery operations has          movement of product through nodes and links in a supply chain,
been identified as a key challenge impacting fisheries during             to theoretically identify vulnerable elements in the supply chain
COVID-19 (Okyere et al., 2020).                                           (Plagányi et al., 2014) and evaluate how this concurs with what
   There has also been a major impact on scientific data                  actually eventuated in response to COVID-19 disruptions, as well
collection in some areas of the world, such as in the United States       as analyzing ways to improve the resilience of supply chains.
where scientists were forced to cancel most of their major
research cruises and surveys in 2020 (Link et al., 2021). Link
et al. (2021) reported that the United States alone had to cancel         The Torres Strait Tropical Rock Lobster
over 50 fisheries surveys resulting in a loss of over 1,500 on-           Fishery
the-water days-at-sea. Although Australia was also impacted by            The TRL fishery provides an important source of income for
the COVID-19 pandemic, localized outbreaks were contained                 more than 400 Torres Strait Islander license holders and many
relatively quickly, resulting in only a brief core “lockdown”             island communities, as well as supporting a non-Islander sector.
(Huveneers et al., 2021) and hence activities such as fishing             Fishing in the Torres Strait is governed by the Torres Strait
and surveys were impacted less than was the case for many                 Fisheries Torres Strait Fisheries Act (1984), which protects the
other countries.                                                          way of life and livelihood of traditional inhabitants.
   The focus of this study is the disruption caused by COVID-                 The TRL stock is shared with adjacent fisheries in
19 to the main export market for Australian seafood producers,            Papua New Guinea (PNG) and on the northern Queensland
and subsequent impacts on the fisheries supplying these markets.          coast (Figure 1). The Australian and PNG Torres Strait catch
The Chinese market accounts for almost 70 per cent of Australia’s         has averaged 673 t live weight since 1989. The Australian
$1.2 billion total seafood exports (FRDC, 2020). Three quarters           Torres Strait catch is important economically to all sectors,
of the seafood export market to China is live rock lobster,               and contributes to a lucrative export market for live lobsters to
with most of the eight major lobster fisheries (Figure 1) reliant         China (Figure 2).
on exports. These exports were severely impacted during 2020,                 Fishery-independent monitoring of the TRL population has
along with other high-value species including abalone, coral trout        been carried out annually from 1989 to 2020. These surveys
Plectropomus spp. and live eel (Catizone, 2020). As a result,             provide long-term information on the relative abundance of
there were short-term declines in catches around Australia of             recruiting (1+) lobsters. Prior to the introduction of mandatory
these species (Huveneers et al., 2021). Even before the World             logbooks in the largely non-Indigenous transferable vessel holder
Health Organization (WHO) declared COVID-19 a world-                      (TVH) sector and subsequently the docket book system in the
wide public emergency, the global market for spiny lobsters,              Indigenous traditional inhabitant boat (TIB) sector in 2003,
valued at United States $912 million in China alone, was halted           these surveys also provided the only long-term information
because 90% of these high value lobsters are exported to China            on the relative abundance of fished (age class 2+) lobsters
(Knight et al., 2020).                                                    (Dennis et al., 2015).
   Primary industries such as fisheries are vulnerable not only               The TRL fishery transitioned to an output control system
to environmentally-induced shocks to their production phases              on 1 December 2018, which requires the setting of a total
but also to risks across the entire supply chain from supplier            allowable catch (TAC). The harvest strategy uses a conservative
to consumer. This is also because in our highly globalized                biomass target reference point that takes into account that the
modern society, products such as lobsters are rarely consumed             resource is shared and important for the traditional way of life
at the point where they are caught, but require being moved               and livelihood of traditional inhabitants and is biologically and
along progressively longer and more complex supply chains,                economically acceptable. Other management measures include a
to be consumed in distant domestic and international markets.             ban on trawlers taking lobsters, a minimum size limit (90 mm
A holistic approach to managing risk is therefore valuable                carapace length), periodic closure of the fishery to the use
as supply chain components are interrelated and mutually                  of hookah (surface air supply) gear around specified new
dependent (Lim-Camacho et al., 2015; Rosales et al., 2017;                and full moon periods, prohibition of use of hookah during
Ghadge et al., 2020; Farmery et al., 2021). An improved                   December to January, as well as a full closure during October to
understanding of supply chain design on the degree of resilience          November each year.
or vulnerability to disruptions may shed light on improved                    The stock is naturally highly variable due to variability in
risk management and ways to reconfigure more resilience and               the numbers of recruits (1+ lobsters) each year, and the fishers
competitive supply chains (Lim-Camacho et al., 2017).                     catch mostly a single age-class (2+) only (Plagányi et al., 2019).
   The science needed to support major shocks to fisheries                The unfished 2+ lobsters leave the Torres Strait at the end of
and markets remains a challenge (FAO, 2020a,b; Link et al.,               August-September to breed (Skewes et al., 1994). Hence, a TAC
2021). In this article we use the Torres Strait tropical rock             needs to be set annually in such a way as to ensure biological
lobster Panulirus ornatus (TRL) fishery as a case study and               and economic sustainability consistent with the principles
summarize impacts of COVID-19 and subsequent outcomes. We                 of the Australian Commonwealth Harvest Strategy Policy

Frontiers in Marine Science | www.frontiersin.org                     2                                      June 2021 | Volume 8 | Article 686065
Plagányi et al. COVID-19 Impacts on Lobster Fishery
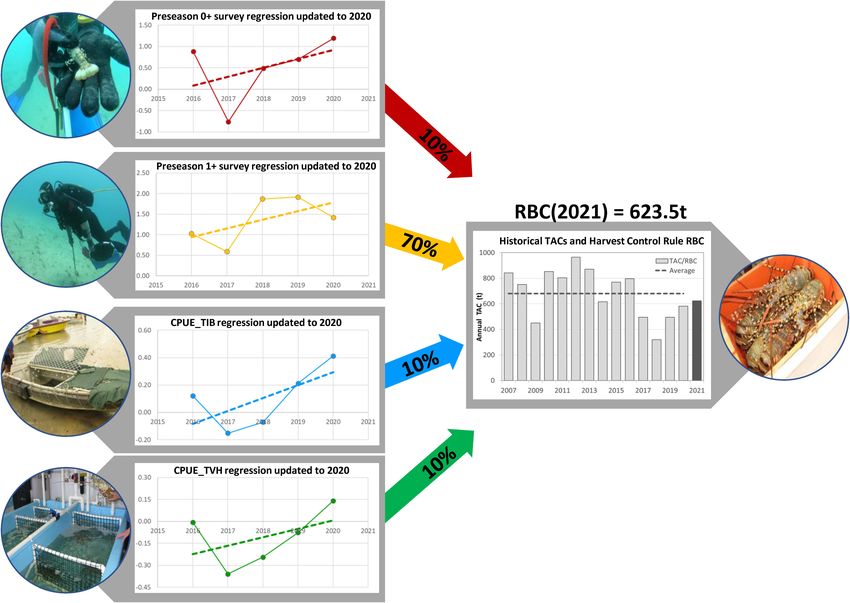
FIGURE 1 | Map of Australia and Papua New Guinea showing location of the Torres Strait tropical rock lobster dive fishery and linked Queensland (QLD) tropical
lobster fishery as well as the six other major lobster trap-based fisheries as summarized in Plagányi et al. (2018), namely Eastern rock lobster Sagmariasus verreauxi,
southern rock lobster Jasus edwardsii from Victorian (Vic), Tasmania (Tas), South Australia (SA) southern and northern zones and West Australia rock lobster
P. cygnus.
(Australian Government Department of Agriculture and Water component of the Harvest Strategy. It was simulation tested to be
Resources, 2018) as well as the TRL fishery and Protected Zone robust to a number of uncertainties and shocks, but not to the
Joint Authority (PZJA) objectives. For this reason, the annual ramifications of a global pandemic.
fishery-independent survey of 1+ recruits is now conducted as
close to the start of the fishing season as possible (during the
November neap tides) to allow estimation of the likely size of the MATERIALS AND METHODS
fishable stock the next year (Dennis et al., 2015). Previously, this
information together with all other sources of information and External Drivers Influencing the TRL
data for the fishery were input to an integrated stock assessment Fishery
model that was used to set the TAC (Plagányi et al., 2020b). During the 2020 fishing season, there were a number of
In December 2019, new harvest strategies were implemented unprecedented external drivers that influenced fishing effort. We
for important Torres Strait fisheries including the lobster and collated information on these through informal conversations
bêche-de-mer fisheries (Plagányi et al., 2018, 2020c; PZJA, 2019). with fishers, managers and processors. We verified information
The strategies included some major changes to data collection as to the impacts of changes in border regulations, charter
methods and scientific assessments to ensure ongoing fishery flight availability and export demand by cross-checking with
and ecological sustainability and economic growth; important for formal government announcements, such as from the Ministry
the welfare of hundreds of fishers, regional-based processors and of Agriculture and Rural Affairs as well as through more
local and national sellers that depend on these resources. formal reporting of disruptions at several Tropical Rock Lobster
For TRL, the harvest strategy outlines the objectives, Resource Assessment Group (TRLRAG) meetings held via
monitoring requirements, stock assessment model, empirical teleconference through the year (TRLRAG, 2020). The TRLRAG
(data-based) Harvest Control Rule (eHCR) and reference forum includes Indigenous fishers and their representative
points (PZJA, 2019). The eHCR is used to rapidly provide a bodies, non-Indigenous fisher representatives and flow-on
recommended biological catch (RBC) once the catch, survey business stakeholders, federal and state fisheries managers, and
indices and other data inputs (CPUE or catch-per-unit-effort) scientists. In addition to information on changes in beach
become available (Plagányi et al., 2018). The eHCR is a central prices shared by processors, we verified these decreases from
Frontiers in Marine Science | www.frontiersin.org 3 June 2021 | Volume 8 | Article 686065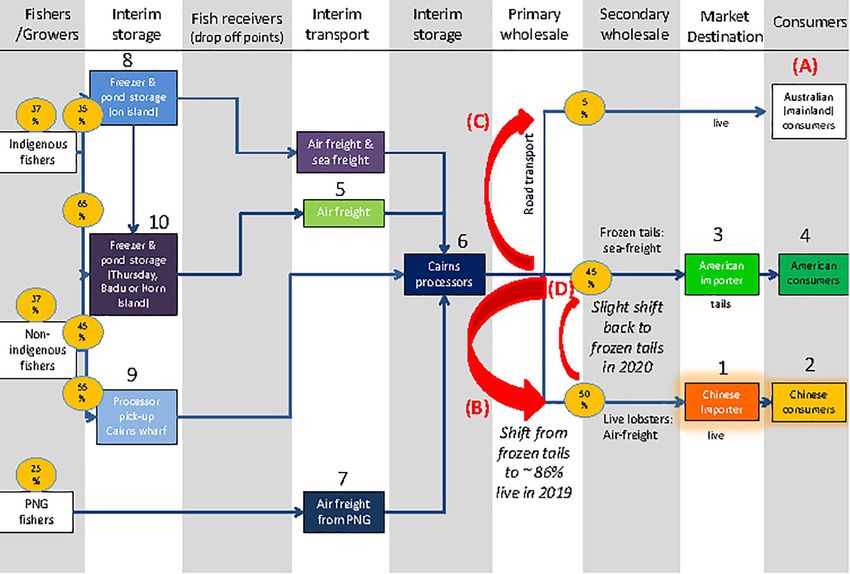
Plagányi et al.                                                                                                                  COVID-19 Impacts on Lobster Fishery

  FIGURE 2 | Torres Strait tropical lobster 2012 supply chain schematic modified from Plagányi et al. (2014), highlighting with a red arrow the post-2012 shift to
  exporting almost all live lobsters, and a small reversal of that market shift during 2020. The large numbers next to nodes show the ranking of the top ten critical
  elements in the supply chain (orange highlights the most critical node) based on applying the Supply Chain Index method of Plagányi et al. (2014). The figure shows
  the 2012 base configuration (A) as well as variants (B) shift to more live; (C) increase domestic market and (D) greater domestic market and product split between
  live and tails, as discussed in the text.

restaurant advertisements. We extracted information on total                           the same methods as applied previously (Deng et al., 2020b,c;
seafood exports and value from the Australian Fisheries Research                       Plagányi et al., 2020b).
and Development Corporation (FRDC) Seafood Production
and Trade Database.
                                                                                       eHCR and Final Management Advice
                                                                                       The eHCR formula outputs a RBC in December for the
Impacts on the Scientific Process and                                                  following year. This calculation is the multiple of the average
Survey                                                                                 catch over the last 5 years and a statistic which measures
The indirect impacts of COVID-19 on the scientific process and                         the relative performance of the fishery based on the following
data collection were also considered. A number of contingency                          five data inputs: (1) Fishery-independent recruiting lobster
plans were reviewed, and COVID-safe measures implemented to                            (1+) standardized relative numbers; (2) Fishery-independent
ensure the highest probability of the survey being conducted in a                      recently-settled lobster (0+) standardized relative numbers; (3)
consistent and safe manner not only to the survey and boat crew                        standardized CPUE for TIB sector; and (4) standardized CPUE
but also to communities in Torres Strait.                                              for TVH sector; and (5) total catch (TIB, TVH, and PNG) (using
                                                                                       data available up until end of October). Different weightings are
                                                                                       applied to the four abundance indices included in the relative
Fishery Data                                                                           performance statistic used in the eHCR, based on extensive
As in previous years, the fishery catch and effort data for the                        testing to compare performance of alternative weightings and
Australian share of the fishery were provided by the Australian                        also considering the information content and reliability of each
Fisheries Management Authority (AFMA), and the totals and                              series, as well as a preference expressed by the stakeholders to
monthly distribution compared with that of previous years. The                         use a portfolio approach in determining the RBC (Plagányi et al.,
monthly catch totals from the PNG sector for the months January                        2018). The Preseason 1+ index is the primary index and is most
to September were provided by the PNG National Fisheries                               reliable and direct in terms of indexing the biomass of lobsters
Authority. As agreed previously by the TRLRAG, these values                            that will be available to be caught in the next fishing season.
were linearly extrapolated to obtain an annual total catch for use                     Hence, this index is assigned the highest weighting of 70%. The
as an input to the eHCR. The CPUE data were standardized using                         Preseason 0+ index provides an early indication of the following

Frontiers in Marine Science | www.frontiersin.org                                  4                                             June 2021 | Volume 8 | Article 686065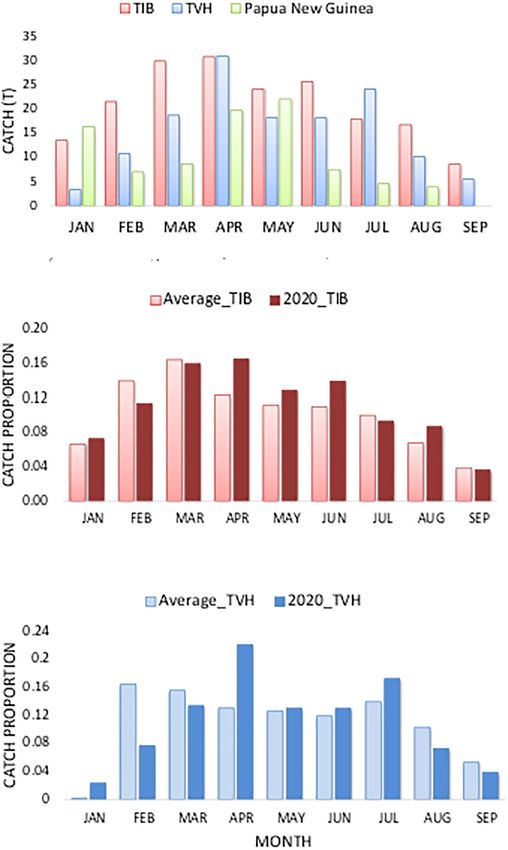
Plagányi et al.                                                                                                  COVID-19 Impacts on Lobster Fishery

year’s recruitment, whereas the CPUE indices aim to index the               tail product. There were also efforts to increase sales of lobster on
relative abundance of the large 2+ lobsters, the survivors of which         the domestic market and hence we also investigate the impacts of
will migrate out of the Torres Strait to spawning grounds to the            greater diversification of the supply chain.
East. Each of these three secondary indices [Survey 0+ and CPUE                 We also acknowledge that since 2012 there have been other
(TIB and TVH)] is assigned a weighting of 10% (30% total) in                positive increases in diversification of the supply chain in the
the eHCR formula.                                                           form of additional processors. This increased supply chain
   Simulation testing (Plagányi et al., 2016) showed that the best          complexity would increase the resilience score, but is beyond
approach is to use the slope of the trends in the secondary indices         the scope of this paper which focuses on changes in the final
over the last 5 years’ data (after first taking the natural logarithm       market destinations.
of the data) for each of the abundance indices. This allows the                 To analyze the resilience of alternative supply chain
RBC to be based on medium term trends in abundance, rather                  configurations to external disruptions, we used the Supply
than on just the current abundance.                                         Chain Index (SCI) from Plagányi et al. (2014) (see
   Hence the HCR rule is as follows:                                        Supplementary Material).
                                                                          In this study, we compare the critical elements and supply
                            presurv,1                   presurv,0
  RBCy+1 = 0.7 · 1 + sy                 + 0.1 ·    1 + sy           +       chain resilience score under the 2012 base configuration [scenario
                                                                            (A)] with three alternative scenarios (Figure 2):

            1 + sCPUE,TVH
                 y         +  1 + sCPUE,TIB
                                   y            · C̄y−4,y        (1)        (B) A pre-COVID-19 (2019) scenario with almost all live
                                                                                exports, few tails (14%) and small (5%) domestic market;
where                                                                       (C) An illustrative scenario with increased domestic market
   C̄y−4,y is the average achieved catch during the past 5 years,               (25%) and rest mostly exported overseas as live product;
including the current year; i.e., from year y-4 to year y,                      and
    presurv,1
   sy         is the slope of the (logarithms of the) fishery-              (D) An optimized scenario (manipulated to increase the
independent survey 1 year abundance index, based on the five                    resilience score), with a large (50%) domestic share, and
most recent values;                                                             the rest split evenly between the international markets for
    presurv,0
   sy         is the slope of the (logarithms of the) fishery-                  frozen tails and live lobsters.
independent survey 0 year abundance index, based on the five                   The simplified representation shown in Figure 2 has 15
most recent values;                                                         elements and 16 links which are assumed constant in the scenario
   syCPUE,TVH , sCPUE,TIB
                 y        is the slope of the (logarithms of the)           analysis—here we test only the implications of altering the
TVH and TIB CPUE abundance index, based on the five                         magnitude of flows in the network.
most recent values.

Supply Chain Resilience                                                     RESULTS
To inform analyses around the impacts of COVID-19 on the
TRL supply chain, we used as a base example the simplified                  External Drivers Influencing the Fishery
structure of Plagányi et al. (2014), which captures the key                 In response to COVID-19, the last regular live tropical lobster
processes and activities describing the system connections from             shipment to China left on 26 January 2020, just before the
the point at which lobsters are first landed to the point at which          ban on live markets took effect and there was a considerable
they are consumed (Figure 2). The simplified representation                 pause in international exports of lobster from both Australia and
enables structured analysis, even though we acknowledge that                PNG. This was revoked by the 6th February indirectly as live
behind these models are complex business structures and                     seafood was allowed into China as an exception. This period is
industry relationships.                                                     usually a time of high demand with peak prices for lobster and
    The base example from Plagányi et al. (2014) was developed              other Australian seafood due to the Chinese New Year (Plagányi
for TRL using data describing fishery operations around 2012.               et al., 2017). Following the declaration by WHO of a pandemic,
There have since been a number of important changes to the TRL              the Australian Government closed its international air and sea
fishery, including changes in allocations per sector, management            borders on 20 March, negatively impacting freight availability.
controls and market shifts. However, the focus here is on the                  Operators around Australia were left with live catches of
market outlets for lobsters, and over the past decade there has             several species waiting for export. Average prices for exported
been a substantial transition from frozen tail to live product:             TRL lobster reportedly dropped 75–80 per cent (Plagányi et al.,
the Australian sector’s overall proportion of tailed product has            2020a). In some cases there were large backlogs of seafood in
decreased from around 58% down to 14% (Deng et al., 2020a).                 holding tanks and a switch to exporting less-valuable frozen
This added significant value to the fishery given that the tail             product (Plagányi et al., 2020a). This was also the case for all
represents only ∼40% of the lobster by weight and live product              other major Australian lobster fisheries, live fish exports such as
fetches ∼30% higher $/kg at market (Hutton et al., 2016; Plagányi           coral trout and shellfish such as abalone, all of which are subject to
et al., 2017). However, when COVID-19 brought fishery exports               Australia’s strict export laws. In response to the inability to freight
to a standstill in February 2020, fishers (particularly the PNG and         produce overseas, short-term declines in catches were observed
TIB sectors) were forced to again convert some lobsters to frozen           for some fisheries (Huveneers et al., 2021).

Frontiers in Marine Science | www.frontiersin.org                       5                                        June 2021 | Volume 8 | Article 686065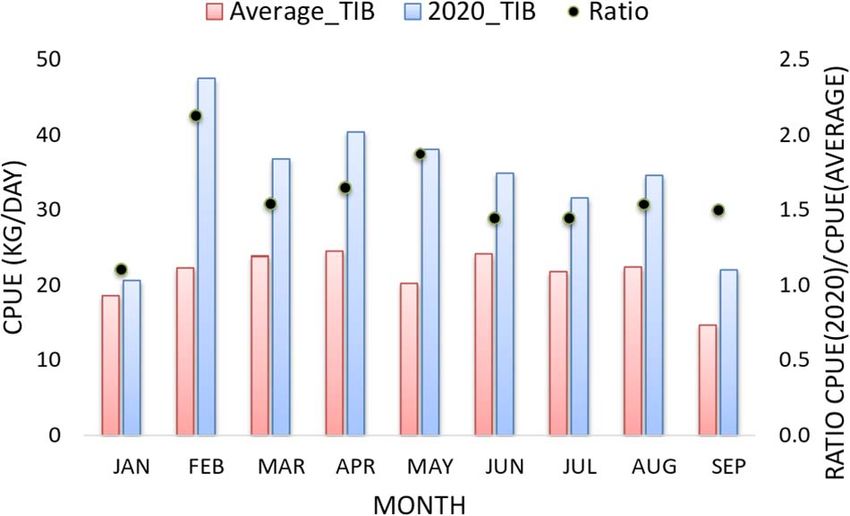
Plagányi et al.                                                                                                        COVID-19 Impacts on Lobster Fishery

    In April 2020, the Australian Government introduced an                         as daily temperature checks, strict hygiene practices, limiting
International Freight Assistance Mechanism whereby funding                         contact with communities and appropriate emergency response
was provided to recommence shipments to China and other                            to address possible development of COVID-19 symptoms during
countries in an effort to assist Australia’s stalled seafood and                   the survey.
agriculture export trade (Ogier et al., 2021). Given that many                         Fortunately, there were no outbreaks in Queensland during
countries closed their borders to overseas visitors, these special                 the months leading up to the survey, and hence the scientific
freight flights meant that seafood shipments could recommence                      survey was successfully conducted in 2020, ensuring continuity
despite the otherwise restricted environment. Chinese demand                       of the 32-year data series.
for lobster remained low initially due to bans on large gatherings
and festivals, but exports started again from Australia, while the                 Fishery Data
PNG fishery remained closed.                                                       The total reported catch for the Australian TRL fishery (1
    Toward the end of the 2020 fishing season, there were few                      December 2019 to 30 September 2020) was 361.3 tons, with 216.2
constraints affecting the export of TRL from Australia. As a result,               tons caught by the TIB sector and 145.1 tons caught by the TVH
there were reports of some diversification of the TRL supply                       sector (Table 1). The total reported catch from PNG was 90.4
chain, such as more frozen tails being exported. However, it was                   tons (January–August 2020) which was extrapolated to a full year
not viable to target local consumers, with the domestic market                     using a pre-agreed approach, yielding 126.4 tons. The 2020 catch
price being less than the harvest and marketing costs in the                       was 84% of the TAC with a proportion of the shortfall attributable
fishery. The domestic lobster price was further reduced as a result                to impacts of COVID-19 in 2020 (based on discussions in TRL
of reduced exports of lobsters from other fisheries nationally.                    RAG meeting in May 2020).
    Following directly after the COVID-19 disruptions, in                              During the initial period when live lobsters could not be
October 2020 (when the TRL fishing season had ended) there was                     exported, some product was converted to tails which could be
a second major disruption to lobster exports following reports                     frozen and stored. It was therefore anticipated that there would
that unacceptable levels of cadmium were found in a shipment                       be an increase in the proportion of tailed product, but this effect
of western rock lobsters (P. cygnus) to Shanghai, which resulted                   was barely noticeable when evaluated using the entire year’s data
in delays to live lobster shipments to China at the ports of entry1 .              for the Australian sector (Deng et al., 2020a).
This resulted in cessation of fishing in response to the associated                    There were clear differences in the pattern of fishing through
uncertainty and concerns around the potential for delays in                        the year by the different sectors (Figure 3), as well as changes
border clearance to potentially affect all seafood and several other               in economic drivers which would have likely influenced when
food products exported from Australia.                                             fishing took place as well as the product type targeted. It was
                                                                                   noted that these factors could potentially all bias the catch and
Impacts on the Scientific Process and                                              effort data in terms of their representativeness as an index of
Survey                                                                             stock abundance.
An indirect impact of COVID-19 was that TRLRAG meetings                                A comparison of the relative proportions of the total annual
were changed from an in-person format to teleconferences. This                     catch that is taken by the TIB and TVH sectors in different
involved considerable preparation by the fisheries management                      months shows a particularly marked difference for the TVH
authority given the challenges of limited suitable facilities in                   sector in 2020 (Figure 3). There is a particularly strong signal
some of the remote island locations. However, these meetings                       during February, and extends slightly into March. February is
proceeded smoothly and hence this aspect is not considered                         usually a peak catch month but the impact on catch patterns,
further. One ongoing aspect is that some non-critical analyses                     presumably due to the disruption to the export market, is
that require longer, more in-depth discussions were delayed.                       clearly seen for the TVH sector in particular which ceased
    There were impacts of COVID-19 on the planning and                             fishing entirely over this period. Both sectors then seemingly
operation of the 2020 fishery-independent survey, however,                         compensated for lost catches during the middle of the season with
this did not compromise the process of data collection                             a substantial increase in catches during April. For the TVH sector,
once the survey commenced. Survey staff were required to                           the data shows an extended increase in effort up until July, and
liaise with government agencies, such as the State health                          then a drop as the TVH TAC allocation is approached (98.7%
department, and Torres Strait community stakeholders to                            of TVH quota allocation achieved). For the TIB sector, increased
determine requirements to enter and work within vulnerable                         effort appears to be sustained until August and drops to average
communities. Management Plans were developed to manage                             levels in September leading up to the fishery closure, with the final
the changing level of risk posed by COVID-19 for staff                             TIB sector catch being less (75.1%) of the TAC allocation.
to travel and complete the survey. The Plans considered                                Both the TVH and TIB sectors recorded significant effort
COVID-19 testing for survey and vessel charter operator                            decreases coinciding with initial COVID-19 outbreaks in
staff, alternative travel such as chartering planes rather than                    early 2020. However, catch rates for both sectors increased
commercial flights, the use of Personal Protective Equipment,                      substantially later in the 2019–2020 fishing season, and the
Safe Operating Procedures on board the charter vessel such                         annual CPUE point estimates were the highest values recorded
                                                                                   in the past five seasons.
1
  https://www.afr.com/politics/china-widens-trade-sanction-net-to-cover-all-           Both the TIB and TVH standardized CPUE series showed
fishermen-20201108-p56cig                                                          some differences from the nominal (unstandardized) series,

Frontiers in Marine Science | www.frontiersin.org                              6                                       June 2021 | Volume 8 | Article 686065
Plagányi et al. COVID-19 Impacts on Lobster Fishery
TABLE 1 | Summary of recent catch (t) per Torres Strait (TS) sector shown as a percentage of the Total Allowable Catch (TAC).
Season TIB TVH AUS-TOTAL PNG-TOTAL TS_TOTAL TAC Catch/
TAC
2013 142.5 361.7 504.2 108.3 612.5 871 70.3%
2014 198.8 273.2 472.0 261.2 733.2 616 119.0%
2015 202.6 152.7 355.3 235.7 591.0 769 76.9%
2016 267.1 243.0 510.1 248.0 758.2 796 95.2%
2017 111.5 166.3 277.8 113.0 390.8 495 79.0%
2018 127.4 128.3 255.7 156.4 412.1 320 128.8%
2019 260.6 155.9 416.5 167.0 583.5 641 95.1%
2020 216.2 145.1 361.3 126.4 487.7 582 83.8%
Australian (Aus) fishery sectors are Traditional Inhabitant Boat (TIB) and Transferable Vessel Holder (TVH) sector, and third sector is Papua New Guinea (PNG).
whereas there were minor differences only between alternative negatively biased (as is a possibility in this case), then it can have
standardized series (Deng et al., 2020b,c). Two of the GLM a reasonably substantial effect on the calculation of the RBC. In
variants that accounted for “year-by-month” effects indicated the absence of COVID-19, it was predicted that the total catch
large deviations in monthly fishing patterns in the 2019–2020 would be close to the TAC, hence the total average catch was
fishing season, in particular for March, April, and May. considered to be slightly negatively biased. On the other hand, it
For the TIB sector, the 2020 nominal and standardized CPUE was acknowledged that the TIB CPUE data could be considered
index point estimate is the highest since 2004 (Deng et al., positively biased. All stakeholders at the TRLRAG management
2020b), noting that no data were available for 2013. For the TVH meeting agreed that the 2019–2020 season was an anomalous year
sector, the 2020 CPUE index is also higher than average, although and that COVID-19 indirectly impacted the eHCR indicators
similar to the 2013 point estimate (Deng et al., 2020c). A higher in different ways (TRLRAG, 2020). The management forum
than average CPUE was anticipated given the lobster stock was considered a range of alternative scenarios and sensitivity tests
predicted from the survey and stock assessment to be at a high pertaining to implementation of the eHCR, before deciding
abundance level. For the TIB sector, the extremely high CPUE for whether to recommend the default implementation of the eHCR,
the month of February and overall higher than average CPUE for or to undertake an ad hoc adjustment.
all months (Figure 4) may be partly attributable to the change in As there was insufficient information to fully quantify the
lobster spatial distribution (more lobster along the western side) impacts of COVID-19 on the fishery-dependent data, the
relative to the previous few years. It is also plausible that the delay TRLRAG felt they could not reasonably justify stepping outside
in the start of intensive fishing had a positive influence on the the bounds of the agreed harvest strategy and hence there was
CPUE because the lobsters had more time to grow larger (noting agreement to accept the default application of the eHCR without
their rapid growth rate) during the “break” from fishing and may any ad hoc adjustments. The global TAC for the Torres Strait
also have aggregated during this time. If so, there is potential for a Protected Zone (TSPZ) for the 2020–2021 season was thus of
positive bias (relative to previous years) that is not accounted for 623.5 tons, which is only slightly lower than the long-term
in the GLMs. It would be difficult to account for this in the GLM average (Figure 5).
also because we would need an understanding of the underlying The influences of COVID-19 on the fishery-dependent data
factors driving the catch rates (if not abundance). highlighted the valuable role that fishery-independent surveys
The CPUE indices provide an index of the 2+ lobsters, which play in terms of providing reliable information to ensure
are not reliably counted during the Fishery-independent survey sustainable management. Ongoing work is focused on improving
because most will have migrated out the survey area by this understanding of potential improvements to the standardization
time of year. The two standardized indices can be compared of CPUE data, and in particular, how to account for inter-
to see whether they show similar trends in overall biomass, sector interactions.
and this can also be compared with the model-estimated trend
in the biomass of 2+ lobsters [in this case from 2019 stock Supply Chain Resilience
assessment (Plagányi et al., 2020b)]. These three indices have
The TRL fishery is exploited by both non-Indigenous and
been normalized by dividing by their mean value and the two
Indigenous Islanders, for whom it has cultural significance
CPUE indices show similar trends, plus are also consistent with
(Plagányi et al., 2013; Van Putten et al., 2013). TRL are passed
the stock assessment model projections from the previous year
down the supply chain either as live lobsters, which are mostly
(Supplementary Figure 1).
exported to China or frozen tails that are exported to the
United States, predominantly via a holding facility in Cairns
eHCR and Final Management Advice (Figure 2). Future analyses could be extended to include more
In the case of total catch, the eHCR uses the average catch over the complex aspects of the associated cross-jurisdictional regulations
past 5 years as a multiplier to inform the RBC. This dampens the and management with PNG, as well as the closely-related East
influence of the most recent catch value, but if the recent value is Coast tropical lobster fishery (Figure 1).
Frontiers in Marine Science | www.frontiersin.org 7 June 2021 | Volume 8 | Article 686065Plagányi et al. COVID-19 Impacts on Lobster Fishery FIGURE 3 | Comparison of the relative proportion of fishing by (A) all sectors compared and (B) TIB sector and (C) TVH sector for months as indicated compared with the average pattern (average over 2004–2019). Data for Papua New Guinea (PNG) available until end of September only. Frontiers in Marine Science | www.frontiersin.org 8 June 2021 | Volume 8 | Article 686065
Plagányi et al.                                                                                                          COVID-19 Impacts on Lobster Fishery

                                                                                         The distribution of key elements along the chain under
                                                                                      alternative scenarios (Figure 6) is a useful way for highlighting
                                                                                      the relative spread of risk across the nodes. For example, the
                                                                                      relative distribution of SCI scores under Scenario (B) suggest a
                                                                                      less resilient overall structure than the more evenly distributed
                                                                                      pattern that is estimated under Scenario (D) (Figure 6). One
                                                                                      important factor to consider is that the supply chain analyses
                                                                                      have been considered as insular and independent of other
                                                                                      changes in substitute products and products that compete
                                                                                      on the local and international markets; and therefore future
                                                                                      improvements in these analyses could incorporate the cross price
                                                                                      elasticities of substitutes.

  FIGURE 4 | Comparison of nominal 2020 monthly CPUE for the TIB sector
  with the average computed over the preceding period 2004–2019. The
                                                                                      DISCUSSION
  second vertical axis shows the ratio of the 2020 monthly CPUE relative to the
  average pattern to highlight the anomalous pattern observed at the start of         COVID-19 exposed large differences in the resilience of different
  2020.                                                                               seafood systems as well as shedding light on broader inequalities
                                                                                      across societies (Love et al., 2020). Different countries were
                                                                                      affected by different levels and responses to COVID-19, whereas
                                                                                      different industries fared differently depending on factors such as
    Over the past decade, live lobsters from PNG and the                              whether they relied on fresh or frozen produce, local or overseas
related East Coast tropical lobster fishery are also predominantly                    export markets, as well as the diversity of networks connecting
channeled via facilities in Cairns (Plagányi et al., 2017).                           fishers to buyers and consumers. In remote fishing communities
In addition, there has been an increase in alternative TRL                            such as Torres Strait, the livelihood of many small businesses and
processors, which is not represented in Figure 2.                                     communities depend on the TRL fishery. During the initial stages
    Under Scenario (A), the Resilience Score was 0.92 and the SCI                     of the COVID19 pandemic, fishers were not able to work and for
identified the Chinese and United States markets as key elements                      Indigenous Torres Strait Islanders, there were limited alternatives
(Table 2). However, under Scenario (B) which more closely                             given their geographical setting. The effect was compounded due
reflects the pre-COVID-19 supply chain, the Resilience Score                          to their efforts over the past few years to maximize the value from
is reduced to 0.89 and the criticality of United States markets                       their fishery by transitioning to exporting live product rather
declines and is replaced by air freight being identified as a critical                than relying on domestic markets. Torres Strait lobster fishers
element. This suggests that the key mechanism for stabilizing this                    were not alone in absorbing the financial consequences of this
supply chain is to reduce uncertainty in supplying these markets.                     risk, as much of the country’s high-valued product is exported.
The supply chain analyses of Plagányi et al. (2014) therefore                         For 2018–2019, it’s estimated that lobsters, abalone, prawns and
stressed that maintaining and strengthening relationships with                        bêche-de-mer contributed nearly 60 per cent of the $2.1 billion
international markets is key to underpinning the success of this                      total value of wild caught seafood.
supply chain. Since that time, and as illustrated by this analysis,                       Fortunately for TRL, the disruptions occurred for only a
the criticality of these elements has increased further and as they                   relatively short period early in the season and once fishing
were the supply chain elements impacted by COVID-19, it is not                        resumed, both the TIB CPUE and TVH CPUE indices suggested
surprising that the fishery took a huge knock.                                        that fishers were able to make up some lost catches because
    One potential adaptation strategy that has been suggested is to                   catch rates were high. The 2020 fishery-independent survey
increase the domestic market. Scenario (C) suggests that shifting                     was conducted successfully and hence the survey data were
one-quarter of product to the domestic market would increase                          unaffected by COVID-19. The fishery-independent 1+ and 0+
the supply chain resilience to 0.93 (Table 2). The resilience of the                  survey indices that are used to inform on likely abundance
supply chain can be strengthened further through even greater                         in the following fishing season both exhibited positive trends.
diversification of the supply chain—for example, if the domestic                      Although the 0+ index is less reliable, the positive trend provides
market absorbs half the product and the rest is split between                         an indication of what is to be expected in future seasons. The
frozen tail and live exports, then the resilience score increases                     TRLRAG considered that the eHCR was reasonably robust to
to 0.94. Under optimized Scenario (D), domestic consumers                             this single anomalous event. The eHCR captures longer-term
are identified as the most critical node, followed by air freight                     trends over a 5-year period, it places substantially more weighting
handling and the Cairns processor (Table 2). Scenario (D) is                          (80%) on the fishery-independent survey which is not affected
the most diversified of the supply chain configurations analyzed                      by trade and other disruptions. Also, using a 5-year average
and the high resilience score of 0.94 is further contrasted with                      (including average catch) helps to dampen the influence of a
an extreme streamlined scenario whereby only 5% of product                            single anomalous year. However, using a 5-year average also
is frozen and tailed, with corresponding resilience score of                          means that the abnormal 2020 catch will have a dampening
0.87 (Table 2).                                                                       impact on TACs for the following years.

Frontiers in Marine Science | www.frontiersin.org                                 9                                      June 2021 | Volume 8 | Article 686065
Plagányi et al. COVID-19 Impacts on Lobster Fishery
FIGURE 5 | Schematic summary of the empirical harvest control rule (eHCR) used to calculate the TRL (Tropical Rock Lobster) RBC (Recommended Biological
Catch) based on the CPUE (Catch Per Unit Effort) data from two fishery sectors, the scientific survey indices of two age classes, and the total average catch over the
past 5 years.
TABLE 2 | Examples of alternative supply chain scenarios showing the standardized SCI (Supply Chain Index) and Resilience Scores, together with the top three key
elements identified using the method of Plagányi et al. (2014).
Supply chain scenario SCI (standardized) Resilience score Top 3 key elements
Base (2012) (frozen tails and live; few domestic) 0.084 0.92 Chinese importer Chinese United States
consumers importer
Mostly live exports (14% tails, 5% domestic) 0.112 0.89 Chinese importer Chinese Air freight
consumers
Increased domestic (25%) and similar tails and live 0.067 0.93 Air freight Chinese importer Chinese
consumers
Optimized design with bigger domestic share 0.059 0.94 Australian consumers Air freight Cairns
processor
Almost all live exports (5% tails, 5% domestic) 0.129 0.87 Chinese importer Chinese Air freight
consumers
Although there were some concerns around the This highlights the need for further development of pre-
representativeness of some data during 2020, the eHCR agreed “exceptional circumstances” rules to handle events
was applied without any ad hoc adjustments because it that are outside the bounds considered in the testing
was designed to be robust to uncertainty and variability in phase, or that provide new information that underscores
inputs. However, it was also recognized that a more formal the need to review the original performance of the HCR
process was needed to support decision making should (Hillary et al., 2016).
similar anomalous events occur in the future. It is recognized The full economic impact of the coronavirus on the
that it isn’t possible to design a harvest control rule that Australian seafood industry will not be known for some time, as
accounts for all possible contingencies (Butterworth, 2008). markets and exporters are attempting to adapt to the situation.
Frontiers in Marine Science | www.frontiersin.org 10 June 2021 | Volume 8 | Article 686065Plagányi et al. COVID-19 Impacts on Lobster Fishery
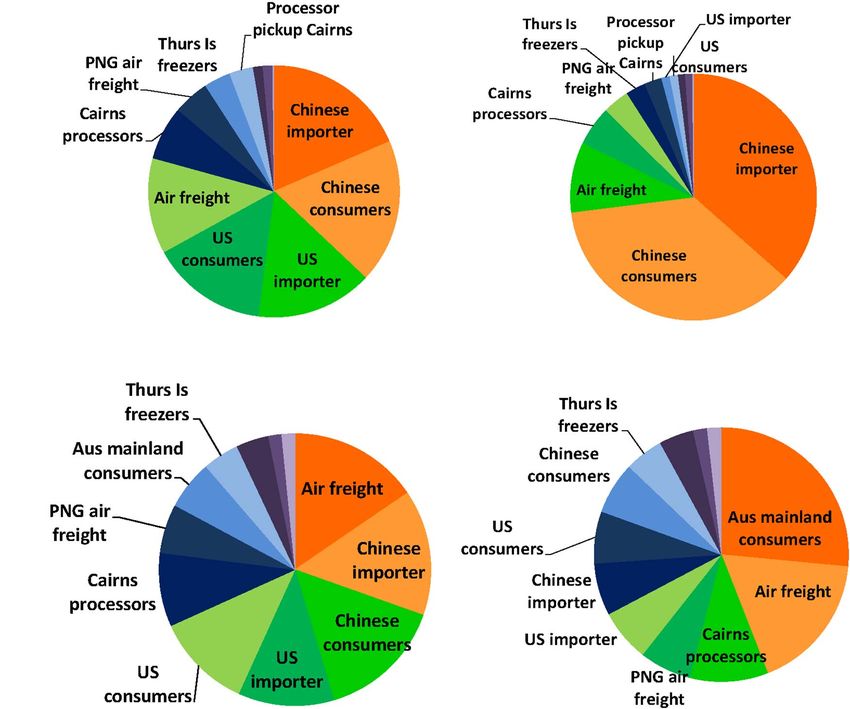
FIGURE 6 | Pie diagrams summarizing the criticality (based on individual Supply Chain Index score of each node) of elements in Tropical Rock Lobster supply chain
scenarios: (A) 2012 base-scenario with substantial proportion of product sold as frozen tails, (B) 2019 scenario with very small proportions of tails and few domestic
sales, (C) illustrative scenario with larger proportion of product sold on the domestic market, (D) optimized scenario with substantially more product going to
domestic market and even split between frozen and live. The size of pie segments represents how critical a node is, and the overall distribution of segments provides
an indication of the spread or evenness of the scores attached to different nodes. From highest to lowest scores, the color coding used is roughly red
(>20%)-orange-green-blue-purple.
However, it is expected to be significant in terms of short-term abalone (Victoria only) quotas in the 2019–2020 season to be
revenue and employment. rolled over to the 2020–2021 season. In Western Australia, the
For some fisheries that are regulated by a quota system, if they rock lobster fishing season was extended, and the TAC has been
catch less this year, then it is possible they will be able to take increased2 .
slightly more next year without negatively affecting the resource. The economic market linkages and global connectedness of
Depending on how management responds, they could partially our trade systems may increasingly be subject to unforeseen
(but not fully) offset economic losses longer term. This, however, social-ecological vulnerabilities (Adger et al., 2009) and
will not be the case for the Torres Strait lobster fishery. transformative changes to develop more resilient supply chains
The Torres Strait lobster fishery is fairly unique in relying (Lim-Camacho et al., 2017) may be needed to ensure ongoing
on short-lived, fast-growing lobster stocks, unlike many other sustainability of global production ecosystems (Nyström et al.,
lobster fisheries across the world which harvest the cold- 2019). Many small-scale fisheries lack the capacity to mitigate
water, long-lived, slower-growing species (Phillips, 2008). Catch global market forces and more international solutions are needed,
and revenue each year depends on how many lobsters are such as development of insurance opportunities by international
available. This makes it different to fisheries that rely on longer- financial institutions (Knight et al., 2020). There has been an
lived animals for which short-term declines in revenue and increase in the appreciation of the need to adopt triple bottom
employment can be partially offset as fish not already landed line approaches to fisheries management (Plagányi et al., 2013;
may contribute to future yields once the current crisis subsides.
For example, government in South Australia, Victoria and 2
https://www.frdc.com.au/media-publications/fish/FISH-COVID19-Special-
Tasmania are allowing uncaught Southern rock lobster and Issue-1/Management-moves-to-help-commercial-fishers
Frontiers in Marine Science | www.frontiersin.org 11 June 2021 | Volume 8 | Article 686065Plagányi et al. COVID-19 Impacts on Lobster Fishery
Dichmont et al., 2020) but much more work is needed to ensure The pandemic brings to the forefront the fragility of the
that supply chains are adaptable enough to ensure that the outlets current economic market linkages and global connectedness of
for seafood products are maintained in the future. This is vital not our trade systems. Some of our earlier research analyzed fishery
only for economic stability, but also the livelihood and mental supply chains and found that the key components of lobster
health of fishers, their socio-cultural wellbeing, and food and supply chains that were most vulnerable to external shocks
nutrition security globally (Hicks et al., 2019). were the Chinese consumers, processors and airports (Plagányi
Previous studies have identified the need to build resilience to et al., 2014). Our scientific scenarios have played out in real life
changing climate as an increasingly important challenge to supply and highlight the need for transformative changes to develop
chains (Levermann, 2014; van Putten et al., 2016; Lim-Camacho more resilient supply chains to ensure the ongoing sustainability
et al., 2017). COVID-19 has confronted supply chains with and security of seafood and other natural resources production
similar disruptions to transport and markets as climate change (Lim-Camacho et al., 2017).
is predicted to do, and hence we have applied the same method
to analyze the connectivity of supply chains and to identify the
key agents in these chains which may be fragile and hence in DATA AVAILABILITY STATEMENT
need of focused attention. Our analyses highlight the changes
which can result from lessening the dependence on a single key The data analyzed in this study are subject to the following
element and strengthening or adding alternative complementary licenses/restrictions: Data include details of fishing by Indigenous
pathways and connections. We provide an example also of using fishers and only available on request in an aggregated form.
the approach as a tool for supply chain design and redesign Requests to access these datasets should be directed to ÉP,
strategies. As with many other fisheries, economic rationalism eva.plaganyi-lloyd@csiro.au.
has tended to favor a more streamlined, efficient and linear
supply chain for lobster fisheries. Our analyses add to the growing
recognition that market diversification is essential to fisheries AUTHOR CONTRIBUTIONS
sustainability (Plagányi et al., 2014; Lim-Camacho et al., 2017;
Knight et al., 2020). ÉP conceived and wrote the manuscript, assisted also by SP, LB,
In the illustrative optimization scenario we developed and MT. ÉP and RD implemented the harvest strategy. ÉP did the
(Table 2), we assumed that Australian mainland consumers supply chain analyses. NM, MT, SE, KS, and LD collected the field
would be able to absorb additional product (and pay a reasonable data. SP and TH collected economic information. ÉP, RD, SE, and
price), but in reality the resilience of any such redesigned NM analyzed the data. All authors contributed to the article and
supply chain strongly depends on the extent to which this approved the submitted version.
assumption holds.
While transport costs would be significantly reduced,
COVID-19 highlighted that increased supplies to the domestic
FUNDING
market may also result in a substantial decrease in prices The work reviewed in this article was funded by the CSIRO and
received. Additional contingency plans that were implemented the Australian Fisheries Management Authority (AFMA).
during COVID-19 were to introduce mechanisms that helped
increase efficiency in selling catches locally, International Freight
Adjustment Mechanism, waiver boat license and quota fees, ACKNOWLEDGMENTS
allow for alternative access options (i.e., permits for other
fisheries) (see text footnote 2) and diversify product types that are We would like to thank all the Torres Strait Traditional Owners
more versatile in terms of “storability” [for example, converting and TRLRAG members and stakeholders for their invaluable
fresh product to frozen tails (lobster) or canned product inputs. Thanks to Judy Upston, Ingrid van Putten, and Pia
(abalone)], but there are significant costs to this adaptation Bessell-Browne for comments on an earlier draft.
strategy which also need to be considered. Fishery businesses
should ideally pay more attention to supply chain risks and
business continuity planning (Ogier et al., 2021). We recommend SUPPLEMENTARY MATERIAL
therefore that the SCI be used in combination with market
demand (Hobday et al., 2014; Pascoe et al., 2021) and supply The Supplementary Material for this article can be found
analysis and supplemented by qualitative assessment of each online at: https://www.frontiersin.org/articles/10.3389/fmars.
supply chain phase. 2021.686065/full#supplementary-material
REFERENCES Bennett, N. J., Finkbeiner, E. M., Ban, N. C., Belhabib, D., Jupiter, S. D., Kittinger,
J. N., et al. (2020). The COVID-19 pandemic, small-scale fisheries and coastal
Adger, W. N., Eakin, H., and Winkels, A. (2009). Nested and teleconnected fishing communities. Coast. Manage. 48, 336–347. doi: 10.1080/08920753.2020.
vulnerabilities to environmental change. Front. Ecol. Environ. 7, 150–157. 1766937
Australian Government Department of Agriculture and Water Resources Butterworth, D. S. (2008). A commentary on: salvaged pearls: lessons learned from
(2018). Commonwealth Fisheries Harvest Strategy Policy. Canberra: Australian a floundering attempt to develop a management procedure for Southern Bluefin
Government Department of Agriculture and Water Resources. Tuna. Fish. Res. 94, 351–354. doi: 10.1016/j.fishres.2008.09.034
Frontiers in Marine Science | www.frontiersin.org 12 June 2021 | Volume 8 | Article 686065Plagányi et al. COVID-19 Impacts on Lobster Fishery Catizone, I. (2020). Keeping Seafood Supplies Flowing: FISH COVID19 Special Link, J. S., Werner, F. E., Werner, K., Walter, J., Strom, M., Seki, M. P., et al. Issue 1, Fisheries Research & Development Corporation News. Available (2021). A NOAA Fisheries science perspective on the conditions during and online at: https://www.frdc.com.au/media-publications/fish/FISH-COVID19- after COVID-19: challenges, observations, and some possible solutions, or why Special-Issue-1/Keeping-seafood-supplies-flowing (accessed March 26, 2021). the future is upon us. Can. J. Fish. Aquat. Sci. 78, 1–12. Deng, R., Edgar, S., Upston, J., and Plagányi, E. (2020a). Torres Strait Tropical Love, D., Allison, E., Asche, F., Belton, B., Cottrell, R., Froelich, H., et al. (2020). Rock Lobster Fishery – Summary of Catch and Effort Data Pertaining to the Emerging COVID-19 impacts, responses, and lessons for building resilience in 2020 Fishing Season (Dec-2019 to Sep-2020). CSIRO/AFMA Report Submitted the seafood system. Glob. Food Sec. 28:100494. doi: 10.1016/j.gfs.2021.100494 to TRLRAG30 document, December 2020. Canberra: CSIRO. Notteboom, T., Pallis, T., and Rodrigue, J.-P. (2021). Disruptions and resilience in Deng, R., Plaganyi, E., Upston, J., and Edgar, S. (2020b). Use of TIB Logbook Data global container shipping and ports: the COVID-19 pandemic versus the 2008– to Construct An Annual Abundance Index for the Torres Strait Rock Lobster 2009 financial crisis. Marit. Econ. Logist. 23, 179–210. doi: 10.1057/s41278-020- Fishery– 2020 Update. TRLRAG30 Document. (Canberra: CSIRO), 6. 00180-5 Deng, R., Plaganyi, E., Upston, J., and Edgar, S. (2020c). Use of TVH Logbook Data Nyström, M., Jouffray, J. B., Norström, A. V., Crona, B., Søgaard Jørgensen, P., to Construct an Annual Abundance Index for Torres Strait Rock Lobster – 2020 Carpenter, S. R., et al. (2019). Anatomy and resilience of the global production Update. TRLRAG30 Document. (Canberra: CSIRO), 6. ecosystem. Nature 575, 98–108. doi: 10.1038/s41586-019-1712-3 Dennis, D., Plaganyi, E., Van Putten, I., Hutton, T., and Pascoe, S. (2015). Cost Ogier, E., Sen, S., Jennings, S., Magnusson, A., Smith, D. C., Colquhoun, E., et al. benefit of fishery-independent surveys: Are they worth the money? Mar. Policy (2021). Impacts of Covid-19 on the Australian Seafood Industry: January-June 58, 108–115. doi: 10.1016/j.marpol.2015.04.016 2020. Canberra: FRDC. Dichmont, C. M., Dowling, N. A., Pascoe, S., Cannard, T., Pears, R. J., Breen, S., Okyere, I., Chuku, E. O., Ekumah, B., Angnuureng, D. B., Boakye-Appiah, J. K., et al. (2020). Operationalizing triple bottom line harvest strategies. ICES J. Mar. Mills, D. J., et al. (2020). Physical distancing and risk of COVID-19 in small- Sci. 2020:fsaa033. scale fisheries: a remote sensing assessment in coastal Ghana. Sci. Rep. 10:22407. FAO (2020a). How is COVID-19 Affecting the Fisheries and Aquaculture Food Pascoe, S., Schrobback, P., Hoshino, E., and Curtotti, R. (2021). Demand Conditions Systems. Rome: FAO. and Dynamics in the SESSF: An Empirical Investigation. FRDC Project No FAO (2020b). The Impact of COVID-19 on Fisheries and Aquaculture – A Global 2018-017. Canberra: FRDC. Assessment From the Perspective of Regional Fishery Bodies: Initial Assessment. Phillips, B. (2008). Lobsters: Biology, Management, Aquaculture and Fisheries. Rome: FAO. Hoboken, NJ: John Wiley & Sons. Farmery, A., Brewer, T., Farrell, P., Kottage, H., Reeve, E., Thow, A., et al. Plagányi, É. E., van Putten, I., Hutton, T., Deng, R. A., Dennis, D., Pascoe, S., et al. (2021). Conceptualising value chain research to integrate multiple food system (2013). Integrating indigenous livelihood and lifestyle objectives in managing elements. Glob. Food Sec. 28:100500. doi: 10.1016/j.gfs.2021.100500 a natural resource. Proc. Natl. Acad. Sci. U.S.A. 110, 3639–3644. doi: 10.1073/ FRDC (2020). Seafood Trade Data. Available online at: https://www.frdc.com.au/ pnas.1217822110 services/seafood-production-and-trade-databases (accessed June 2, 2011). Plagányi, É. E., van Putten, I., Thebaud, O., Hobday, A. J., Innes, J., Lim-Camacho, Ghadge, A., Wurtmann, H., and Seuring, S. (2020). Managing climate change risks L., et al. (2014). A quantitative metric to identify critical elements within seafood in global supply chains: a review and research agenda. Int. J. Prod. Res. 58, supply networks. PLoS One 9:e91833. doi: 10.1371/journal.pone.0091833 44–64. doi: 10.1080/00207543.2019.1629670 Plagányi, É. E., Murphy, N., Deng, R., Pacoe, S., and Hutton, T. (2020a). Hicks, C. C., Cohen, P. J., Graham, N. A., Nash, K. L., Allison, E. H., D’Lima, C., Coronavirus is Killing Australia’s Lobster Export Market. Available online at: et al. (2019). Harnessing global fisheries to tackle micronutrient deficiencies. https://theconversation.com/coronavirus-is-killing-australias-lobster-export- Nature 574, 95–98. doi: 10.1038/s41586-019-1592-6 market-131750 (accessed February 19, 2020). Hillary, R. M., Preece, A. L., Davies, C. R., Kurota, H., Sakai, O., Itoh, T., Plagányi, É. E., Tonks, M., Murphy, N., Campbell, R., Deng, R., Edgar, S., et al. et al. (2016). A scientific alternative to moratoria for rebuilding depleted (2020b). Torres Strait Tropical Rock Lobster (TRL) Milestone Report 2020 on international tuna stocks. Fish Fish. 17, 469–482. doi: 10.1111/faf.12121 Fishery Surveys, CPUE, Stock Assessment and Harvest Strategy: AFMA Project Hobday, A. J., Bustamante, R. H., Farmery, A., Fleming, A., Frusher, S., Green, B., R2019/0825. May 2020 Draft Final Report. (Brisbane: CSIRO), 183. et al. (2014). Growth Opportunities and Critical Elements in the Supply Chain Plagányi, É. E., Deng, R., Campbell, R., Dennis, D., Hutton, T., Haywood, M., for Wild Fisheries and Aquaculture in a Changing Climate. Final Report. FRDC- et al. (2018). Evaluating an empirical harvest control rule for the Torres Strait DCCEE Marine National Adaptation Program 2011/233. Canberra: FRDC. Panulirus ornatus tropical rock lobster fishery. Bull. Mar. Sci. 94, 1095–1120. Hui, D. S., Madani, T., Ntoumi, F., Kock, R., Dar, O., Ippolito, G., et al. (2020). The doi: 10.5343/bms.2017.1101 continuing 2019-nCoV epidemic threat of novel coronaviruses to global health- Plagányi, É. E., Dennis, D., Deng, R., Campbell, R., Hutton, T., and Tonks, M. The latest 2019 novel coronavirus outbreak in Wuhan. China. Int. J. Infect. Dis. (2016). Torres Strait Tropical Lobster (TRL) Panulirus ornatus Harvest Control 91, 264–266. doi: 10.1016/j.ijid.2020.01.009 Rule (HCR) Development and Evaluation, Draft Final Report. Canberra: CSIRO. Hutton, T., Putten, E., Pascoe, S., Deng, R., Plagányi, É, and Dennis, D. (2016). Plagányi, É. E., Haywood, M. D. E., Gorton, R. J., Siple, M. C., and Deng, R. A. Trade-offs in transitions between indigenous and commercial fishing sectors: (2019). Management implications of modelling fisheries recruitment. Fish. Res. the Torres Strait tropical rock lobster fishery. Fish. Manage. Ecol. 23, 463–477. 217, 169–184. doi: 10.1016/j.fishres.2019.03.007 doi: 10.1111/fme.12186 Plagányi, É. E., McGarvey, R., Gardner, C., Caputi, N., Dennis, D., de Lestang, Huveneers, C., Jaine, F. R., Barnett, A., Butcher, P. A., Clarke, T. M., Currey- S., et al. (2017). Overview, opportunities and outlook for Australian spiny Randall, L. M., et al. (2021). The power of national acoustic tracking networks to lobster fisheries. Rev. Fish Biol. Fish. 28, 57–87. doi: 10.1007/s11160-017- assess the impacts of human activity on marine organisms during the COVID- 9493-y 19 pandemic. Biol. Conserv. 256:108995. doi: 10.1016/j.biocon.2021.108995 Plagányi, É. E., Murphy, N., Skewes, T., Dutra, L. X., Dowling, N., and Fischer, Knight, C. J., Burnham, T. L., Mansfield, E. J., Crowder, L. B., and Micheli, F. M. (2020c). Development of a data-poor harvest strategy for a sea cucumber (2020). COVID-19 reveals vulnerability of small-scale fisheries to global market fishery. Fish. Res 230, 105635. doi: 10.1016/j.fishres.2020.105635 systems. Lancet Planet. Health 4:e219. doi: 10.1016/s2542-5196(20)30128-5 PZJA (2019). Torres Strait Tropical Rock Lobster Fishery Harvest Strategy, Levermann, A. (2014). Climate economics: make supply chains climate-smart. Nat. Australian Fisheries Management Authority (AFMA). Available online at: News 506, 27–29. doi: 10.1038/506027a https://pzja.govcms.gov.au/sites/default/files/final_topical_rock_lobster_ Lim-Camacho, L., Hobday, A. J., Bustamante, R. H., Farmery, A., Fleming, A., harvest_strategy_nov_2019.pdf (accessed November, 2019). Frusher, S., et al. (2015). Facing the wave of change: stakeholder perspectives on Rosales, R. M., Pomeroy, R., Calabio, I. J., Batong, M., Cedo, K., Escara, N., et al. climate adaptation for Australian seafood supply chains. Reg. Environ. Change (2017). Value chain analysis and small-scale fisheries management. Mar. Policy 15, 595–606. doi: 10.1007/s10113-014-0670-4 83, 11–21. Lim-Camacho, L., Plagányi, ÉE., Crimp, S., Hodgkinson, J. H., Hobday, A. J., Skewes, T. D., Pitcher, R. C., and Trendall, J. T. (1994). Changes in the size Howden, S. M., et al. (2017). Complex resource supply chains display higher structure, sex ratio and molting activity of a population of ornate rock lobsters, resilience to simulated climate shocks. Glob. Environ. Change 46, 126–138. Panulirus ornatus, caused by an annual maturation molt and migration. Bull. doi: 10.1016/j.gloenvcha.2017.08.011 Mar. Sci. 54, 38–48. Frontiers in Marine Science | www.frontiersin.org 13 June 2021 | Volume 8 | Article 686065
You can also read