Unpiloted Aerial Vehicle Acquired Lidar for Mapping Monumental Architecture
←
→
Page content transcription
If your browser does not render page correctly, please read the page content below
Unpiloted Aerial Vehicle Acquired Lidar for
Mapping Monumental Architecture
A Case Study from the Hawaiian Islands
Mark D. McCoy , Jesse Casana , Austin Chad Hill , Elise Jakoby Laugier ,
Mara A. Mulrooney, and Thegn N. Ladefoged

                                                                 ABSTRACT
   As lidar becomes a regular part of surveying, ground-based platforms (handheld, mobile, and terrestrial lidar) and airborne platforms (piloted
   aircraft) are being joined by unpiloted aerial vehicle (UAV)–acquired lidar. We present a method for leveraging UAV-acquired lidar data with
   data collected using different lidar platforms (terrestrial and piloted aircraft), at a range of resolutions (1 to +1,000 points per m2) and geo-
   graphic scales. We use these instruments to document a dry-masonry stone wall enclosing a religious precinct within the royal center at
   Kealakekua, Kona District, Hawai’i Island. Prior to European contact in AD 1779, Kealakekua was the center of the island-wide polity during the
   annual Makahiki festival. Results of this study suggest that when the wall was constructed around AD 1640, it was the largest structure ever built
   on the island of Hawai’i as well as a strong material expression of the power of state religion and the Makahiki rituals.

   Keywords: lidar, terrestrial lidar, airborne lidar, unpiloted aerial vehicle (UAV) lidar, monumental architecture, Hawai’i

   Mientras que la tecnología lidar se convierte en una práctica regular en la prospección arqueológica, tanto sus aplicaciones terrestres como
   las aéreas pueden ser complementadas con tecnología lidar integrada en drones o en inglés “unpiloted aerial vehicle” (UAV). En este
   artículo, presentamos un método para potenciar la data lidar adquirida por tecnología UAV con data obtenida utilizando diferentes pla-
   taformas lidar (terrestres y aéreas), a una variedad de rangos de resolución (desde 1 a + 1,000 puntos por metro cuadrado) y a diversas
   escalas geográficas. Utilizamos estos instrumentos para documentar un muro de mampostería en seco que rodea un precinto religioso al
   interior del centro real en Kealakekua, distrito de Kona, en la isla de Hawai’i. Previo al contacto europeo alrededor de dC 1779, Kealakekua
   era el centro político de la isla durante el festival anual de Makahiki. Los resultados de este estudio sugieren que cuando el muro fue
   construido, aproximadamente en dC 1640, esta fue la estructura de mayores dimensiones jamás construida en la isla de Hawai’i y una fuerte
   expresión material del poder religioso estatal y los rituales de Makahiki.

   Palabras clave: lidar, lidar terrestre, lidar aerotransportado, lidar de vehículo aéreo no piloto (UAV), arquitectura monumental, Hawai’i

Lidar high-density survey and measurement (HDSM; Opitz and Limp                 A platform that works well at a medium geographic scale is
2015) in archaeology tends to operate on two scales: (1) a small                lidar acquired by unpiloted aerial vehicles (UAV). UAV lidar is
geographic scale, measured in square meters, focused on a single                currently rare in archaeology (Barbour et al. 2019; Opitz and
feature or site with data collected by handheld, mobile, or tripod-             Herrmann 2018; Poirier et al. 2020; Risbøl and Gustavsen 2018;
mounted terrestrial lidar; and (2) a large geographic scale, measured           VanValkenburgh et al. 2020), but it is on track to being much
in square kilometers—often with thousands of sites—with data                    more common as it becomes less expensive (see Casana et al.
collected using airborne lidar mounted on a piloted aircraft.                   [2021] for details on how to build and launch lower-cost UAV
Between these two scales is a medium geographic scale, measured                 lidar for archaeology). What does this technology offer archae-
in hectares, rather than square meters or kilometers. Until recently,           ology? What can we do with UAV lidar that we cannot already
this scale was problematic because high-resolution terrestrial lidar is         do with lidar data from other platforms? And, how do we cap-
impractical for anything except small areas, but archaeological                 italize on lidar data from small, medium, and large geographic
interpretations based on lower resolution airborne lidar are limited.           scales?

                                      Advances in Archaeological Practice 9(2), 2021, pp. 160–174
  Copyright © The Author(s), 2021. Published by Cambridge University Press on behalf of Society for American Archaeology. This is
     an Open Access article, distributed under the terms of the Creative Commons Attribution-NonCommercial-ShareAlike licence (http://
creativecommons.org/licenses/by-nc-sa/4.0/), which permits non-commercial re-use, distribution, and reproduction in any medium, provided the
same Creative Commons licence is included and the original work is properly cited. The written permission of Cambridge University Press must be
                                                       obtained for commercial re-use.
                                                          DOI:10.1017/aap.2021.5

                                                                          160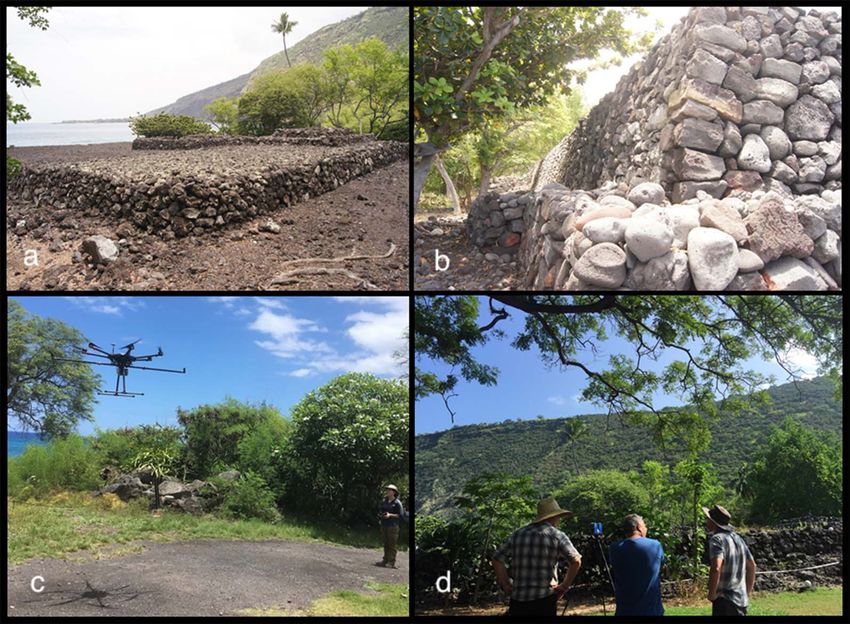
Unpiloted Aerial Vehicle Acquired Lidar for Mapping Monumental Architecture

Our aim is to begin to answer these questions by presenting a            Kealakekua. It defined a 3.3 ha area used for residences for priests,
method for using UAV-acquired lidar in conjunction with lidar data       a sacred pond, the massive Hikiau Heiau, and the smaller
collected by other platforms and scales to study monumental              Helehelekalani Heiau (for a summary, see Hommon 2014).
architecture. The size of construction projects has long been used       Archaeologists working in the Hawaiian Islands refer to walls like
as a cross-cultural proxy for degrees of social control (Trigger 1990)   this one as a “great wall.” There is no formal definition of a “great
and the materialization of ideology (DeMarrais et al. 1996). This is     wall.” It is simply used to distinguish traditionally built walls—
based on the premise that monuments, palaces, and religious              usually more than several meters thick and several meters high—
architecture—unlike other large structures such as fortifications for     from other large walls, such as stone walls built to control livestock
the common defense of a settlement—represent the capacity of             in the postcontact era. The Kealakekua Great Wall has appeared
societal factions to organize and control labor, often for purposes      on maps for more than a century, but there are conflicting
that benefited the elite. In the Hawaiian Islands, it is exceedingly      accounts of the true size of the feature (Figure 2). In addition, it is
rare that the apparent volume of building material is reported,          covered in thick vegetation, it has been modified to varying
despite the fact that there are hundreds of temples (heiau) and          degrees by later land use, and previous studies have suggested
other large structures distributed across the archipelago. This is       that some portion of the wall may be buried by erosional depo-
understandable given how difficult it is to assess volume in the          sition. Excavations have been extremely rare in the religious pre-
absence of detailed topographic survey and excavations. Without          cinct, and prior to our research, there were no reported reliable
size data, however, we are limited in what the history of monument       radiocarbon dates associated with any architecture from this—or
building can tell us about societal transformations.                     any—of Hawaii’s royal centers (for a recent review, see Reith et al.
                                                                         2011).

MAKAHIKI AND STATE RELIGION IN                                           In many ways, the Great Wall at Kealakekua is like other examples
THE HAWAIIAN ISLANDS                                                     of monumental architecture in the Hawaiian Islands and around
                                                                         the world: there are conflicting accounts of its size, little detail
                                                                         recorded on its form, and no secure date for its construction.
Makahiki, as it was practiced at European contact in AD 1779, was
                                                                         Here, we describe how we used UAV-acquired lidar, along with
an integral element of Hawaiian state religion. It was an annual
                                                                         terrestrial and piloted lidar platforms, to map the Great Wall at
religious season when war was suspended, and elites would make
                                                                         Kealakekua. Lidar allowed us to estimate the amount of building
a circuit of the island carrying a symbol of the god Lono to collect
tribute in the form of surplus food and fine goods (Figure 1). The        material used in its construction, compare it with other large
largest temple at Kealakekua, Hikiau Heiau, was dedicated to the         structures—including nearby Hikiau Heiau—and visualize its form.
war god for most of the year, but during the Makahiki season, it         Carefully placed excavations proved important for both ground
was used by the “cult of Lono”—a special sect of priests asso-           truthing building-rubble estimates and collecting material to
ciated with fertility, agriculture, and peace—who would open and         radiocarbon date to determine the likely date of the wall’s con-
close the season on the heiau (temple; Malo 1951). These cere-           struction. In this case, lidar proved its utility beyond just detecting
monies would have been opportunities for elites to display their         architecture through thick vegetation by (1) giving us a way to
grandeur and redistribute collected tribute beyond their normal          estimate building material regardless of the uneven preservation
cadre of retainers. The British accounts from AD 1779 describe           of the architecture and (2) helping detect and quantify building
their hosts providing them with an abundance of food, goods, and         material buried by erosional deposition.
hospitality at Kealakekua.

Although there is good evidence that Makahiki was practiced              MONUMENTAL ARCHITECTURE IN
across the Hawaiian archipelago, there are few direct accounts of it
outside of Kealakekua that can be linked to specific cultural sites
                                                                         THE ROYAL CENTERS OF KONA
(McCoy 2018). Historical linguistics suggest that the Makahiki           DISTRICT, HAWAI’I ISLAND
religious tradition evolved from rituals practiced by ancestral
Polynesians (Kirch and Green 2001:57–60) millennia before the first       There are few well-dated early cultural deposits from the Kona
permanent settlers arrived in the Hawaiian Islands around AD 1000        District on Hawai’i Island. Paleoenvironmental reconstructions
(Kirch 2011). But neither linguistic reconstructions nor oral history    based on pond cores at H     onaunau suggest “major growth in
tells us when it took on the form described by Europeans and the         settlement and activities” along the coast around AD 1450
first generation of Hawaiian historians employing the written             (Athens et al. 2007:iii). Salvage excavations have yielded six
medium. We are, therefore, without a strong material basis for           radiocarbon dates on short-lived taxa, with the earliest estimated
determining when the Makahiki festival became “[institutionalized]       to represent activities around AD 1600–1830 (cal AD 1521–1815;
as a means of tribute collection by the emerging archaic state           230±40 BP, Beta-279222; Reith 2011). Unfortunately, these dates
hierarchy” (Kirch et al. 2015). Most scholars suspect that it occurred   are not associated with any architecture, and none of the previous
late in the precontact era, around AD 1550–1700—a time when we           efforts at dating monument construction at H   onaunau (Ladd
see a spate of temple construction that, along with other evidence,      1969a) meet current chronometric standards (for a recent
suggests that society was undergoing a shift from a chiefdom to an       review, see Reith and Athens 2013).
archaic state with a divine monarch acting as the head of a state
religion (Hommon 2013; Kirch 2010).                                      On the basis of genealogical estimates, the first king who united
                                                                         Hawai’i Island, ‘Umi-a-Lı ̄loa, came to power around AD 1570–1590
A key archaeological metric for understanding the history of             (Kirch 2010). He broke with tradition and moved the island’s po-
Makahiki is the massive wall that enclosed the religious precinct at     litical center from the windward valley of Waipi‘o to the leeward

                     May 2021 | Advances in Archaeological Practice | A Journal of the Society for American Archaeology                    161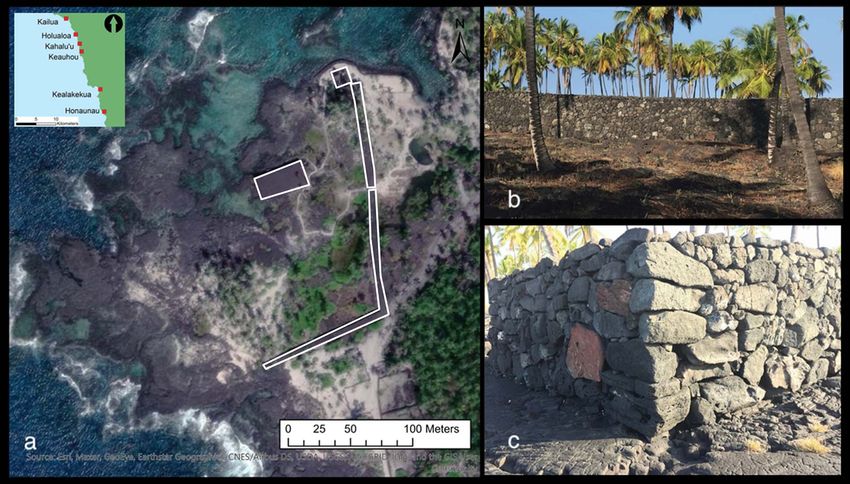
Mark D. McCoy et al.
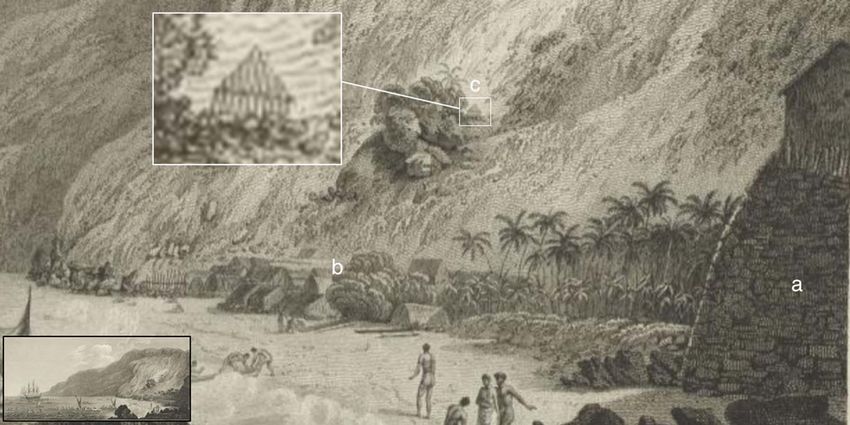
FIGURE 1. Drawing of the Royal Center at Kealakekua in AD 1779. This image shows (a) a temple—Hikiau Heiau—and (b) houses
of priests. Although most of the enclosing wall around the religious precinct is not visible from the viewer’s perspective, (c) a
structure situated on a terrace on the slopes of Nā po‘opo‘o Valley may be the North Section of the Great Wall. (Source: “A View of
Karakakooa in Owhyee” by John Webber [1784]. National Library of Australia.)
coast of Kona (Kamakau 1961:34; Kirch 2010:168). Over the next largest size category of traditional Hawaiian architecture (Figure 3).
two centuries, between AD 1600 and the arrival of Captain Cook The wall has a reconstructed length of 305 m, and it is on average
at Kealakekua Bay in AD 1779, six royal centers were built along a 5.2 m wide and 3.7 m tall, with an apparent volume of 19.25 m3 per
30 km stretch of the Kona coast at Kailua, Kahalu‘u, Keauhou, linear meter (LM) of wall (Kirch 1985). The apparent volume is,
Holualoa, Kealakekua, and H onaunau (Cordy 2000). It is unclear if however, somewhat larger than the actual volume of building
Kealakekua was the center of Makahiki ceremonies prior to the material because the wall’s architects used the “pao technique,”
capital’s shift to Kona, or if it became the center some time creating voids within thick sections of the wall to save on fill.
afterward. Nonetheless, the entire wall’s apparent volume, 5,864 m3 (esti-
mated from reconstructed length × average profile height and
Kona’s royal centers were partially documented by Bishop width), makes it one of largest structures ever built in the inde-
Museum ethnographer John Stokes in 1906, who recorded more pendent kingdom of Hawai’i Island. The war temple Pu‘ukoholā
temples in Kona (n = 59) than any other district on the island. Heiau, for example, has an apparent volume determined by ter-
Detailed mapping by Stokes (1991) and by Henry Kekahuna in the restrial lidar of 5,023 m3 (Mulrooney et al. 2005).
1950s provides an especially valuable source of information about
religious and royal centers prior to large-scale development and Other Hawaiian kingdoms had even larger structures. On Maui,
reconstruction (see also Cordy 2000; Hommon 2013, 2014). In the there were at least five temples with larger volume estimates (Kolb
1960s and 1970s, a resurgence of interest in royal centers led to a 1991, 1994, 1997, 1999), including the largest freestanding stone
number of surveys (e.g., Emory 1986; Hommon 1969; Soehren and architecture built in the archipelago—Pi‘ilanihale Heiau, at 21,937
Newman 1968) and excavations (Ladd 1969a, 1969b; Soehren and m3. Other large temples include Popoiwi Heiau (11,098 m3),
Tuohy 1987) carried out by the Bishop Museum on behalf of the Halekai‘i Heiau (9,515 m3), Pihana Heiau (6,686 m3), and Loaloa
National Park Service and Hawai’i State Parks. Heiau, which was estimated by Kolb (1991) as 5,834 m3 and by
Kirch and colleagues (2010) as 10,400 m3. But, due to a lack of
Previous archaeological surveys in Kona’s six royal centers suggest systematic study, it is difficult to contextualize these volume esti-
that although each had a unique layout and special features, there mates in terms of local architectural traditions (i.e., form, style) or
were some common elements (Stokes 1991). These centers were the broader cross-cultural pattern of monument size and power
occupied by elites and included royal compounds (or “palaces”; (e.g., Trigger 1990).
e.g., Flannery 1998), temples (heiau), sledding tracks (holua),
compounds for priests, grounds for training and sports, fishponds,
and mausoleums, all surrounded by a dense population to sup- SITE DESCRIPTION
port the center. Centers also included massive dry-masonry stone
“great walls” to delineate important areas. Located in Kealakekua Bay, Nā po‘opo‘o is a small coastal valley
with a steep talus slope along its northern and eastern edges. The
At the sacred refuge ( pu‘uhonua) of H
onaunau, some 5 km south mouth of the valley was home to a royal center with a large reli-
of Kealakekua, the surrounding “great wall” easily falls within the gious precinct. Today, the area is managed by the State Parks of
162 Advances in Archaeological Practice | A Journal of the Society for American Archaeology | May 2021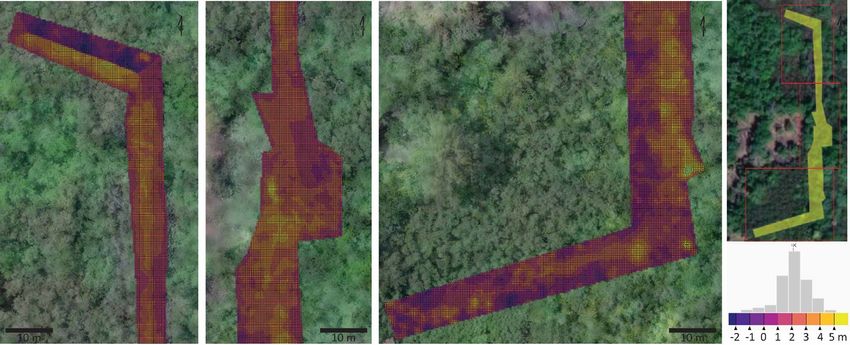
Unpiloted Aerial Vehicle Acquired Lidar for Mapping Monumental Architecture

FIGURE 2. Previous maps of the Royal Center at Kealakekua. The footprints of Hikiau Heiau and the three-sided Great Wall
around the religious precinct are shown. In this study, we derived a more accurate and precise rendering of both structures using
terrestrial and airborne lidar.

Hawai’i in collaboration with the local nonprofit group Ho‘ala          profile of the East Section was reported to be as much as 5 m wide
Kealakekua. Regular maintenance activities involve clearing            and 2.5 m high. In the North Section, the freestanding wall
vegetation, but in the past, there were several major efforts to       changes form to become a terrace at the base of a talus slope.
restore Hikiau Heiau. The wall around the religious precinct has       The portions of the South Section that are still visible were
not been the target of reconstruction, and today it remains            described as a low and poorly preserved freestanding wall. In
obscured under thick vegetation. In addition to the architecture       addition to the poor state of some sections of wall, there is good
that remains from the precontact era, many of the stone walls in       reason to suspect that some of the feature may be buried by
Nā po‘opo‘o Valley likely date to the historic era, and they were     erosional deposition. Hommon (2014:46), citing excavations in the
built to control livestock and mark property boundaries.               area by Yent (2006), notes “the depth of the alluvial deposits
                                                                       suggests that the great wall may have served not only to delineate
There are conflicting accounts of the form and size of the wall         the boundary of the sacred Hikiau precinct but also to protect it
around the religious precinct at Kealakekua (Figure 2). In 1906,       from flooding and slopewash.” When we began our research,
Stokes (1991) mapped a total of 340 m of wall in two segments—a        however, there had never been any excavations targeting the wall
North Section about 164.5 m long and an East Section about             itself.
175.5 m in length with a structure near its center. An earlier 1883
map, however, appears to show a 130 m long South Section
extending to the ocean, but it fails to show the other sections of     METHODS
the wall. Beginning in the 1960s, archaeological maps show all
three sections (Soehren and Newman 1968). Due to many years of         We begin with a description of lidar acquired by piloted airborne
development along the road leading to Kealakekua Bay, however,         lidar, unpiloted aerial vehicle (UAV) lidar, and tripod-mounted
the South Section now falls short of reaching the coastline.           terrestrial lidar (Table 1). Next, we summarize excavations around
                                                                       the Great Wall at Kealakekua aimed at collecting datable material
The first detailed map of all three sides of the wall show segments     in good archaeological context and determining how much
of widely varying sizes (Yent 1985: Figure 25). The estimated          building material may be below the present ground surface. A full

                    May 2021 | Advances in Archaeological Practice | A Journal of the Society for American Archaeology               163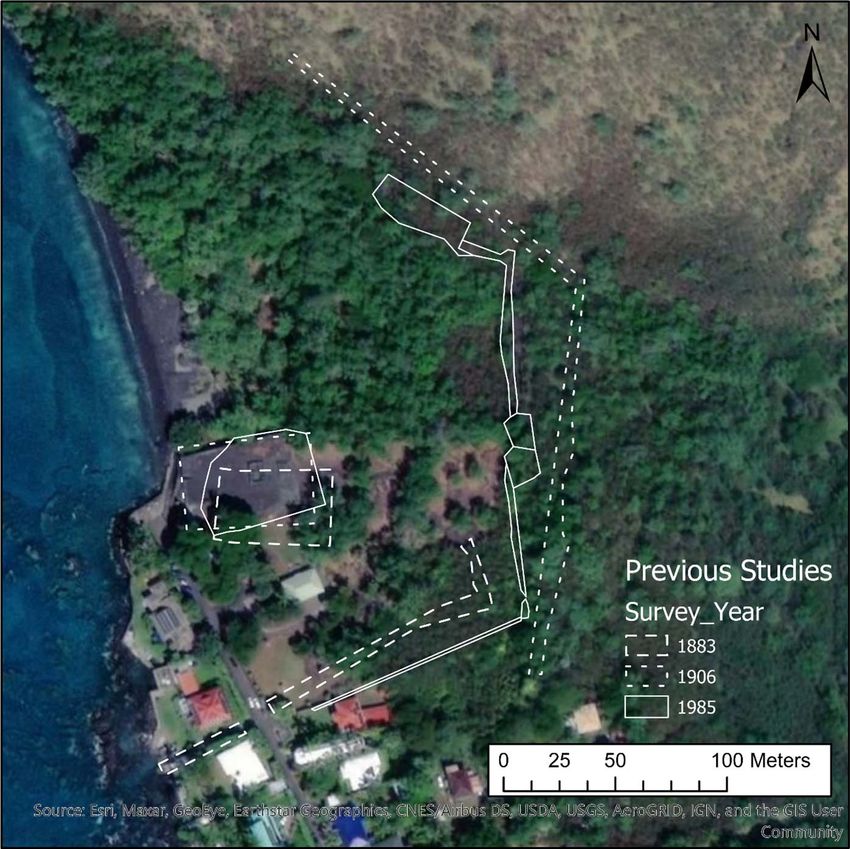
Mark D. McCoy et al.

FIGURE 3. The Great Wall of the Royal Center at H  onaunau, Kona District, Hawai‘i Island. This reconstructed two-sided wall is
the best-known example of a “great wall” in the Hawaiian Islands. It was used to enclose a sacred refuge with a major temple at
the center and a royal mausoleum at the northern end of its East Section. There is a formal entry slightly off from the center of the
wall’s East Section, and as at Kealakekua, the enclosed area is open on the coastal side. (Photos [b, c] by Mark D. McCoy.)

                 TABLE 1. Summary of Survey Lidar Platforms: Terrestrial, Unpiloted Airborne, and Piloted Airborne.

Lidar Platform                        Survey Area/Resolutiona                   Hardware                                            Software
                                             2               2
Terrestrial (tripod-mounted)          300 m /1,000 per m                        Faro Focus 3D                                       Scene by Faro
                                        (Great Wall)                                                                                Cloud Compare
                                      4,800 m2/1,000 per m2                                                                         ArcGIS Pro 2.4.1 (ESRI)
                                        (Hikiau Heiau)
Unpiloted Airborne Lidar (UAV)        10.56 ha/30 per m2                        Drone: DJI Matrice 600 (M600)                       Geodetics Software Suite
                                        (Napo‘opo‘o Valley)                       Hexacopter                                        LAStools
                                                                                IMU b: Geodetics Geo-MMS Navigator                  SAGA GIS
                                                                                Lidar: Velodyne VLP-16 (two-pulse return)           Cloud Compare
                                                                                                                                    Potree
                                                                                                                                    Relief Visualization Toolkit
                                                                                                                                    ArcGIS Pro 2.4.1 (ESRI)
Piloted Airborne Lidar                8.5 km2/1 per m2 (Kealakekua Bay)         Lidar: Optech ALTM system                           LAStools
                                                                                                                                    ArcGIS Pro 2.4.1 (ESRI)
Note: This table represents datasets relevant for mapping the Great Wall at Kealakekua. Each survey examined other areas as well.
a
  Point densities are postprocessed ground points only.
b
  Inertial measurement unit.

report on the details of the excavation can found in McCoy and
                                                                                   Lidar Datasets
Ladefoged (2018). Finally, we briefly describe two of the tech-                     Lidar data came from three sources: piloted airborne lidar, unpi-
niques used to calculate volume estimates: image mensuration                       loted aerial vehicle (UAV) lidar, and tripod-mounted terrestrial lidar
and building height (ArcGIS Pro, ESRI). We describe elsewhere                      (Figures 4 and 5). The piloted lidar was originally flown for the U.S.
how to build and fly UAV lidar for archaeological survey, and we                    Federal Emergency Management Agency (FEMA) to create a
discuss in detail the data processing workflow (Casana et al. 2021).                baseline dataset for coastal flooding management for the entire

164     Advances in Archaeological Practice | A Journal of the Society for American Archaeology | May 2021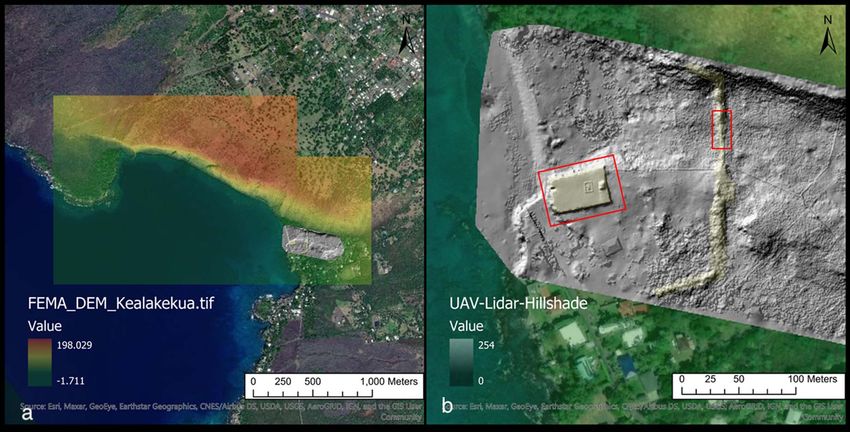
Unpiloted Aerial Vehicle Acquired Lidar for Mapping Monumental Architecture

FIGURE 4. Lidar survey in Kealakekua, Hawai‘i Island. Hikiau Heiau is large temple build on a natural outcrop. Much less
building material was required on the (a) southeast corner compared with the (b) northwest corner. Survey using lidar
mounted on a (c) UAV and (d) tripod were used to estimate the volume of building material for Hikiau Heiau and the Great
Wall. (Photos by Mark D. McCoy.)

island. The UAV lidar results are from 10.56 ha across the             Complete models (.ply) were exported from Faro’s proprietary
Nā po‘opo‘o Valley in Kealakekua Bay. Terrestrial lidar scans were    software and imported into the open-source software Cloud
conducted on Hikiau Heiau and on a well-intact portion of the          Compare (version 2.11). Models were further cleaned, converted
East Section of the Great Wall.                                        to meshes, and decimated to 1,058 points per m2. Apparent
                                                                       volume was estimated using the Measure Volume function in
Piloted Airborne Lidar. In 2006, a lidar survey was flown by            Cloud Compare (tool is located in Edit > Mesh > Measure
Airborne 1 Corporation (El Segundo, California) along the coast of     Volume).
Hawai’i Island up to about 200 m above sea level. The target point
spacing was 1 m. Ground control points were used for GPS-              Unpiloted Aerial Vehicle Lidar. In 2019, our team flew a UAV lidar
derived orthometric height (GEOID12A). A quality check of the          survey over Nā po‘opo‘o, Kealakekua (McCoy et al. 2020). This
dataset was published along with the bare-earth and raw point          survey utilized a Geodetics Geo-MMS lidar system carried on a
clouds. The 2006 FEMA Lidar: Hawaiian Islands Point Cloud files         DJI M600 drone. The Geo-MMS system utilized a Velodyne VLP-16
with Orthometric Vertical Datum GPS-derived orthometric height         sensor integrated with a proprietary IMU and two dual-frequency
via GEOID model using GEOID12A is available for download from          GNSS receivers. One 20-minute flight was undertaken at an
NOAA’s Office for Coastal Management (https://coast.noaa.gov/           altitude of 40 m above ground level with a transect spacing of 50
dataviewer/#/).                                                        m. The drone traveled at 2 m per second and collected an average
                                                                       of 561 points per m2. Flight planning and autonomous mission
Terrestrial Lidar. In 2016, we conducted two weeks of field survey      control was accomplished with UgCS Pro. Raw data processing to
and terrestrial lidar scans of architecture in Kealakekua, including   integrate Post-Processed Kinematic (PPK) GNSS data and
Hikiau Heiau (Figure 6) and a section of the Great Wall (Figure 7;     generate .las point cloud output was accomplished with the
McCoy 2017a). Footprints of architecture were recorded by GPS          Geodetics LidarTool software. Processing the resulting point
(Trimble GeoXH GPS) and control points were taken to later             cloud to generate a bare-earth Digital Terrain Model (DTM) was
georectify previous survey maps. Prior to terrestrial scanning, each   accomplished through a combination of SAGA GIS and LAStools.
area of interest had to be cleared of vegetation by hand in            The resulting point cloud data covered 10.56 ha (0.11 km2) and 30
combination with chain saws and leaf blowers. A Faro Focus was         ground points per m2. Elevation above sea level was corrected
set at stations spread across each study area, and 6-inch (15.25 cm)   using bare-earth airborne lidar flown by FEMA in 2006 (UTM, NAD
spheres were used as controls to merge 50 station scans.               1983, Zone 4N. Vertical Datum: NAVD88, Vertical Units: Meters).

                    May 2021 | Advances in Archaeological Practice | A Journal of the Society for American Archaeology               165
Mark D. McCoy et al.

FIGURE 5. Types of lidar survey data. For the study area, we have (a) lidar data from a piloted coastal survey by FEMA (1 point
per m2) that covers Kealakekua Bay, (b) UAV lidar (30 points per m2) for Nā po‘opo‘o Valley, and tripod-mounted terrestrial lidar (for
this study, decimated to 1,058 points per m2) for Hikau Heiau and a section of the enclosing wall (outlines of surveyed areas
shown).

                      FIGURE 6. 3D model of Hikiau Heiau. Inset is the altar on the east end of the temple.

Excavations                                                           excavated cultural deposits from on top of an earth- and stone-
In 2018, we conducted small test excavations to determine when        filled terrace on the North Section that likely represent activities
the Great Wall at Kealakekua was constructed. Our goal was to         dating to when the wall was in use. We had charcoal screened for
recover cultural deposits that predate the enclosing wall’s con-      short-lived species—a necessary step for eliminating long-lived
struction (i.e., deposits from under the wall) and deposits that      taxa—and report here the first reliable radiocarbon dates from the
represent a period when the wall was in use. In brief, we recovered   royal center at Kealakekua.
cultural deposits typical of habitation activities under the East
Section that we interpreted as representing earlier settlements.
On the North Section, natural outcrops at the base of cliffs were
                                                                      Apparent Volume Estimates for Architecture
used to create stone- and earth-filled terraces, including a stone-    We experimented with several different techniques to estimate the
filled terrace with distinctive depressions that we interpret as       apparent volume of architecture—both intact stone and displaced
having held wooden carvings (ki‘i) of substantial sizes. We           rubble—using our terrestrial lidar scan of Hikiau Heiau as a quality

166    Advances in Archaeological Practice | A Journal of the Society for American Archaeology | May 2021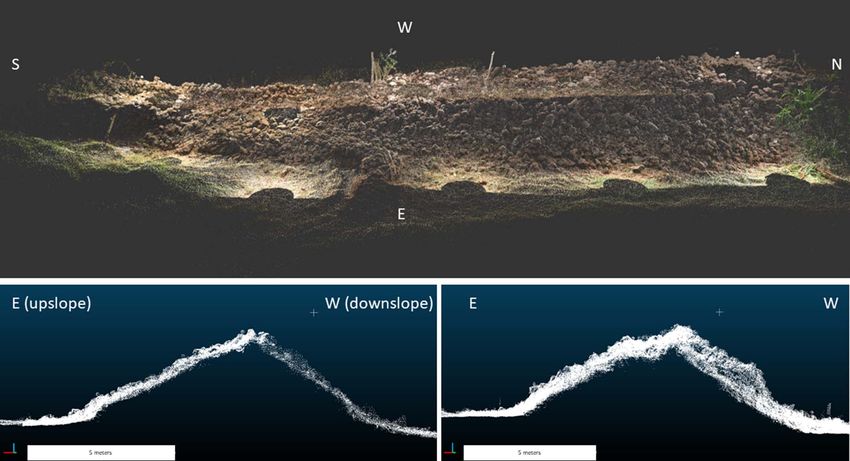
Unpiloted Aerial Vehicle Acquired Lidar for Mapping Monumental Architecture
FIGURE 7. 3D model of East Section of Great Wall, Kealakekua. A small segment of intact wall facing is visible. Note that the
current ground surface is consistently about 60 cm higher on the upslope eastern side of the wall.
control. We began by determining the volume of the Hikiau Heiau RESULTS
model in Cloud Compare (4,234 m3). Next, it was exported to ArcGIS
Pro using the Import 3D Files function (.obj to multipatch) then saved Although the building height technique for estimating volume
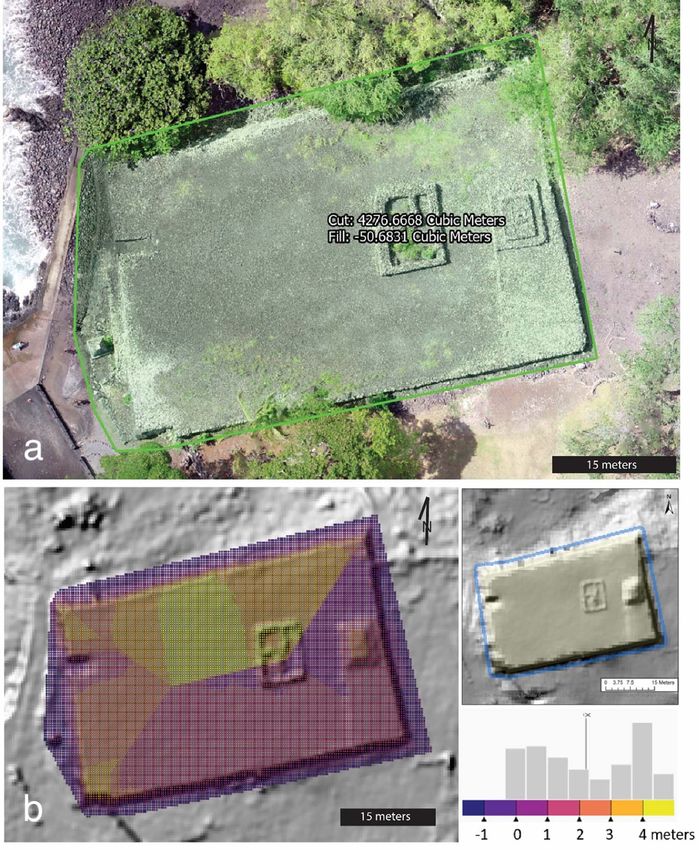
as a TIF to test the image mensuration function (see topic “Image produces a good visualization of the amount of building material
mensuration” in ArcGIS Pro). The ArcGIS Pro image mensuration —as opposed to image mensuration, which only produces a
tool produced a volume estimate for the terrestrial lidar scan iden- quantity metric—it did not produce a good volume estimate for
tical to the Cloud Compare mesh volume estimate (4,188.45 m3 [cut] Hikiau Heiau. The building height technique total volume esti-
+ 45.27 m3 [fill] = 4,233.72 m3 total volume; Figure 8). mate for Hikiau Heiau was 11.7% lower than that determined by
image mensuration of terrestrial lidar (3,726.8 m3 [cut] + 11.8 [fill] =
We also estimated volume using a method for deriving building 3,738.6 m3 total volume). In contrast, when the image mensuration
height from lidar (see topic “Obtaining elevation information for tool was applied to the UAV lidar of for Hikiau Heiau, it produced
building footprints” in ArcGIS Pro). It required first mapping the a result that was within 3% of the terrestrial lidar volume estimate
footprints of architecture. In this case, we created an outline of (4,276.7 m3 [cut] + 50.7 m3 [fill] = 4,327.4 m3 total volume).
Hikiau Heiau and the Great Wall based on a hillshade of the UAV
bare-earth digital elevation model (35 cm resolution). Next, a Our UAV lidar data image mensuration estimate for the extent and
buffer (polygon) around the footprint was created representing volume of the Great Wall at Kealakekua suggests that it was the
the zone greater than 1 m but less than 2 m from features. The largest structure on Hawai’i Island at the time of European contact.
UAV-lidar-based DEM was converted to a point layer, and the Our total estimate, in which we compensate for buried sections of
buffer was used to select a ring of points around each feature. wall and rubble as well as impacts of modern development, puts
These elevation points were used to create an interpolated (IDW the apparent volume at 6,147 m3 (Figure 9). This is based on an
method) estimate of the ground surface under the feature. In the average of 15.7 m3 per LM of wall and a total length of 391.5 m.
final step, the difference between the estimated ground surface This includes 342.5 m of freestanding wall (East Section: 167.5 m;
and the DEM gave positive and negative height values that were South Section: 175 m) that would have been on average 5 m wide
converted to apparent volume (cut and fill) in a point layer. and 3.14 m tall, with an additional 49 m in the North Section where
the wall becomes a terrace along the lower slopes of the valley.
The building height technique described here allows for high- This estimate presumes that the South Section would have
resolution visualizations of features as well as volume estimates extended to the coastline and that the basalt outcrop that defines
(Figure 8). For example, if a single point had a height of 2.5 m, the coastline in this location has been stable.
given that it represented a 0.35 × 0.35 m area, the volume at that
point is 0.31 m3 (0.35 × 0.35 × 2.5 m). To extend this to an entire Although UAV-acquired lidar was the primary instrument we used
feature, one simply selects all the points and sums them. To to arrive at our volume estimate, terrestrial and piloted airborne
extend the example above, if a feature had 10 points with that lidar were also important. The terrestrial lidar scan of a 30 m por-
same height, its total volume is 3.1 m3. tion of the East Section yielded an image mensuration average
May 2021 | Advances in Archaeological Practice | A Journal of the Society for American Archaeology 167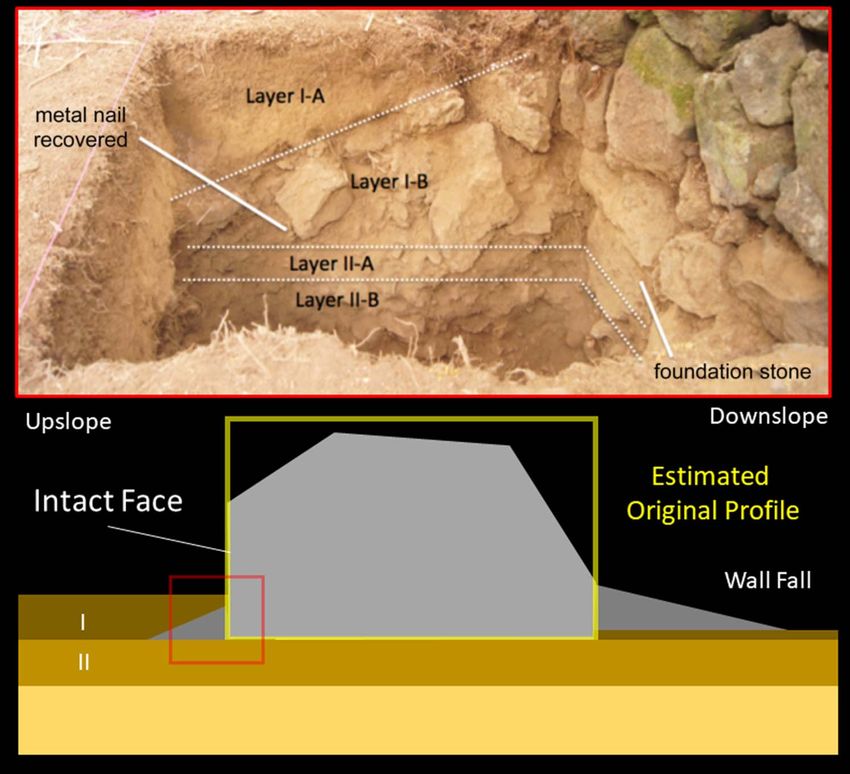
Mark D. McCoy et al.

FIGURE 8. Techniques for estimating apparent volume for architecture: (a) image mensuration and (b) building height. Image
mensuration technique gives a total volume (cut + fill) for a selected area. Building height technique requires creating a buffer of
elevation points and then creating an estimated ground surface below the feature to estimate the height of material. In the case of
Hikiau Heiau, there is a clear contrast between the southeast, where little building material was required (∼1 m building height),
and the northwest (∼4 m building height).

volume of 13.7 m3 per LM of wall and a maximum height above         stones—about 1.6 m3 per LM based on a width of 5 m—but also
the ground surface of 3.25 m. The scans also suggested that the     about 0.4 m3 per LM of wall-fall stones that had accumulated next
upslope side of the wall may have had a great deal of accumulated   to the wall and been buried by erosional deposition. This is how
erosion given that the modern ground surface was slightly, but      we arrived at an average of 15.7 m3 per LM of wall (13.7 m3 above
consistently, much higher than the downslope side. Excavations      ground; 2.0 m3 below ground).
on the upslope side of the wall confirmed that there were at least
62 cm of accumulated soil and stone (Figure 10). We recovered a     Our UAV airborne lidar allowed us to determine independently if
nineteenth-century metal nail fragment under wall fall next to      there is enough rubble today to justify the average volume
foundation stones, which suggests that this rubble began accu-      determined by terrestrial lidar and excavations. The image men-
mulating after the abandonment of the religious precinct. For our   suration technique was applied to all sections of the wall within
image mensuration volume estimate, this meant that we needed        the UAV lidar flights (227.5 m of freestanding wall and 30 m of
to account for not only several courses of buried foundation        terrace). The apparent volume 11.0 m3 per LM of wall found

168    Advances in Archaeological Practice | A Journal of the Society for American Archaeology | May 2021
Unpiloted Aerial Vehicle Acquired Lidar for Mapping Monumental Architecture

FIGURE 9. Estimated building height for the Great Wall at Kealakekua. The current wall is, on average, just over 2 m tall, but our
results suggest that it had an average reconstructed profile of 3.14 m high × 5 m wide × 391.5 m long, with an apparent volume at
6,147 m3.

FIGURE 10. Excavations of the Great Wall at Kealakekua. Test Unit #1 on the upslope side of the wall showed at least two courses
of buried foundation stones and a great deal of rubble (Layer I-B) and slope wash (Layer I-A) that had accumulated after the feature
had been abandoned. Below the rubble, we uncovered a thick cultural deposit (Layer II) that extends under the wall. The cultural
layer, which was also found in shovel tests more than 20 m upslope of the wall, likely represents activity prior to the wall’s con-
struction. In this profile, we distinguish between the portion of the cultural deposit that had eroded from upslope of the wall and
accumulated at the foot of the wall (Layer II-A) and the undisturbed deposit that runs completely under the wall (Layer II-B). Test
Unit #2, on the opposite side of the wall, did not have slope wash, and the cultural layer was recorded as Layer II.

                   May 2021 | Advances in Archaeological Practice | A Journal of the Society for American Archaeology             169
Mark D. McCoy et al.
FIGURE 11. Estimated date of the construction of the Great Wall: AD 1640. Historic records give us a terminus ante quem (TAQ)
for the Great Wall of AD 1779. A radiocarbon date from the North Section (light gray) gives us a terminus post quem (TPQ) of AD
1640 because this is the earliest that deposits could have begun accumulating on top of the wall. No dates from under the East
Section (dark gray) postdate AD 1640. Therefore, we believe that the TPQ is close to the date of construction.
(2,422.1 m3 [cut] + 409.3 m3 [fill] = total volume 2,831.4 m3) can be wall was in use by AD 1779 (terminus ante quem). The new
thought of as a “minimum” volume estimate because it does not radiocarbon results indicate that deposits began accumulating
account for buried wall, rubble, or robbed stone. Compared with on top of the wall no earlier than AD 1640 (terminus post quem).
our estimate, this result is an underestimate of 2.7 m3 per LM The cultural layer below the wall’s foundation stones included
(visible above ground), or about 20% less material than one would materials consistent with precontact habitation in this location
expect based on the best-preserved portion of wall. The building (i.e., charcoal, faunal bone fragments, and volcanic glass and
height technique also gave a volume slightly less than expected, basalt flakes). Four dates on charcoal from short-lived plants from
with an average of 12.1 m3 per LM (2,867.2 m3 [cut] + 254.3 m3 [fill] this layer yielded ranges from cal AD 1440 to 1640 (2σ); earliest
= total volume: 3,121.5 m3). We have not attempted to determine intercept at cal AD 1446–1514 (Table 2). This fits with the
a “maximum” volume estimate because that would be best expectation that, as at Honaunau, there was a coastal settlement
accomplished through further excavations and careful consider- around AD 1450, a date that coincides with dates on coral
ation of the original dimensions of each segment of wall. offerings in upland gardens beginning in AD 1441 ± 19
(AGEG-2016-55; McCoy et al. 2017). The coincidence of the end
Although airborne lidar image mensuration estimates are lower of the accumulation of habitation deposits below the East
than what we would expect, they nonetheless confirm that our Section of the wall and the beginning of dates from deposits on
average of 15.7 m3 per LM of wall is reasonable. This assumes that the North Section of the wall point to a construction date of
up to 20% of the original volume of stone is currently somewhere around AD 1640.
outside of the estimated extent of rubble due to both natural
degradation and the robbing of stone to create other walls. We
note that there are hundreds of meters of walls, likely built during DISCUSSION
the historic era, within the valley.
The availability of lidar by more—and more affordable—platforms
To determine the likely date of construction, we radiocarbon means that future archaeological survey will undoubtedly involve
dated material from cultural deposits under the wall as well as datasets collected at a range of resolutions and geographic
deposits on top of the wall (Figure 11). The excavation on top of scales. Today, most lidar studies center on small geographic scale
a terrace on the North Section yielded a calibrated date of AD survey (i.e., millimeter resolution data over hundreds of square
1640–1800 with a narrow intercept at cal AD 1646–1669 (2σ; meters made possible with handheld and terrestrial lidar) or large
Table 2). Historic records give us independent evidence that the geographic scale survey (i.e., sub-meter-scale resolution over
170 Advances in Archaeological Practice | A Journal of the Society for American Archaeology | May 2021Unpiloted Aerial Vehicle Acquired Lidar for Mapping Monumental Architecture
square kilometers by piloted lidar). UAV-acquired lidar data fills
Common Name
the gap between these two extremes.
‘āweoweo
‘āweoweo
One of the things that sets a UAV-acquired lidar survey apart from
data gathered using other lidar techniques is the capacity for data
kukui
visualization. Here, we make the distinction between representa-
—
—
—
tive visualization, as in the lifelike images possible with terrestrial
lidar, and data visualization aimed at “the discovery of new infor-
Indeterminate hardwood twig
Indeterminate hardwood twig
Chenopodium oahuense twig
Chenopodium oahuense twig
mation, patterns, or relationships among variables through
Aleurites moluccana nutshell exploratory analyses of spatial representations of data” (McCoy
and Ladefoged 2009:265). Although piloted airborne lidar has
Wood Identification
been used to map traditional architecture (Ladefoged et al. 2011;
Asparagaceae stem
McCoy et al. 2011), and terrestrial lidar has been used to estimate
volume (Mulrooney et al. 2005), this study is the first use of UAV
lidar in the Hawaiian Islands. The data visualizations possible with
30 points per m2 via the building height technique, but also more
commonly used techniques (i.e., Relief Visualization Toolkit; Kokalj
and Somrak 2019; Zakšek et al. 2011), provided much more precise
for imaging of archaeological features compared with previous
airborne lidar datasets.
KONA-18-03-7 / TU#1, Ly II-A
K`ONA-18-06-16, TU#2, Ly II
KONA-18-05-10, TU#2, Ly II
KONA-18-05-12, TU#2, Ly II
KONA-18-05-13, TU#2, Ly II
KONA-18-07-19 TU#4, Ly II
Twenty years ago, the capacity for piloted airborne lidar to miti-
TABLE 2. Radiocarbon Dating Results, Kealakekua.
gate the problem of vegetation obscuring our view of the land-
scape kicked off the development of a number of innovative
Sample/Test Unit
methods to bring out the subtle topography of archaeological
features. Many of these efforts have focused on detecting and
extracting different types of features from bare-earth models (e.g.,
Casana 2014; Forest et al. 2020; Howey et al. 2016; Kokalj et al.
2011; McCoy et al. 2011; Sevara et al. 2016; Quintus et al. 2017).
These new data, plus the tools to visualize them, changed the way
we “see” the archaeological record (Huggett 2020; McCoy 2020a,
2020b; VanValkenburgh and Dufton 2020). In the next stages of
the geospatial revolution in archaeology, we will need to find
1460–1640
1450–1640
1460–1640
1440–1620
1470–1640
1640–1800
cal AD, 2σ
more ways to leverage our steady stream of different kinds of lidar
data (McCoy 2017b), create more kinds of visualizations that are
useful for archaeology, and carefully consider which remote-
sensing techniques are appropriate for the goal of the project
(Casana 2020).
cal BP, 2σ
490–310
500–310
490–310
510–330
480–310
310–159
None of these technologies come with tools to bridge the gap
Sources: OxCal v.4.3.2 (Bronk Ramsey 2017), IntCal13 (Reimer et al. 2013).
between data collection and the creation of information relevant
Note: Dates reported by Waikato Radiocarbon Dating Laboratory (Wk).
to answering archaeological questions (for a discussion of data,
information, and evidence in the context of geospatial technol-
ogy, see McCoy 2020a:17–44). In this case, lidar data from other
18
18
18
18
18
18
sd
platforms improved and expanded what we could do with the
UAV-acquired lidar. Piloted lidar was key to correcting the abso-
lute elevations of the UAV lidar (i.e., meters above sea level)
CRA
357
360
353
389
343
230
because it had greater geographic range and quality checks
against established benchmarks. Terrestrial lidar also proved
invaluable as a check against our UAV-lidar-based estimates of the
95.6 ± 0.2
95.6 ± 0.2
95.7 ± 0.2
95.3 ± 0.2
95.8 ± 0.2
97.2 ± 0.2
volume of features. Other projects planning to use and evaluate
UAV lidar in the future would do well to ground-truth measure-
δ13C
ments using terrestrial lidar. We would also note that although our
focus is on lidar data, there is no reason why photogrammetric
models could not also be used as a cross-check on volume
estimates.
Lab Identification
We are not the first to derive apparent volume for archaeological
Wk-48683
Wk-48684
Wk-48685
Wk-48686
Wk-48687
Wk-48688
features. Many of the advances in this aspect of mapping have
focused on techniques that are customized to the type of land-
form and shape of the archaeological target, but they are also
limited to methods that are scalable to thousands of structures
May 2021 | Advances in Archaeological Practice | A Journal of the Society for American Archaeology 171Mark D. McCoy et al.
(Chase 2017; Ebert et al. 2016; Menze and Ur 2012; Stanton et al. airborne lidar covering more than 10 ha (30 ground points per m2),
2020). In this study, the main target of our survey was one large along with small-scale tripod-based terrestrial lidar and large-scale
structure—the Great Wall at Kealakekua. It is unevenly preserved. piloted airborne lidar. We tested a tool for estimating volume
Some sections are in good condition, whereas others have been (image mensuration, ArcGIS Pro) and adapted a technique for
extensively modified, robbed of stone, and degraded to rubble. estimating building height from lidar to visualize construction fill.
The combination of the geographic scale and resolution of UAV Our targets were a well-maintained temple—Hikiau Heiau—and a
lidar allowed us to not only map even poorly preserved sections massive but poorly documented wall that surrounded the religious
but also estimate apparent volume of building material. Lidar, of precinct within which the temple was situated. UAV-acquired lidar
course, cannot penetrate the ground surface. But terrestrial lidar survey data, when paired with excavations and radiocarbon dat-
showed how a small portion of wall had been partially buried by ing, suggests that the Great Wall at Kealakekua was likely the
slope wash—a finding that we confirmed through excavation. In largest structure built on the island prior to European contact in
sum, although the ArcGIS Pro image mensuration technique gave AD 1779. We speculate that the construction of the wall around
a reliable total volume (cut + fill) for a selected area, it would AD 1640 marks a key point in the evolution of the Makahiki
require modification to be useful for projects involving thousands ceremony when it came to resemble how it was practiced at
of structures. contact, and it suggests that expressions of religious authority
continued to evolve during the transition from a chiefdom to an
Our results suggest that the Great Wall at Kealakekua was likely archaic state society.
the largest structure built on Hawai’i Island prior to European
contact. The feature is 45% larger, by apparent volume, than Acknowledgments
Hikiau Heiau—which is located within the religious precinct at
Kealakekua—22% larger than the war temple Pu‘ukohalā Heiau, This research was conducted in collaboration with Ho‘ala
and slightly larger than the Great Wall at Honaunau. Its design is Kealakekua and supported by a grant from the University of
also notable. It is, for example, the same apparent volume per Auckland, along with in-kind support from the Hawai’i State Parks
LM of wall as sections of Hadrian’s Wall built in AD 122 to pro- and the Bishop Museum. Special thanks to Tracy Tam-Sing and
tect the boundary of the Roman Empire in Northern England. Gordon Leslie for their k
okua. Mahalo to everyone who lent a
But the height of Hadrian’s Wall was, in places, greater than its hand in making this project a success: Hayley Glover, Rob
width (i.e., 5 m high × 3 m wide), whereas the Great Wall at Hommon, Ann Horsburgh, Jen Huebert, David Ingleman, Adam
Kealakekua is the reverse (i.e., 3 m high × 5 m wide). It is possible Johnson, Ben Jones, Patrick Kirch, Gordon Leslie, Keone Leslie,
that Hawaiian architects tasked with building such a massive Tania Leslie, Bronson Leslie, Reagan Leslie, Shane Akoni Nelsen,
structure were aware of the potential hazard that earthshaking Sarina Pearson, Tracy Tam-Sing, Ben Teele, Charmaine Wong,
would have posed a narrow dry-masonry stone wall. Future Martha Yent, and Rose Young. Thanks to Karolyn Buhring and
studies of monumental architecture within a seismically active Conny Pellegrino for their help in translating the abstract to
area such as the Hawaiian Islands hold a great deal of potential Spanish. This manuscript was improved thanks to comments from
to expand the study of archaeoseismology, a field in which several anonymous reviewers.
ancient architectural traditions have been used as proxy evi-
dence for the awareness of earthquakes as a natural hazard in Data Availability Statement
the era before seismic instrumentation and record keeping (e.g.,
Piloted lidar data is available from NOAA’s Office for Coastal
Sintubin 2011).
Management (https://coast.noaa.gov/dataviewer/#/). UAV lidar
and terrestrial lidar data are on file with the State Parks of Hawai’i.
As a material expression of the power of state religion in Hawai’i,
Unedited terrestrial lidar is also accessible at Sketchfab for the
and more specifically the efforts made in service of the Makahiki
Great Wall (https://skfb.ly/6UXGr) and Hikiau Heiau (https://skfb.ly/
festival, the Great Wall at Kealakekua is an excellent metric. The
6YSFw). Supplemental UAV-lidar data files are also available at
limitations of radiocarbon dating mean that we do not know how
https://figshare.com/s/2a54d841416f7648a72f and https://figshare.
long it took to build, but we conclude that it was completed
com/s/36d0bc2d1fb465fc8ef4.
around AD 1640. Without high-quality dates in association with
architecture from the more than two dozen other royal centers
across the Hawaiian Islands, it is difficult to say how Kealakekua fits
within the transition to a state society. But, given that oral histories
REFERENCES CITED
put the shift of the island’s capital to the Kona coast slightly Athens, J. Stephen, Jerome V. Ward, and Dean W. Blinn
earlier, at AD 1600, it may be that Makahiki ceremonies took the 2007 Paleoenvironment of Pu‘uhonua o H onaunau National Historical Park,
form observed at the time of European contact after society was South Kona, Hawai‘i Island. Report prepared for the National Park Service
well on its way to transitioning to an archaic state. by International Archaeological Research Institute, Honolulu. Report on file
with Hawaii State Historic Preservation Office, Department of Land and
Natural Resources, Kapolei.
CONCLUSION Barbour, Terry E., Kenneth E. Sassaman, Angelica Maria Almeyda Zambrano,
Eben North Broadbent, Ben Wilkinson, and Richard Kanaski
2019 Rare Pre-Columbian Settlement on the Florida Gulf Coast Revealed
Lidar for small geographic scale survey using a range of ground-
through High-Resolution Drone LiDAR. PNAS 116:23493–23498.
based platforms (handheld, mobile, and tripod-based terrestrial Bronk Ramsey, Christopher
lidar) and large geographic scale survey using airborne platforms 2017 Methods for Summarizing Radiocarbon Datasets. Radiocarbon 59:1809–
(piloted aircraft) are increasingly common in archaeology. We 1833.
present a method for studying monumental architecture on a Casana, Jesse
medium geographic scale that leverages new UAV-acquired 2014 Regional-Scale Archaeological Remote Sensing in the Age of Big Data:
172 Advances in Archaeological Practice | A Journal of the Society for American Archaeology | May 2021Unpiloted Aerial Vehicle Acquired Lidar for Mapping Monumental Architecture
Automated Site Discovery vs. Brute Force Methods. Advances in Kirch, Patrick V., Regina Mertz-Kraus, and Warren D. Sharp
Archaeological Practice 2:222–233. 2015 Precise Chronology of Polynesian Temple Construction and Use for
2020 Global-Scale Archaeological Prospection Using CORONA Satellite Southeastern Maui, Hawaiian Islands Determined by 230Th Dating of
Imagery: Automated, Crowd-Sourced, and Expert-Led Approaches. Corals. Journal of Archaeological Science 53:166–177.
Journal of Field Archaeology 45:S89–S100. Kokalj, Žiga, and Maja Somrak
Casana, Jesse, Elise J. Laugier, Austin Chad Hill, Kelsey M. Reese, Carolin 2019 Why Not a Single Image? Combining Visualizations to Facilitate
Ferwerda, Mark D. McCoy, and Thegn Ladefoged Fieldwork and On-Screen Mapping. Remote Sensing 11(7):747.
2021 Exploring Archaeological Landscapes Using Drone-Acquired Lidar: Case Kokalj, Žiga, Klemen Zakšek, and Krištof Ošti
Studies from Hawai’i, Colorado, and New Hampshire, USA. Manuscript on 2011 Application of Sky-View Factor for the Visualization of Historic
file, Dartmouth College, Hanover, New Hampshire. Landscape Features in Lidar-Derived Relief Models. Antiquity 85:263–273.
Chase, Adrian S. Z. Kolb, Michael J.
2017 Residential Inequality among the Ancient Maya: Operationalizing 1991 Social Power, Chiefly Authority, and Ceremonial Architecture in an Island
Household Architectural Volume at Caracol, Belize. Research Reports in Polity, Maui, Hawaii. PhD dissertation, Department of Anthropology,
Belizean Archaeology 14:31–39. University of California, Los Angeles.
Cordy, Ross 1994 Monumentality and the Rise of Religious Authority in Precontact Hawai’i.
2000 Exalted Sits the Chief: The Ancient History of Hawai‘i Island. Mutal Current Anthropology 35:521–547.
Publishing, Honolulu, Hawaii. 1997 Labor Mobilization, Ethnohistory, and the Archaeology of Community in
DeMarrais, Elizabeth, Luis Jaime Castillo, and Timothy Earle Hawai’i. Journal of Archaeological Method and Theory 4:265–285.
1996 Ideology, Materialization, and Power Strategies. Current Anthropology 1999 Monumental Grandeur and Political Florescence in Pre-Contact
37:15–31. Hawai’i: Excavations at Pi’ilanihale Heiau, Maui. Archaeology in Oceania
Ebert, Claire E., Julie A. Hoggarth, and Jaime J. Awe 34:73–84.
2016 Integrating Quantitative LiDAR Analysis and Settlement Survey in the Ladd, Edward
Belize River Valley. Advances in Archaeological Practice 4:284–300. 1969a Alealea Temple Site, Honaunau: Salvage Report. In Archaeology on the
Emory, Kenneth E. (editor) Island of Hawai‘i, edited by Richard Pearson, pp. 95–130. Asian and Pacific
1986 The Natural and Cultural History of Honaunau, Kona, Hawai’i. Archaeology Series No. 3. University of Hawai‘i, Honolulu.
Departmental Report Series 86-2. Bernice P. Bishop Museum, Honolulu, 1969b Hale-o-Keawe Temple Site, Honaunau: Salvage Report. In Archaeology
Hawaii. on the Island of Hawai‘i, edited by Richard Pearson, pp. 163–189. Asian and
Flannery, Kent V. Pacific Archaeology Series No. 3. University of Hawai‘i, Honolulu.
1998 The Ground Plans of Archaic States. In Archaic States, edited by Gary Ladefoged, Thegn N., Mark D. McCoy, Gregory P. Asner, Patrick V. Kirch, Cedric
M. Feinman and Joyce Marcus, pp. 15–57. School of American Research, O. Puleston, Oliver A. Chadwick, and Peter M. Vitousek
Santa Fe, New Mexico. 2011 Agricultural Potential and Actualized Development in Hawai’i: An
Forest, Marion, Laurent Costa, Andy Combey, Antoine Dorison, and Airborne LiDAR Survey of the Leeward Kohala Field System (Hawai‘i Island).
Grégory Pereira Journal of Archaeological Science 38:3605–3619.
2020 Testing Web Mapping and Active Learning to Approach Lidar Data. Malo, David
Advances in Archaeological Practice 8:25–39. 1951 Hawaiian Antiquities (Moolelo Hawaii). University of Hawaii Press,
Hommon, Robert J. Honolulu.
1969 An Intensive Survey of the Northern Portion of Kaawaloa, Kona, Hawaii. McCoy, Mark D.
Department of Anthropology, Bernice P. Bishop Museum, Honolulu, 2017a An Archaeological Survey of Nā po‘opo‘o, Kealakekua, Hawai‘i Island.
Hawaii. Report on file with Hawai‘i State Parks, Honolulu, USA.
2013 The Ancient Hawaiian State: Origins of a Political Society. Oxford 2017b Geospatial Big Data in Archaeology: Prospects and Problems Too
University Press, Oxford. Great to Ignore. Journal of Archaeological Science 84:74–94.
2014 The Kealakekua Region: Salubrious Core, Political Centre. Journal of 2018 Celebration as a Source of Power in Archaic States: Archaeological and
Pacific Archaeology 5(2):40–50. Historical Evidence for the Makahiki Festival in the Hawaiian Islands. World
Howey, Meghan C. L., Franklin B. Sullivan, Jason Tallant, Robert Vande Kopple, Archaeology 50:242–270.
and Michael W. Palace 2020a Maps for Time Travelers: How Archaeologists Use Technology to Bring
2016 Detecting Precontact Anthropogenic Microtopographic Features in a Us Closer to the Past. University of California Press, Oakland.
Forested Landscape with Lidar: A Case Study from the Upper Great Lakes 2020b The Site Problem: A Critical Review of the Site Concept in Archaeology
Region, AD 1000–1600. PLoS ONE 11(9):e0162062. DOI:10.1371/journal. in the Digital Age. Journal of Field Archaeology 45:S18–S26
pone.0162062. McCoy Mark D, Gregory P. Asner, and Michael W. Graves
Huggett, Jeremy 2011 Airborne Lidar Survey of Irrigated Agricultural Landscapes: An
2020 Is Big Digital Data Different? Towards a New Archaeological Paradigm. Application of the Slope Contrast Method. Journal of Archaeological
Journal of Field Archaeology 45:S8–S17. Science 38(9):2141–2154.
Kamakau, Samuel McCoy, Mark D., and Thegn N. Ladefoged
1961 Ka Po‘e Kahiko: The People of Old. Bernice P. Bishop Special 2009 New Developments in the Use of Spatial Technology in Archaeology.
Publications 51. Bishop Museum Press, Honolulu, Hawaii. Journal of Archaeological Research 17:263–295.
Kirch, Patrick V. 2018 Archaeological Research in Kealakekua Bay Historical State Park, Hawai‘i
1985 Feathered Gods and Fishhooks: An Introduction to Hawaiian Island: 2018 Field Season. Report on file with Hawai‘i State Parks, Honolulu,
Archaeology and Prehistory. University of Hawaii Press, Honolulu. USA.
2010 How Chiefs Became Kings: Divine Kingship and the Rise of Archaic McCoy, Mark D., Thegn N. Ladefoged, and Jesse Casana
States in Ancient Hawai‘i. University of California Press, Berkeley. 2020 Report on the Utility of Unpiloted Aerial Vehicle (UAV) Archaeological
2011 When Did the Polynesians Settle Hawai’i? A Review of 150 Years of Survey in Kealakekua Bay Historical State Park, Keolonā hihi State Historical
Scholarly Inquiry and a Tentative Answer. Hawaiian Archaeology 12:1–26. Park, and Lapakahi State Historical Park, Hawai‘i Island. Report on file with
Kirch, Patrick V., and Roger C. Green Hawai‘i State Parks, Honolulu.
2001 Hawaiki, Ancestral Polynesia: An Essay in Historical Anthropology. McCoy, Mark D., Mara A. Mulrooney, Mark Horrocks, Hai Cheng, and Thegn
Cambridge University Press, Cambridge. N. Ladefoged
Kirch, Patrick V., John Holson, and Alexander Baer 2017 Evaluating Agricultural Bet-Hedging Strategies in the Kona Field
2010 Intensive Dryland Agriculture in Kaup o, Maui, Hawaiian Islands. Asian System: New High-Precision 230Th/U and 14C Dates and Plant Microfossil
Perspectives 48:265–290. Data from Kealakekua, Hawai‘i Island. Archaeology in Oceania 52:70–80.
May 2021 | Advances in Archaeological Practice | A Journal of the Society for American Archaeology 173You can also read