Indocyanine-green-loaded microballoons for biliary imaging in cholecystectomy
←
→
Page content transcription
If your browser does not render page correctly, please read the page content below
Indocyanine-green-loaded microballoons
                 for biliary imaging in cholecystectomy

                 Kinshuk Mitra
                 James Melvin
                 Shufang Chang
                 Kyoungjin Park
                 Alper Yilmaz
                 Scott Melvin
                 Ronald X. Xu

Downloaded From: https://www.spiedigitallibrary.org/journals/Journal-of-Biomedical-Optics on 31 Oct 2021
Terms of Use: https://www.spiedigitallibrary.org/terms-of-use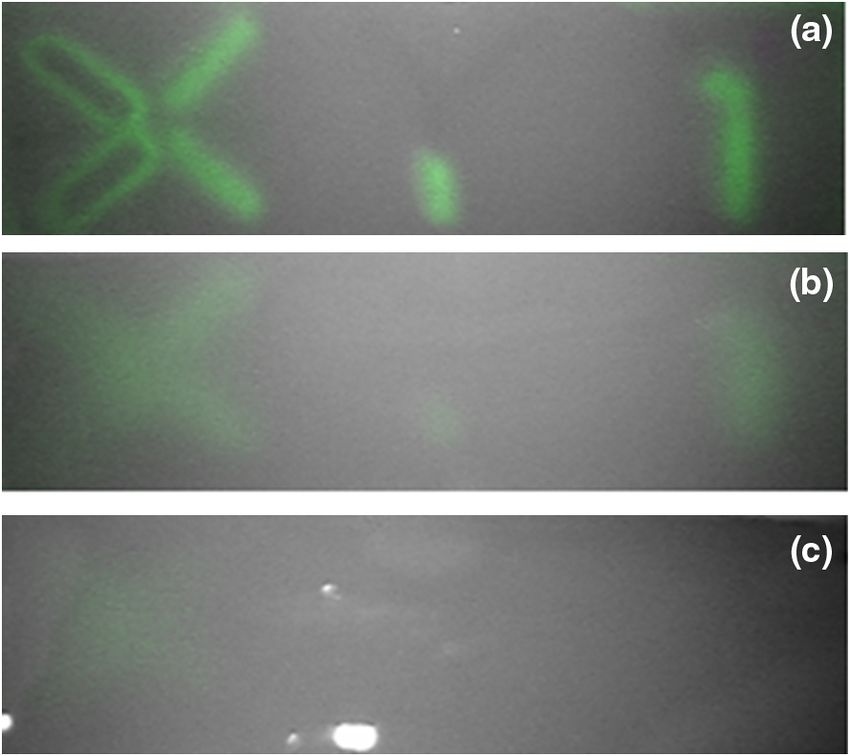
Journal of Biomedical Optics 17(11), 116025 (November 2012)

                Indocyanine-green-loaded microballoons for
                biliary imaging in cholecystectomy
                Kinshuk Mitra,a James Melvin,a Shufang Chang,a Kyoungjin Park,b Alper Yilmaz,b Scott Melvin,c and Ronald X. Xua
                a
                  Ohio State University, Department of Biomedical Engineering, Columbus, Ohio 43210
                b
                  Ohio State University, Photogrammetric Computer Vision Lab, Columbus, Ohio 43210
                c
                  Ohio State University, Department of Surgery, Columbus, Ohio 43210

                              Abstract. We encapsulate indocyanine green (ICG) in poly[(D,L-lactide-co-glycolide)-co-PEG] diblock
                              (PLGA-PEG) microballoons for real-time fluorescence and hyperspectral imaging of biliary anatomy. ICG-loaded
                              microballoons show superior fluorescence characteristics and slower degradation in comparison with pure ICG.
                              The use of ICG-loaded microballoons in biliary imaging is demonstrated in both biliary-simulating phantoms and an
                              ex vivo tissue model. The biliary-simulating phantoms are prepared by embedding ICG-loaded microballoons in
                              agar gel and imaged by a fluorescence imaging module in a Da Vinci surgical robot. The ex vivo model consists of
                              liver, gallbladder, common bile duct, and part of the duodenum freshly dissected from a domestic swine. After
                              ICG-loaded microballoons are injected into the gallbladder, the biliary structure is imaged by both hyperspectral
                              and fluorescence imaging modalities. Advanced spectral analysis and image processing algorithms are developed
                              to classify the tissue types and identify the biliary anatomy. While fluorescence imaging provides dynamic infor-
                              mation of movement and flow in the surgical region of interest, data from hyperspectral imaging allow for rapid
                              identification of the bile duct and safe exclusion of any contaminant fluorescence from tissue not part of the biliary
                              anatomy. Our experiments demonstrate the technical feasibility of using ICG-loaded microballoons for biliary ima-
                              ging in cholecystectomy. © 2012 Society of Photo-Optical Instrumentation Engineers (SPIE). [DOI: 10.1117/1.JBO.17.11.116025]
                              Keywords: microbubble; microcapsule; microballoon; indocyanine green; cholecystectomy; bile duct injury; hyperspectral imaging;
                              fluorescence imaging.
                              Paper 12482 received Jul. 26, 2012; revised manuscript received Oct. 10, 2012; accepted for publication Oct. 15, 2012; published online
                              Nov. 19, 2012.

                1     Introduction                                                                 has not been fully validated.5,13 Other hurdles that prevent
                A cholecystectomy (i.e., surgical removal of the gallbladder) is                   the routine clinical use of IOC include the added cost, the equip-
                one of the most commonly performed abdominal surgical pro-                         ment size, the radiation hazard, the risk of IOC-induced bile duct
                cedures in the United States. Bile duct injury during a cholecys-                  injury, and the adverse effect of the contrast agent.
                tectomy is an iatrogenic accident that has a substantial impact on                     Recently, fluorescent cholangiography was explored for
                perioperative morbidity, mortality, long-term survival, and qual-                  intraoperative imaging of biliary anatomy.14,15 The technique
                ity of life.1–4 Bile duct injury occurs in one out of 200 to 400                   was based on systemic injection of indocyanine green (ICG)
                cholecystectomy operations, making it one of the leading                           and fluorescence imaging of the leaked ICG to the bile. The
                sources of medical malpractice claims against surgeons.5 Pre-                      process takes at least 25 min16 and is not suitable for imaging
                vious surveys show that 34% to 49% of surgeons are expected                        other internal structures such as the ureter.17 Besides, quantita-
                to cause such an injury during their career.6,7 Known risk factors                 tive analysis of ICG-induced absorption and fluorescence emis-
                for bile duct injury include aberrant anatomy, inflammatory                        sion is difficult, due to odd optical characteristics contributed by
                changes, severity of the illness, excessive intraoperative bleed-                  molecular aggregation and protein interaction.18 In aqueous
                ing, and other local procedures such as hepatobiliary surgeries.8                  solution, the absorption and the emission peaks of ICG change
                Since the primary cause for error in 97% of laparoscopic bile                      with the dye concentration, due to molecular aggregation. In
                duct cases is visual misperception,9 clear delineation of the bili-                other solutions, such as plasma and human serum albumin,
                ary anatomy is important. However, this can be difficult, and                      the nonspecific binding of ICG with both lipophilic and hydro-
                inadvertent injuries still occur, despite adequate training and                    philic molecular species makes its absorption and emission
                experience. Various methods have been explored to avoid                            spectra significantly different from those of the aqueous solu-
                bile duct injury. One common method is intraoperative cholan-                      tion. Furthermore, ICG degrades in the aqueous solution. The
                giography (IOC).5,10,11 IOC is based on fluoroscopic imaging of                    degradation rate, which we define as the rate at which fluores-
                the biliary tree after the regional infusion of radiographic con-                  cence intensity declines in a given period, is accelerated by light
                trast through a cholangiogram catheter placed in the cystic duct                   exposure and elevated temperature.19 Finally, ICG has a short
                under direct vision. Although prospective clinical trials have                     circulation half-life of around 2 to 4 min before it is taken
                demonstrated its usefulness,12 the clinical effectiveness of                       up exclusively by hepatic parenchymal cells and secreted
                IOC in preventing bile duct injury during cholecystectomy                          entirely into the bile.18 In summary, ICG in its original form
                                                                                                   is not appropriate for quantitative biomedical imaging applica-
                                                                                                   tions. Encapsulating ICG in biodegradable micro- and
                Address all correspondence to: Ronald X. Xu, The Ohio State University, Depart-
                ment of Biomedical Engineering, Columbus, Ohio, 43210. Tel: 614-688-3635;
                Fax: 614-292-7301; E-mail: xu.202@osu.edu                                          0091-3286/2012/$25.00 © 2012 SPIE

                Journal of Biomedical Optics                                                 116025-1                                    November 2012    •   Vol. 17(11)

Downloaded From: https://www.spiedigitallibrary.org/journals/Journal-of-Biomedical-Optics on 31 Oct 2021
Terms of Use: https://www.spiedigitallibrary.org/terms-of-use
Mitra et al.: Indocyanine-green-loaded microballoons for biliary imaging . . .

                nanoparticles may protect it from molecular interactions and                       aqueous solution of PVA in an ice bath and emulsified for
                enhance its fluorescence stability.20,21 Hyperspectral imaging                     the second time at 500 rpm for 2 min. Isopropanol was
                and advanced imaging analysis methods such as co-registration                      added to the double emulsion and stirred for 1.5 h by a magnetic
                and segmentation may be further integrated with fluorescence                       stirrer. After that, the mixture was centrifuged (5810R, Eppen-
                imaging to provide surgeons with complete information of                           dorf, Hamburg, Germany) at 4000 rpm for 5 min. The superna-
                the gross anatomy under surgery. This second modality serves                       tant was discarded, and the microballoon precipitate was freeze
                to co-validate the image information obtained by the surgeon.                      dried for 24 h. The freeze dried microballoons were washed with
                Nearby tissue contaminated by contrast agent can be safely                         water and centrifuged at 4000 rpm for 5 min. The process was
                excluded from the operative region of interest using a hyper-                      repeated three times until the free ICG was washed away. Then
                spectral image of tissue. Operative imaging of the other tubules                   the washed microballoons were freeze dried once more for 24 h,
                such as ureters would also greatly benefit from such a system, as                  harvested, and stored in a glass bottle at 0°C for further use. To
                the softness and small size of the tissue would allow for diffu-                   prevent ICG photobleaching, the containers were covered by
                sion of contrast media into surrounding tubules generating noise                   aluminum foils for the entire process. In comparison with our
                and operative uncertainty. The hyperspectral image would pro-                      previous double emulsion process,25 this modified process
                vide surgeons with background information on tissue type over                      increased the ICG encapsulation efficiency by a factor of two.
                which real-time imaging information from the contrast media                            The loading rate of ICG-loaded microballoons was charac-
                can be overlaid. Considering that as many as 90% of bile                           terized by a Cary 50 Bio UV-Vis spectrophotometer (Agilent
                duct injuries cannot be diagnosed during surgery11 and that                        Technologies, Santa Clara, California). The microballoons were
                the repair of these injuries adds significant cost and complex-                    dissolved in DMSO. The absorption spectrum was acquired and
                ity,22 it is important to develop such low-cost and real-time ima-                 compared with the calibration standard in order to calculate the
                ging techniques for intraoperative identification of the biliary                   ICG concentration. The ICG loading rate was calculated by the
                anatomy and for accurate assessment of bile duct injury.                           formula
                    This paper reports the development of an ICG-loaded micro-
                balloon agent that can be injected in the gallbladder for intrao-                                            ICG in Microballoon ðmgÞ
                                                                                                      Loading Rate ð%Þ ¼                               × 100:
                perative biliary imaging in cholecystectomy. ICG was loaded                                                  Mass of Microballoon ðmgÞ
                into a hollow poly[(D,L-lactide-co-glycolide)-co-PEG] diblock
                (PLGA-PEG) balloon by a modified double emulsion process.
                The particles are described using the term “microballoons” (also                   2.2     Fluorescence Characterization of ICG-Loaded
                called “microbubbles” or “microcapsules”), because one of the                              Microballoons
                constituent media encapsulates the other in a hollow core-shell
                structure.23 Spectroscopic measurements showed that the fluor-                     Unlike conventional fluorescence cholangiography where ICG
                escence characteristics and the degradation rate of ICG-loaded                     was injected systemically and leaked into the bile, we propose a
                microballoons are superior to those of pure ICG. The clinical                      biliary imaging technique where aqueous suspension of
                feasibility of using ICG-loaded microballoons for biliary ima-                     ICG-loaded microballoons is directly injected in the gallbladder.
                ging was demonstrated in both tissue-simulating phantoms                           Since ICG has a molecular structure with both hydrophilic and
                and an ex vivo tissue model. Fluorescence and hyperspectral                        lipophilic characteristics, its fluorescence emission may vary
                imaging tests in the ex vivo tissue model clearly demonstrated                     with surrounding water and protein compositions significantly.18
                their surgical benefits. To the best of the authors’ knowledge,                    We hypothesize that encapsulating ICG in PLGA-PEG micro-
                using ICG-loaded microballoons for dual-mode fluorescence                          balloons will protect ICG from molecular interactions with bile
                and hyperspectral imaging of biliary anatomy has not been                          juice, provide a stable fluorescence spectrum, and achieve a
                reported elsewhere.                                                                slower degradation rate for biliary imaging. In order to test
                                                                                                   this hypothesis, a bile-simulating liquid was prepared by dissol-
                                                                                                   ving lecithin in diethyl ether and then adding water to the con-
                2     Materials and Methods
                                                                                                   centration of 0.1 g∕ml. Aliquots of varying amounts of
                2.1     Fabrication of ICG-Loaded Microballoons                                    ICG-loaded microballoons were mixed with the liquid. The sus-
                                                                                                   pensions were illuminated by a 782-nm laser source, and the
                ICG was obtained from Sigma Aldrich (St. Louis, Missouri).                         fluorescence spectra were measured by a USB4000 fluorescent
                Resomer® RGP d 50155 poly[(D,L-lactide-co-glycolide)-co-                           spectrometer (Ocean Optics, Dunedin, Florida). As the control,
                PEG] diblock (PLGA-PEG) was obtained from Envonik Indus-                           pure ICG was dissolved in the bile-simulating liquid at various
                tries (Piscataway, New Jersey). Ten percent Intralipid was                         concentrations, and the fluorescence spectra were compared
                obtained from Physician Sales & Services, Inc. (Leetsdale,                         with those of ICG-loaded microballoons.
                Pennsylvania). Dichloromethane (CH2 CL2 ), dimethyl sulfoxide                          We also hypothesize that ICG-loaded microballoons will
                (DMSO), lecithin, isopropanol, and polyvinyl alcohol (PVA)                         retain higher fluorescence intensity over a surgically relevant
                were obtained from Sigma Aldrich (St. Louis, Missouri). ICG                        time span in comparison with the ICG solution. In order to
                was encapsulated in PLGA-PEG microballoons using a double                          test this hypothesis, we prepared both an aqueous solution of
                emulsion process24 with modification. A 5-ml PLGA-PEG solu-                        ICG and an aqueous suspension of ICG-loaded microballoons.
                tion of CH2 CL2 (1.0% w/v), a 10-ml aqueous solution of PVA                        Care was taken to ensure the comparable fluorescence intensi-
                (0.6% w/v), a 0.5-ml aqueous solution of ICG (0.65 mM), and                        ties among the samples. Both samples were stored in a dimly lit
                1.0 ml of isopropanol were prepared in advance. The aqueous                        and room temperature environment, with their fluorescence
                solution of ICG was added to the PLGA-PEG solution of                              spectra acquired periodically for up to 30 h. The degradation
                CH2 Cl2 and emulsified in an ice bath by a homogenizer                             rates of ICG and ICG-loaded microballoons were calculated
                (Omni International, Waterbury, Connecticut) at 20,000 rpm                         based on the exponential curve fitting of the peak fluorescence
                for 3 min. Then the first emulsion was added dropwise to the                       intensities.

                Journal of Biomedical Optics                                               116025-2                                     November 2012   •   Vol. 17(11)

Downloaded From: https://www.spiedigitallibrary.org/journals/Journal-of-Biomedical-Optics on 31 Oct 2021
Terms of Use: https://www.spiedigitallibrary.org/terms-of-use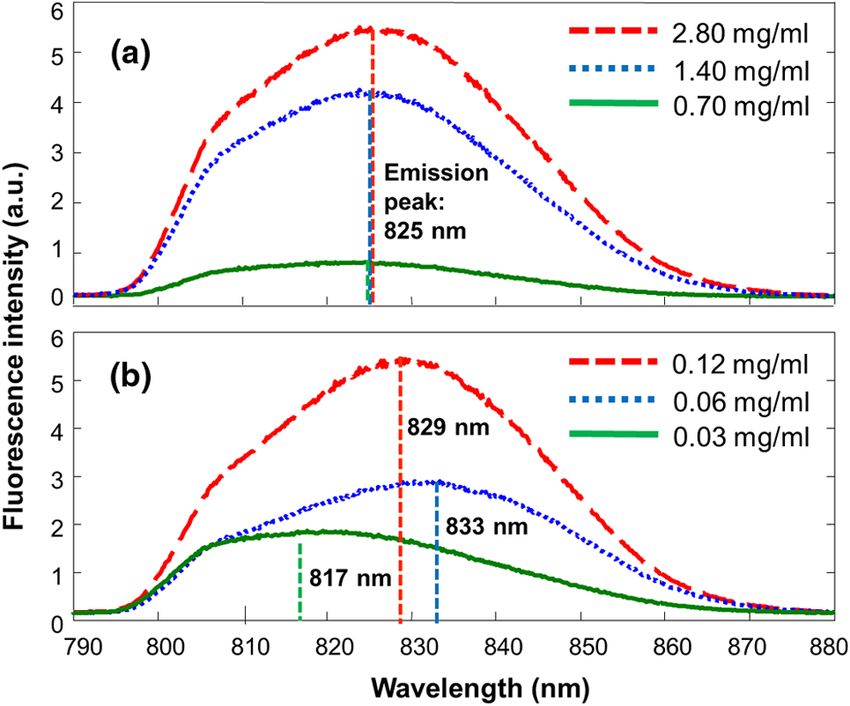
Mitra et al.: Indocyanine-green-loaded microballoons for biliary imaging . . .

                2.3     Fluorescence Imaging in a Bile Duct                                        Lake Forest, Illinois) after regional injection of a 5-ml aqueous
                        Simulating Phantom                                                         suspension of ICG-loaded microballoons (0.80 mg∕ml) into the
                                                                                                   gallbladder. The tissue was illuminated by a 785-nm diode laser
                The technical feasibility of using ICG-loaded microballoons for                    system (Laserglow Technologies, Toronto, Ontario). The
                contrast enhanced biliary fluorescence imaging was tested in a                     hyperspectral and fluorescence images were analyzed and fused
                bile duct-simulating phantom. To design the phantom structure,                     using the image segmentation algorithm described next.
                we considered the biliary anatomy that simulates the correct and                       The technical feasibility of using ICG-loaded microballoons
                the incorrect surgical scenarios.26 To determine the phantom                       to identify potential bile duct injury was demonstrated in the
                recipe, we considered the optical properties for typical biologi-                  same porcine tissue model. Surgical clips were attached at dif-
                cal tissues27 and the common materials for tissue-simulating                       ferent locations of the biliary system to simulate different sur-
                phantoms.28 Since it is hard to obtain previously published                        gical scenarios. In one scenario, cystic duct was clamped to
                data for biliary scattering and absorption characteristics, we                     simulate the correct cholecystectomy procedure. In the other
                used rough estimations based on literature and previous experi-                    scenario, common bile duct was clamped to simulate the incor-
                ences. To prepare the phantom, a solution of agar-agar powder at                   rect procedure that may result in potential bile duct injury.
                2.5% w/v was heated to 95°C and maintained above 50°C in                           In both surgical scenarios, ICG-loaded microballoons were
                order to prevent gelling. After the solution was cooled to                         injected into gall bladder. Flow of bile juice through peristalsis
                below 60°C, Intralipid was added dropwise to attain a reduced                      was simulated ex vivo by the application of gentle compression
                scattering coefficient of 5.0 cm−1 , as measured at 690 nm by an                   on gall bladder. Fluorescence images were captured at an exci-
                Oxiplex tissue spectrophotometer (ISS Inc., Urbana Champaign,                      tation wavelength of 785 nm and an emission wavelength of
                Illinois). We also fabricated three sets of the bile duct simulators               808 nm. Potential bile duct injury was identified based on
                and embedded them 7 mm deep in the agar gel phantom. The                           the flow pattern of the ICG-loaded microballoons after injection.
                first set of the bile duct simulators included the cylinders of agar
                gel mixture with the following different absorbing contrast
                agents:                                                                            2.5     Hyperspectral and Fluorescence Image
                                                                                                           Processing
                    (a) 0.5 mg∕ml Dylon Dark Green permanent fabric dye
                        (Prym-Dritz Corp, Spartanburg, SC)                                         A hyperspectral sensor collects a wide range of the spectral
                                                                                                   reflectance information at consecutive wavelengths ranging
                    (b) 0.1 mg∕ml ICG                                                              from visible to infrared bands. These additional spectral bands
                    (c) 2 mg∕ml ICG microballoons.                                                 provide detailed information compared to a color image with
                                                                                                   only red-green-blue (RGB) bands. Typically, hyperspectral
                    The second set was an assembly of agar gel cylinders simu-
                                                                                                   images are used in remote sensing to classify, for example,
                lating the surgical scenario where the cystic duct was correctly
                                                                                                   types of vegetation that otherwise look similar in the RGB
                clamped. The third set was an assembly of agar gel cylinders
                                                                                                   space.29 Hyperspectral signatures have also been used to control
                simulating the incorrect surgical scenario where the common
                                                                                                   food safety by utilizing the spectral properties of the chemi-
                bile duct was accidently clamped. In addition to the above
                                                                                                   cals.30 We have previously applied the hyperspectral imaging
                bile duct simulators, several agar gel slabs (each 3 mm thick)
                                                                                                   techniques for chronic wound assessment.31,32 In this paper,
                were cast to simulate the fat and ligament tissues surrounding
                                                                                                   we used hyperspectral imaging to segment the bile duct region
                the biliary structure. These slabs were fabricated by mixing
                                                                                                   employing spectral properties and label the organs to assist the
                Intralipid with agar gel in order to reach a reduced scattering
                                                                                                   operator.
                coefficient of 2.0 cm−1 , as measured at 690 nm by an Oxiplex
                                                                                                       In this experiment, the hyperspectral and the fluorescence
                tissue spectrophotometer (ISS Inc., Urbana Champaign, Illi-
                                                                                                   images were acquired from the ex vivo porcine tissue model.
                nois). Fluorescent and visible light images of the bile duct-simu-
                                                                                                   Different tissue types were classified based on their character-
                lating phantom were acquired by a Da Vinci surgical robot
                                                                                                   istic reflectance spectra. The acquired hyperspectral data cubes
                imaging system (Intuitive Surgical, Inc, Sunnyvale, California)
                                                                                                   consisted of 50 spectral bands sampled at a wavelength step of
                with and without the placement of the agar gel slabs on the top.
                                                                                                   2 nm from 650 to 750 nm. The bands recorded the spectral
                                                                                                   reflectance properties of liver, duodenum, gallbladder and liga-
                2.4     Dual-Mode Fluorescence and Hyperspectral                                   ment tissue. Our algorithm treated each pixel in the hyperspec-
                        Imaging of Biliary Structure in an Ex Vivo Model                           tral image as a 50-dimensional vector that encoded the spectral
                                                                                                   signature of the molecular structure within the tissues.
                The dual-mode biliary imaging technique was demonstrated in                            Considering that a biliary system consists of a matrix of mul-
                an ex vivo porcine tissue model consisting of gallbladder, cystic                  tiple tissue chromophores with characteristic absorption spectra,
                duct, common hepatic duct, common bile duct, duodenum, and                         an unmixing process was used to separate the hyperspectral sig-
                liver tissue. The tissue samples were freshly collected from                       nature into a mixture of known molecule signatures.33 In addi-
                euthanized domestic pigs at the OSU experimental animal sur-                       tion to estimating the mixture molecules, the unmixing process
                gical services. Hyperspectral images were acquired using an                        also computed the portion of each molecule for each pixel.
                ORCA ER deep cooling NIR CCD camera (Hamamatsu,                                    In hyperspectral image analysis, the portion was referred to
                Bridgewater, New Jersey) and a Varispec SNIR liquid crystal                        as the abundance, and the pure molecules were called the end-
                tunable filter (Cambridge Research and Instrumentation Inc.,                       members. Considering that we do not have the standard spectral
                Cambridge, Massachusetts), with the illumination of an OSL1                        signatures of the pure molecules, we manually chose the end-
                high-intensity halogen light source (Thorlabs, Newton, New                         members from one of the acquired hyperspectral images. The
                Jersey). Fluorescence images of the biliary structure were                         manually selected end-members are marked as candidates
                acquired by the same charge coupled device (CCD) camera                            and are chosen from liver, gallbladder, duodenum, and
                through a 808-nm EdgeBasic long pass filter (IDEX Corp.,                           connection tissue and the background regions. The candidate

                Journal of Biomedical Optics                                               116025-3                                     November 2012   •   Vol. 17(11)

Downloaded From: https://www.spiedigitallibrary.org/journals/Journal-of-Biomedical-Optics on 31 Oct 2021
Terms of Use: https://www.spiedigitallibrary.org/terms-of-use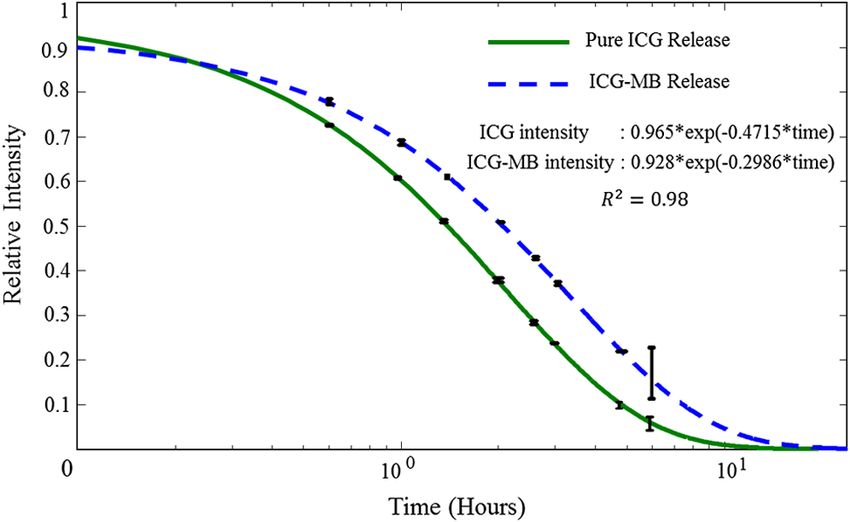
Mitra et al.: Indocyanine-green-loaded microballoons for biliary imaging . . .

                end-members are sorted into matrices that correspond to each
                region. These matrices are then subjected to principal compo-
                nent analysis (PCA), which in return provided us with three
                end-members per region that had the highest eigenvalues.
                This process in total provided us with 15 end-members, which
                are conjectured to model the spectral signatures of the regions of
                interest.
                    In our algorithm, we suggest that the signature of a pixel was
                composed of a linear combination of end-members, and abun-
                dance could not be negative. This resulted in a linear mixture
                model for a pixel, x, such that                                                    Fig. 1 SEM images of ICG-loaded microballoons with the following
                                                                                                   shell materials: (a) PLGA-PEG diblock, and (b) PLGA. ICG was encap-
                                                                                                   sulated in both microballoons by a modified double emulsion process.
                                                                      X
                                                                      M
                                                                                                   The surface of PLGA-PEG microballoons shows a unique mushroom-
                     x ¼ a1 s1 þ a2 s2 þ · · · þaM sM þ w ¼                  ai si þ w;            like nanostructure, possibly owing to the interaction of the hydrophilic
                                                                       i¼1                         PEG segments and the hydrophobic PLGA segments in aqueous phase
                                                                                                   during the emulsification process.
                where si is the signature of the ith end-member, ai is its abun-
                dance, M is the number of known end-members in our library,
                                                                                                   3       Results
                and w is the model noise. The pixel observations, p pixels, when
                formed into an N × p matrix X ¼ ½ x1 x2 : : : xN T ,                              ICG-loaded microballoons were fabricated by a modified dou-
                resulted in the mixture model                                                      ble emulsification process using both PLGA-PEG and PLGA as
                                                                                                   shell materials. The mean diameter of these microballoons was
                                                                                                   1.34 microns with a standard deviation of 0.94 microns, as mea-
                                             X ¼ AS þ W;
                                                                                                   sured by a dynamic light scattering (DLS) system. Figure 1
                                                                                                   compares the morphology of these two types of microballoons.
                where A ¼ ½ a1 a2 : : : aN T is the N × M abundance                               Unlike conventional PLGA microballoons, which are shown
                matrix, and S ¼ ½ s1 s2 : : : sM T is an M × p matrix of                          in Fig. 1(b), PLGA-PEG microballoons, which are shown in
                end-members. Given the pixel signatures and the library signa-                     Fig. 1(a), show a completely innovative surface structure.
                tures of the end-members, the abundance matrix A was esti-                         The formation of such a unique surface feature may be asso-
                mated using nonnegative least square adjustment.                                   ciated with the interaction of the hydrophilic PEG segments
                    Using the above unmixing equations, the unmixing proce-                        and the hydrophobic PLGA segments in aqueous phase during
                dure provides a novel M-dimensional descriptor for each                            the emulsification process.34
                pixel in the form of mixing parameters, and it reduces the                            Figure 2 plots the ICG loading rates for different ICG
                bias in the original spectrum by eliminating the redundancy                        amounts used in the emulsification process. According to the
                in the hyperspectral observations. The reduced bias increases                      figure, the ICG loading rate is proportional to the initial amount
                the efficiency of the image segmentation process, due to the                       of ICG used in the process. Compared with the previous
                use of better semantic descriptors for each pixel. We have                         report,35 our loading rate is four times higher and can be further
                also observed the importance of the unmixing process when per-                     increased by optimizing the encapsulation process. The
                forming the image segmentation using conventional segmenta-                        increased loading rate is possibly caused by switching the orders
                tion algorithms. When directly applied to the original sensor                      of washing and freeze drying in the double emulsification pro-
                observations with the N-bands, conventional segmentation                           cess and by forming the mushroom-like nanostructure on the
                methods could not delineate the biliary anatomy. In our imple-                     surface of the microballoons for improved attachment of ICG.
                mentation, we chose the unmixed descriptors for K-means clus-
                tering. Using the end-member library extracted as mentioned
                before, we set the number of clusters, k, to 10 to model biliary
                anatomy and the variations in the background for the collected
                images. The segmentation results with 10 regions were further
                re-clustered into four segments of duodenum, ligament tissue,
                liver, and gallbladder.
                    The segmented images were later superimposed with fluor-
                escence biliary imaging to visualize the biliary anatomy and the
                surrounding tissue components. Before generating the superim-
                position, we processed the fluorescence image to enhance the
                observation. The raw fluorescence image showed that the his-
                togram of the image was concentrated on the dark part of the
                spectrum. In order to improve the appearance, we rescaled the
                histograms whose values encompass the full spectrum. The new                       Fig. 2 The loading rate of the ICG-loaded microballoons is linearly cor-
                image was then used as an alpha map to introduce transparent                       related with the initial ICG quantity in the modified double emulsion
                                                                                                   process. The loading rate is four times higher than that of our previous
                visualization for fluorescent regions. Fluorescence imaging of
                                                                                                   report (See Ref. 35) and can be further increased by optimizing the
                the biliary anatomy was also superimposed with the grayscale                       encapsulation process. The increased loading rate is possibly caused
                background image to facilitate real-time image guidance in                         by the improvement of the encapsulation process and the formation
                cholecystectomy.                                                                   of the nanostructures on the microballoon surface.

                Journal of Biomedical Optics                                               116025-4                                        November 2012     •   Vol. 17(11)

Downloaded From: https://www.spiedigitallibrary.org/journals/Journal-of-Biomedical-Optics on 31 Oct 2021
Terms of Use: https://www.spiedigitallibrary.org/terms-of-use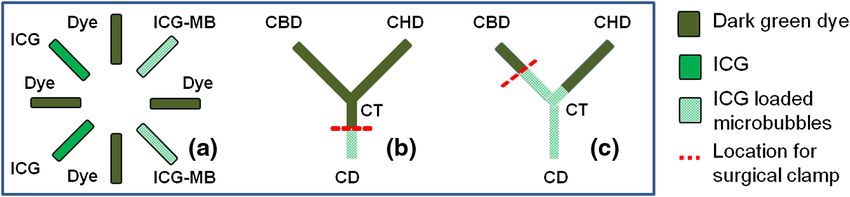
Mitra et al.: Indocyanine-green-loaded microballoons for biliary imaging . . .
Fig. 4 Fluorescence intensity histories of the aqueous solution of pure
ICG (red) and the aqueous suspension of ICG-loaded microballoons
(green) in a dimly lit, physiological environment. The averaged fluores-
cence intensities measured at different time points were fitted into an
exponential extinction model. ICG-loaded microballoons retain signif-
Fig. 3 Fluorescence spectra of ICG loaded microballoons (a) and pure icantly higher fluorescence in surgically relevant time spans, with
ICG (b) in a lecithin matrix at different concentrations. Initial samples nearly double the intensity of pure ICG between 4 and 7 h. Based
(red lines) were measured to produce equivalent fluorescence intensi- on the fitted model, the half-life for the aqueous solution of ICG is
ties. Clear peak shift is observed with the varying dilutions (blue and 1.47 h, whereas the half-life for the aqueous suspension of ICG-loaded
green lines) in the case of pure ICG, despite similar starting fluorescence microballoons is 2.321 h.
intensity. In comparison, the emission peak of ICG-loaded microbal-
loons is constant at 825 nm.
at a maximum of 1.0 at 0 h to a minimum of 0.0 at 30 h. The data
were fitted into the exponential extinction model
Figure 3 compares the fluorescence emission spectra of
ICG-loaded microballoons versus ICG in the bile-simulating IðtÞ ¼ I 0 e−kt ;
liquid at different concentrations. The initial concentrations
were adjusted in order to achieve similar fluorescence intensities with the half-life defined as t1∕2 ¼ 0.693∕k, where I 0 is the
for the two ICG formulations. According to Fig. 3(a), the sus- initial fluorescence intensity, IðtÞ is the fluorescence intensity
pension of ICG-loaded microballoons shows a consistent fluor- at time t, and k is an attenuation constant.
escence peak at 825 nm, independent of the changes in According to Fig. 4, the half-life for the aqueous solution of
concentration. In comparison, the fluorescence peak of the ICG ICG is 1.47 h, whereas the half-life for the aqueous suspension
solution is shifted by 16 nm at different concentrations. Such a of ICG-loaded microballoons is 2.321 h. This indicates a nearly
wavelength shift does not show a predictable pattern. It may be 58% increase in half-life by encapsulating ICG inside microbal-
caused by the aggregation of ICG and the molecular interaction loons. Furthermore, according to Fig. 4, the fluorescence inten-
with lecithin. An interesting observation was that the effect of sity of ICG-loaded microballoons remains significantly higher
peak shift seemed directly related to the magnitude of change in than that of ICG solution—as much as double during most of the
concentration. The lowest peak displays the greatest shift from surgically crucial times. Without encapsulation, pure ICG suf-
the highest peak compared to the intermediate peak. This can be fers from the unhindered effects of quenching, photo bleaching,
reasoned as, at high concentrations, ICG will tend to dimerize, and aggregation over time. However, ICG-loaded microballoons
reducing its interaction with proteins.36 Studies also indicate that have relative amounts of protection from the surrounding matrix
a combination of the effects of ICG binding to protein and ICG and external optically degrading factors, as evidenced by the
aggregation is largely responsible for the spectral change in elongated half-life time in Fig. 4.
emission.18 During operative use, both these effects compete Figure 5 illustrates multiple bile duct simulators embedded in
against each other, impacting the ICG characteristics. However, an agar gel phantom. In Fig. 5(a), bile duct simulators dispersed
ICG encapsulated within microballoons is restricted from pro- with different types of contrast agents are aligned. Figure 5(b)
tein binding and aggregation. These microballoons maintain and 5(c) simulates the correct surgical scenario where the
their spectral characteristics and demonstrate almost no ability cystic duct is clamped and the incorrect the incorrect surgical
to shift their peak with changing concentration. These results scenario where the common bile duct is accidentally clamped,
open up the possibility of drawing quantitative correlations respectively.
between ICG fluorescence and physiological properties, inde- Fluorescence images of the above bile duct-simulating phan-
pendent of the nuances and instability of the fluorophore’s tom were acquired by a Firefly™ fluorescence imaging module
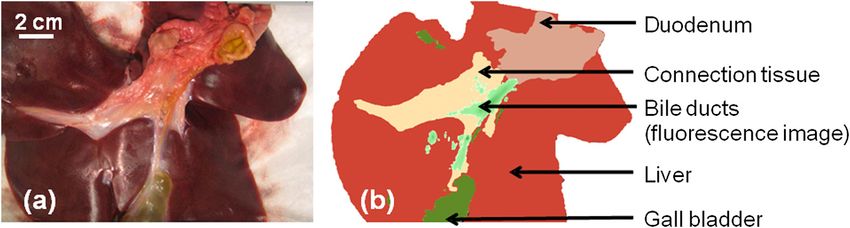
chemistry. in a Da Vinci surgical robot system. Figure 6 shows the screen
The effect of time on the extinction of fluorescence intensity snapshots of the fluorescence imaging module. The snapshots
was tested at the physiologic temperature and pH levels for aqu- represent the image fusion of the fluorescence emission
eous solutions of ICG and ICG-MBs, respectively. The test was (green color, illuminated by an excitation light) and the back-
triplicated, and the averaged fluorescence intensities were ground reflectance (grayscale, illuminated by a broadband
recorded from 0 to 30 h, as shown in Fig. 4. To ensure the com- light). The diminishing fluorescence intensity from Fig. 6(a)
parability of the results, the extinction was measured relative to to 6(c) is a result of adding multiple agar gel slabs on top of
the starting fluorescence intensities of the two samples, starting the phantom. According to the left image in Fig. 6(a), both
Journal of Biomedical Optics 116025-5 November 2012 • Vol. 17(11)
Downloaded From: https://www.spiedigitallibrary.org/journals/Journal-of-Biomedical-Optics on 31 Oct 2021
Terms of Use: https://www.spiedigitallibrary.org/terms-of-useMitra et al.: Indocyanine-green-loaded microballoons for biliary imaging . . .
Fig. 5 Multiple bile duct simulators are embedded in an agar gel phantom. (a) Bile duct simulators are made of agar gel cylinders dispersed with three
different contrast agents. “Dye”: the Dylon dark green fabric dye. “ICG”: the ICG solution. “ICG-MBs”: the mixture of ICG and microballoons.
(b) Embedded agar gel cylinders simulating the correct surgical scenario. “CBD”: common bile duct. “CHD”: common hepatic duct. “CD”: cystic
duct. “CT”: carlot’s triangle. (c) Embedded agar gel cylinders simulating the incorrect surgical scenario where the common bile duct is accidently
clamped.
embedment. We believe that such a big difference in the fluor-
escence pattern is associated with the scattering of fluorescence
photons in the phantom. Since the bile duct simulators do not
contain Intralipid, their scattering coefficients are much lower
than that of the surrounding phantom material. For the “ICG”
simulators, the fluorescence photons will not be scattered until
they reach the highly scattered boundary, resulting in a pattern of
fluorescence emission outside the embedment. In contrast, the
fluorescence photons emitted in the “ICG-MB” simulators will
be directly scattered by individual microballoons, resulting in a
pattern of uniformly distributed fluorescence within the embed-
ment. This phenomenon implies that ICG-MBs can replace ICG
for fluorescence imaging of low scattering tumors, such as
a cyst.
The middle and right images in Fig. 6(a) demonstrate that the
simulated correct and incorrect surgical scenarios can be clearly
identified by fluorescence imaging. Figure 6(b) shows that the
simulated biliary structure can be identified by fluorescence
Fig. 6 A screen snapshot of the fluorescence images of the bile duct- imaging even when an agar gel slab is placed on the top of
simulating phantom acquired by a Firefly fluorescence imaging module the phantom, simulating a tissue depth of 3 to 10 mm. As
in a Da Vinci surgical robot under the following test conditions: (a) bile the second piece of agar gel slab is placed on the top of the phan-
duct simulators are embedded 7 mm deep inside an agar gel phantom;
tom, the biliary structure is hard to identify by fluorescence
(b) a 3-mm-thick agar gel slab is placed on top of the phantom; (c) two
3-mm-thick agar gel slabs are placed on top of the phantom. Note that imaging.
the scattering coefficient of the agar gel slabs is greater than that of the Figure 7 shows the photographic and segmented images of
bile duct-simulating phantom to mimic fat and ligament tissues the ex vivo biliary tissue after the hyperspectral and fluorescence
surrounding the bile ducts. imaging sessions. Hyperspectral image analysis was performed
using a modified spectrum parsing and image reconstruction
algorithm. As can be seen, different tissue types exhibited
the bile duct simulators dispersed with ICG-loaded microbal- different spectral characteristics, due to tissue properties.
loons, denoted as “ICG-MB” in Fig. 5(a) and the simulators Therefore, a segmentation of the whole porcine sample being
filled with ICG, denoted as “ICG” in Fig. 5(a), show fluores- imaged was possible based on tissue characteristics. The
cence emission. However, their fluorescence patterns are signif- color-coded segments allow clear distinction between ligament
icantly different. For the “ICG-MB” simulators, fluorescence tissue, gallbladder, liver, and duodenum. This segmented image
emission is observed within the embedment. For the “ICG” is overlaid with a fluorescence image from the microballoon
simulators, fluorescence emission is observed outside the flow in the same tissue to add the real-time fluorescence
boundary, leaving a region of no fluorescence within the flow of ICG-loaded microballoons on top of the background.
Fig. 7 (a) Photographic image of the biliary tissue structure. (b) Classification of the biliary tissue types based on hyperspectral imaging, superimposed
with the fluorescence image of the ICG-loaded microballoons. The dual-mode image clearly identifies the biliary anatomy and its relative location with
respect to the surrounding tissue components.
Journal of Biomedical Optics 116025-6 November 2012 • Vol. 17(11)
Downloaded From: https://www.spiedigitallibrary.org/journals/Journal-of-Biomedical-Optics on 31 Oct 2021
Terms of Use: https://www.spiedigitallibrary.org/terms-of-useMitra et al.: Indocyanine-green-loaded microballoons for biliary imaging . . .
The dual-mode bile duct imaging technique has been demon-
strated in both an agar gel phantom and an ex vivo porcine tissue
model. Bolus injection of microballoons encapsulating highly
absorbing contrast agents will also facilitate bile duct imaging
using other modalities, such as ultrasonography25 and photoa-
coustic tomography.40 Hyperspectral imaging can facilitate
situational awareness of the real-time information from the con-
trast media with respect to the surrounding anatomy. It will
undercut errors from contrast agent contamination and provide
Fig. 8 Ex vivo fluorescence images simulating the detection of different
surgical scenarios: (a) the correct scenario, where the cystic duct is
clarification on the tissue type being fluoresced, which will be
clamped; (b) an incorrrect scenario where the common bile duct is vital information in cases of robotic surgery. In addition to
accidently clamped. GB: gall bladder. CBD: common bile duct. CHD: cholecystectomy, the dual-mode imaging technique can provide
common hepatic duct. CD: cystic duct. Arrows indicate the clamping intraoperative guidance in many other surgical procedures,
locations. such as urinary tract imaging to reduce the incidence of
ureteral injuries in gynecologic and colorectal surgeries as men-
Figure 8 shows the fluorescence images of two surgical sce- tioned above.
narios after regional injection of the ICG-loaded microballoons. In conclusion, the hyperspectral and fluorescence dual-mode
The flow of bile juice results in characteristic distributions of imaging technique has the capability to identify potential bile
microballoons based on the position of the surgical clamp. duct injury in cholecystectomy. Future research will include
Figure 8(a) highlights the correct surgical scenario, where the in vivo animal studies, investigation into a microballoon or
cystic duct is clamped. Figure 8(b) shows a “Y” shaped fluor- microballoon technique that combines the strength of both
escence pattern, indicating the accidental occlusion of the our current techniques, and expansion into imaging for other
common bile duct and the retrospect flow of ICG-loaded micro- surgical procedures, including those involving the ureters and
balloons to the common hepatic duct. the circulatory system, as the microballoons show potential
in preventing ICG from interacting with blood albumins.
4 Discussions and Conclusion
A dual-mode imaging technique has been developed for intrao- Acknowledgments
perative bile duct imaging and bile duct injury identification in
cholecystectomy. ICG was encapsulated into microballoons This work was supported by the Center for Minimally Invasive
using a modified double emulsion technique. Compared to Surgery (CMIS) at The Ohio State University (OSU), the
the emulsion-based encapsulation systems,21,35 we demonstrated National Center for Research Resources (Grant
a fourfold increase in the loading rate. Compared to lipid micro- No: UL1RR025755), the National Institute of Standards and
bubbles, PLGA microballoons provide a solid and stable core- Technology (Grant No: 60NANB10D184), and the National
shell structure that is capable of loading multiple drugs and ima- Cancer Institute (Grant No: CA15977). The authors are grateful
ging agents.37 The microballoon agent is especially useful for to Valerie Bergdall, Lori Mattox, and staff members at OSU
image-guided cholecystectomy application, because it will be University Laboratory Animal Resources (ULAR) for their
eventually discharged to the gastrointestinal tract, leaving no assistance in ex vivo validation tests. The authors are also grate-
significant side effect to the patient. Of course, microballoons ful to Dr. Mark Wendling, James Vargo, Lisa Yeater, and
fabricated by emulsification processes have broad size distribu- Rebecca Dettorre at CMIS for their helpful insights and experi-
tion that limits their imaging applications. Other processes, such mental supports.
as co-axial electrospray, have been explored for the improved
loading rate and particle size distribution.38 Once the inhomo-
References
geneity of the particle size is brought down, fluorescent micro-
balloons might provide quantitative information, as well as 1. S. J. Savader et al., “Laparoscopic cholecystectomy-related bile duct
qualitative information, in fluorescence imaging. injuries: a health and financial disaster,” Ann. Surg. 225(3), 268–273
(1997).
The dual-mode imaging technique consists of successive
2. D. R. Flum et al., “Bile duct injury during cholecystectomy and survival
steps of clamping the presumed cystic duct, injecting ICG- in medicare beneficiaries,” JAMA 290(16), 2168–2173 (2003).
loaded microballoons into the gallbladder, and fluorescence 3. D. Boerma et al., “Impaired quality of life 5 years after bile duct injury
and hyperspectral imaging to confirm the surgeon’s identifica- during laparoscopic cholecystectomy: a prospective analysis,” Ann.
tion. Compared with IOC, this dual-mode imaging technique Surg. 234(6), 750–757 (2001).
has the advantage of being a low-cost, real-time technique 4. G. B. Melton et al., “Major bile duct injuries associated with laparo-
without any radiation hazard. It does not require a previous scopic cholecystectomy: effect of surgical repair on quality of life,”
Ann. Surg. 235(6), 888–895 (2002).
intravenous injection, as in fluoroscopy, and it has the potential 5. N. N. Massarweh and D. R. Flum, “Role of intraoperative cholangio-
to be used in other regions, such as the ureter. Compared with graphy in avoiding bile duct injury,” J. Am. Coll. Surg. 204(4), 656–664
ultrasonography, this imaging technique combines the molecu- (2007).
lar sensitivity of fluorescence imaging and the tissue classifica- 6. S. B. Archer et al., “Bile duct injury during laparoscopic cholecystect-
tion capability of hyperspectral imaging. Compared with pure omy: results of a national survey,” Ann. Surg. 234(4), 549–558
ICG injections, this method allows for fluorescence imaging (2001).
7. J. R. Francoeur et al., “Surgeons’ anonymous response after bile duct
with consistent emission wavelength and up to 2 to 3 h’ working injury during cholecystectomy,” Am. J. Surg. 185(5), 468–475 (2003).
time after administration. ICG-loaded microballoons will also 8. J. F. Gigot, “Bile duct injury during laparoscopic cholecystectomy: risk
enable simultaneous ultrasound, photoacoustic, and fluores- factors, mechanisms, type, severity and immediate detection,” Acta.
cence imaging.39,40 Chir. Belg. 103(2), 154–160 (2003).
Journal of Biomedical Optics 116025-7 November 2012 • Vol. 17(11)
Downloaded From: https://www.spiedigitallibrary.org/journals/Journal-of-Biomedical-Optics on 31 Oct 2021
Terms of Use: https://www.spiedigitallibrary.org/terms-of-useMitra et al.: Indocyanine-green-loaded microballoons for biliary imaging . . .
9. L. W. Way et al., “Causes and prevention of laparoscopic bile duct inju- 24. C. E. Astete and C. M. Sabliov, “Synthesis and characterization of
ries: analysis of 252 cases from a human factors and cognitive psychol- PLGA nanoparticles,” J. Biomater. Sci. Polym. Ed. 17(3), 247–289
ogy perspective,” Ann. Surg. 237(4), 460–469 (2003). (2006).
10. M. Birth et al., “Recognition of laparoscopic bile duct injuries by intrao- 25. R. X. Xu et al., “Fabrication of indocyanine green encapsulated biode-
perative ultrasonography,” Surg. Endosc. 10(8), 794–797 (1996). gradable microbubbles for structural and functional imaging of cancer,”
11. M. A. Wahab et al., “Postcholecystectomy bile duct injuries: experience J. Biomed. Opt. 14(3), 034020 (2009).
with 49 cases managed by different therapeutic modalities,” Hepatogas- 26. S. Connor and O. J. Garden, “Bile duct injury in the era of laparoscopic
troenterology 43(11), 1141–1147 (1996). cholecystectomy,” Br. J. Surg. 93(2), 158–168 (2006).
12. M. Hauer-Jensen et al., “Prospective randomized study of routine 27. W. F. Cheong, S. A. Prahl, and A. J. Welch, “A review of the optical
intraoperative cholangiography during open cholecystectomy: long- properties of biological tissues,” IEEE J. Quantum Electron., 26,
term follow-up and multivariate analysis of predictors of choledocho- 2166–2185 (1990).
lithiasis,” Surgery 113(3), 318–323 (1993). 28. B. W. Pogue and M. S. Patterson, “Review of tissue simulating phan-
13. L. T. Ladocsi et al., “Intraoperative cholangiography in laparoscopic toms for optical spectroscopy, imaging and dosimetry,” J. Biomed. Opt.
cholecystectomy: a review of 734 consecutive cases,” Am. Surg. 11(4), 041102 (2006).
63(2), 150–156 (1997). 29. J. R. Jensen, Remote Sensing of the Environment: An Earth Resource
14. T. Ishizawa et al., “Application of fluorescent cholangiography to sin- Perspective, 2nd ed., Prentice Hall, Upper Saddle River, NJ (2006).
gle-incision laparoscopic cholecystectomy,” Surg Endosc. (2011). 30. M. S. Kim, Y. R. Chen, and P. M. Mehl, “Hyperspectral reflectance and
15. T. Aoki et al., “Intraoperative fluorescent imaging using indocyanine fluorescence imaging system for food quality,” Trans. ASAE 44,
green for liver mapping and cholangiography,” J. Hepatobiliary Pan- 721–729 (2001).
creat. Sci. 17(5), 590–594 (2010). 31. R. X. Xu et al., “Developing digital tissue phantoms for hyperspectral
16. J. L. Figueiredo et al., “Intraoperative near-infrared fluorescent cholan- imaging of ischemic wounds,” Biomed. Opt. Express 3(6), 1434–1445
giography (NIRFC) in mouse models of bile duct injury,” World J. Surg. (2012).
34(2), 336–343 (2010). 32. R. X. Xu et al., “Dual-mode imaging of cutaneous tissue oxygenation
17. A. Matsui et al., “Real-time, near-infrared, fluorescence-guided identi- and vascular thermal reactivity,” J. Visual. Exp. (2010).
fication of the ureters using methylene blue,” Surgery 148(1), 78–86 33. N. Keshava, “A survey of spectral unmixing algorithms,” Lincoln Lab.
(2010). J. 14(1), 55–78 (2003).
18. T. Desmettre, J. M. Devoisselle, and S. Mordon, “Fluorescence proper- 34. H. K. Makadia and S. J. Siegel, “Poly lactic-co-glycolic acid (PLGA) as
ties and metabolic features of indocyanine green (ICG) as related to biodegradable controlled drug delivery carrier,” Polymers (Basel) 3(3),
angiography,” Surv. Ophthalmol. 45(1), 15–27 (2000). 1377–1397 (2011).
19. V. Saxena, M. Sadoqi, and J. Shao, “Polymeric nanoparticulate delivery 35. V. Saxena, M. Sadoqi, and J. Shao, “Indocyanine green-loaded biode-
system for Indocyanine green: biodistribution in healthy mice,” Int. J. gradable nanoparticles: preparation, physicochemical characterization
Pharm. 308(1–2), 200–204 (2006). and in vitro release,” Int. J. Pharm. 278(2), 293–301 (2004).
20. V. Saxena, M. Sadoqi, and J. Shao, “Enhanced photo-stability, thermal- 36. L. Guerrini et al., “Monomer adsorption of indocyanine green to gold
stability and aqueous-stability of indocyanine green in polymeric nanoparticles,” Nanoscale 3(10), 4247–4253 (2011).
nanoparticulate systems,” J. Photochem. Photobiol. B 74(1), 29–38 37. J. R. Lindner, “Microbubbles in medical imaging: current applications
(2004). and future directions,” Nat. Rev. Drug Discov. 3(6), 527–532 (2004).
21. R. Xu et al., “Fabrication of indocyanine green encapsulated biodegrad- 38. L. Zhang et al., “Co-axial electrospray of microparticles and nanopar-
able microbubbles for structural and functional imaging of cancer,” ticles for biomedical applications,” Exp. Rev. Med.l Dev., in press
J. Biomed. Opt. 14(3), 034020 (2009). (2012).
22. K. A. Kern, “Malpractice litigation involving laparoscopic cholecystect- 39. J. S. Xu et al., “Synthesizing and binding dual-mode poly (lactic-co-
omy. Cost, cause, and consequences,” Arch. Surg. 132(4), 392–397, glycolic acid) (PLGA) nanobubbles for cancer targeting and imaging,”
discussion 397–398 (1997). Biomaterials 31(7), 1716–1722 (2010).
23. R. X. Xu, “Multifunctional microbubbles and nanobubbles for 40. C. Kim et al., “Ultrasound and photoacoustic dual-modal imaging of
photoacoustic imaging,” Contrast Media Mol. Imaging 6(5), thick biological tissue with microbubble enhancement,” J. Biomed.
401–411 (2011). Opt. 15(1), 010510 (2010).
Journal of Biomedical Optics 116025-8 November 2012 • Vol. 17(11)
Downloaded From: https://www.spiedigitallibrary.org/journals/Journal-of-Biomedical-Optics on 31 Oct 2021
Terms of Use: https://www.spiedigitallibrary.org/terms-of-useYou can also read