Influence of Deforestation in Borgu Local Government Area of Niger State, Nigeria
←
→
Page content transcription
If your browser does not render page correctly, please read the page content below
Available online at www.worldnewsnaturalsciences.com

WNOFNS 18(2) (2018) 62-71                                                         EISSN 2543-5426

           Influence of Deforestation in Borgu Local
            Government Area of Niger State, Nigeria

                  B. S. Ojo, S. A. Alaye, A. Buochuama* and A. Martins
           Federal College of Wildlife Management, Forestry Research Institute of Nigeria,
                                    PMB 268, New Bussa, Nigeria
                       *E-mail address: alexanderbuochuama@yahoo.com

ABSTRACT
       There are ample facts that the whole world is facing an ecological crisis by reason of heavy
deforestation. Thus, this study assesses the influence of deforestation in some selected villages in
Borgu Local Government Area, Niger State. Data were collected from members of the community
using a set of structured questionnaire. Data were analyzed using descriptive statistics such as
percentages and frequency count. Findings revealed that the major occupation is trading (33.3%),
followed by farming (30%). The causes of deforestation in the study area includes the following;
fuelwood removal (31.7%), urbanization (25.0), logging (20.0%), subsistence farming (15.8%),
population growth and overpopulation (3.3%), commercial farming (2.5%) and Inequitable
distribution of wealth and power (1.7%). Global warming (31.7%) was the major effect of
deforestation in the study area, followed by soil erosion (24.2%). Encouragement of agroforestry
practices (30.8%) was seen as the major strategy for reducing deforestation by the respondents, others
includes; afforestation (27.5%), public enlightenment (13.3%), enforcement of forest land and policy
(12.5%), forest education (8.3%), forest conservation and preservation (7.5%).

Keywords: deforestation, ecological crisis, forest, influence

         ( Received 04 March 2018; Accepted 19 March 2018; Date of Publication 20 March 2018)
World News of Natural Sciences 18(2) (2018) 62-71
1. INTRODUCTION
Tropical forest covers 814 million ha, of which 110 million ha is located in Africa, 168
million ha in Asia and the pacific, and 536 million ha in Latin America. However, only 25
million ha are exploited in a sustainable way and 11 million ha of tropical forests are
conserved with an effective political protection (FAO, 2000). It is believed that almost all the
tropical forests in Nigeria have suffered from enormous deforestation. Loss of biodiversity of
tropical forests is mainly caused by anthropogenic activities. Currently, it is a global problem
(Sukumaran and Jeeva, 2008) because the annual rate of global deforestation is about 13
million hectares, most of which occurs in developing world. Forest loss in Africa is
particularly troubling, however, two-thirds of the continent's population depends on forest
resources for income and food and 90% of Africans use fuel wood and charcoal as sources of
energy. Despite this dependence on forest resources and non- timber forest products,
deforestation in Africa is estimated at about 3.4 million hectares/year (FAO, 2010; Boyowa,
1993; Aweto, 1990; Chokor, 1989; Conable, 1989; Omuta, 1985; Walker, 1985).
The absence of appropriate forest management and utilization, land tenure policy and
lack of compatible forest legislations could result to deforestation. However, Population
growth and the associated expansion of agricultural lands is the primary cause of present day
deforestation (Gibbs et al., 2010; Foley et al., 2011). Although rates of deforestation have
decreased over the last decade, the loss of forested areas is expected to continue during the
present century (FAO, 2010). Forested area in the Amazon Basin, where the largest rainforest
on Earth is found, could be reduced in approximately 50% by 2050. (FAO, 2010) .While most
deforestation occurs in the tropics, non-tropical forests are likely to suffer new deforestation
pressures as the climate warms and areas which were previously too cold become suitable for
agriculture (McCarthy, 2001; Salihu, 2016; Okwodu, 2016; Yunusa, 2016; Adedeji, 2017;
Etuk, 2018).
There are ample facts that the whole world is facing an ecological crisis on account of
heavy deforestation. Aiyeloja and Chima (2011) reported that inappropriate forest use and
management practices, pollution and climate change as well as undocumented and
uncontrolled movement of germ plasms have been identified as additional threats to forest
resources. However, this work deals with the causes, effects and strategies of reducing
deforestation.
2. MATERIALS AND METHODS
2. 1. Study Location
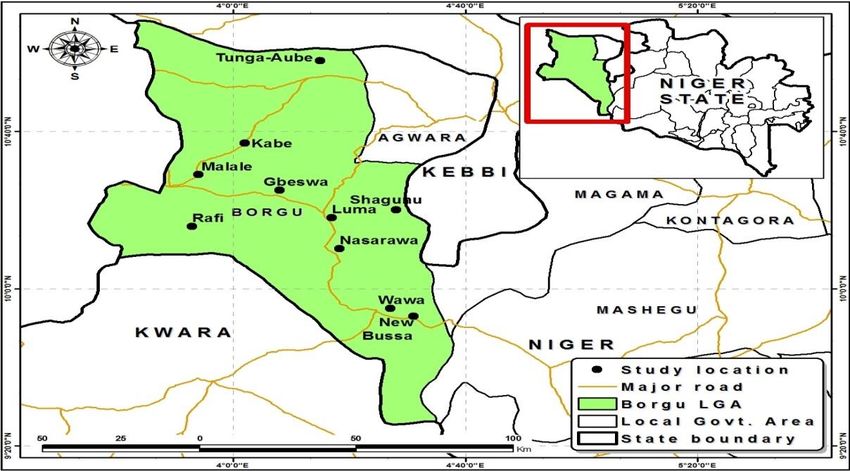
Borgu Local Government Area is located in Niger state, Nigeria. It is situated on
latitude 9°53'N and longitude 4°31'E, covering a land mass of about 16,200 km2. It has a
tropical continental climate characterized by a shorter wet season (May to September) and a
longer dry season (October to April) with a temperature of 15 °C to nearly 40 °C (Adeniji et
al. 2015).
Figure 1 shows the map of Borgu Local Government Area indicating the study area.
-63-World News of Natural Sciences 18(2) (2018) 62-71
Figure 1. Map showing Borgu Local Government Area of Niger state
2. 2. Method of Data Collection
A well structured questionnaire was used to collect data from one hundred and twenty
(120) respondents in the study area. The questionnaire was developed with the objective of
obtaining meaningful information and views from rural household members living within the
study area.
2. 3. Sampling Techniques
Five villages in Wawa community (Babarasa, Malale, Garafini, Wooko and Leshigbe)
were selected from Borgu Local Government Area of Niger State. Proportional allocation was
used in selecting the number of respondents in each village. Data collected were analyzed
using descriptive statistics in the form of frequency tables and percentages.
-64-World News of Natural Sciences 18(2) (2018) 62-71
3. RESULTS AND DISCUSSION
3. 1. Personal Characteristics of the Respondents
Table 1 shows the personal characteristics of the respondents. It can be observed that
12.5% of the respondents were between ages 15-20 years, majority of the respondents
(36.7%) were between ages 21-25 years, while the least (9.2%) were between ages 36-40
years. 55% of the respondents were single, 44.2% were married, while only 1% were
divorced.
The table also revealed that 42.5% of the respondents had tertiary education, 10.8% had
secondary education, 26.7% had primarily education, while only 20% had no formal
education. The adjusted family size result shows that, the family size of 1-10 persons
recorded the highest (67.5%). This is an indication that the family size is within a manageable
limit for an African community. Those between 11-20 persons were 17.5%, while those
between 21-30 and 31-40 persons had the least (11.7%) respectively.
The major occupation was trading (33.3%). This conforms to the fact that most rural
dwellers depend on the sale of charcoal and firewood as a means of livelihood. From the
result, it is possible to say that forest resources are one of the main income and livelihood
sources to the local community in the area (Culas, 2006). Farming was second (30%). This
shows the importance of farming to rural dwellers. Annually, large hectares of forest land are
cleared for agricultural purposes in the rural communities. 14.2 % were civil servants, 9.2 %
were artisans and students respectively, while only 4.2% were hunters.
Table 1. Personal Characteristics of the Respondents
Variables Frequency (n = 120) Percentage (%)
Age Group
15-20 15 12.5
21-25 44 36.7
26-30 19 15.8
31-35 16 13.3
36-40 11 9.2
≥41 15 12.5
Marital Status
Single 66 55.0
Married 53 44.2
Divorced 1 0.8
-65-World News of Natural Sciences 18(2) (2018) 62-71
Qualification
No formal 24 20.0
Primary 32 26.7
Secondary 13 10.8
Tertiary 51 42.5
Adjusted Family Size
1-10 81 67.5
11-20 21 17.5
21-30 14 11.7
31-40 14 11.7
Occupation
Farming 36 30.0
Trading 40 33.3
Hunting 5 4.2
Artisan 11 9.2
Civil servant 17 14.2
Student 11 9.2
Source: Field Survey, 2017.
3. 2. Causes of Deforestation in the Study Area
Table 2 reveals the causes of deforestation in the study area. Logging had 20%, while
fuelwood removal had the highest (31.7%). This can be due to the fact that most of the
household rely on fuel wood as a source of heat energy. This conforms to the finding of Ali et
al. (2006) who observed that in northern areas of Pakistan, the forest wood is intensively
using for the construction of new and repair of existing houses a s was informed by 73% of
the respondents.
Urbanization had 25.0%. The relationship between urban development and
deforestation is complex and dynamic (Sands, 2005). The influence of urbanization on forest
land area cannot be overemphasized. Forest is usually cleared to make way for road
construction and urban settlement. Also, during construction, most trees are felled for use as
structural materials without replacing them in the forest. Also, expanding cities and towns
require land to establish the infrastructures necessary to support growing population which is
done by clearing the forests (Sands, 2005).
-66-World News of Natural Sciences 18(2) (2018) 62-71
Population growth and overpopulation had 3.3%. As population size increases, the
pressures on forest land also increases. This agrees with the findings of FAO (2005) who
started that poverty and overpopulation are believed to be the main causes of forest loss. More
people need more food and space which requires additional land for agriculture and
habitation. This in turn results in more clearing of forests.
Subsistence farming had 15.8%. Households close to the forest keep on encroaching
upon forest land for the cultivation of crops and rearing of animals for family consumption.
This is in line with Gillet et al. (2016) who noted that the forest communal territory is
subjected to degradation through increased agricultural activities. Commercial farming had
2.5%. Large-scale farming has resulted to the loss of thousands of hectares of forest land. A
large expanse of land is usually cleared to give way for monocropping. This has resulted to
large scale deforestation in urban societies.
Inequitable distribution of wealth and power had 1.7%. Because wealth is unequally
distributed in our society, the less privilege looks for an alternative source of income. The
forest is usually seen as the first alternative that comes to mind for exploitation. The rural
poor exploit these forest resources indiscriminately to meet their needs.
Table 2. Causes of Deforestation
Factors/ Practices Frequency(n = 120) Percentage (%)
Logging 24 20.0
Fuel wood removal 38 31.7
Urbanization 30 25.0
Population growth and over population 4 3.3
Subsistence farming 19 15.8
Commercial farming 3 2.5
Inequitable distribution of wealth and power 2 1.7
Source: Field Survey, 2017.
3. 3. Effects of Deforestation in the Study Area
Table 3 shows the effects of deforestation in the study area. It was revealed that global
warming had the highest (31.7%). Deforestation promotes global warming which results from
increased atmospheric concentrations of greenhouse gases (GHG) leading to increment of the
global mean temperature as the forests are the vital terrestrial sink of carbon. Tropical
deforestation is responsible for the emission of roughly two billion tonnes of carbon (as CO2)
to the atmosphere per year (Houghton, 2005). This is in line with the findings of Sumit et al.
(2012) who noted that one of the most important ramifications of deforestation is its effect on
the global atmosphere.
-67-World News of Natural Sciences 18(2) (2018) 62-71
The table also revealed that soil erosion had 24.2%. This agrees with the findings of
Habtamu et al. (2017) who found out that the most common effects of deforestation are soil
erosion, loss of soil fertility, increase in temperature, loss of biodiversity, rainfall variability
and water and fuel wood scarcity.
Extinction of wildlife habitat had 12.5%. It is generally accepted that forests especially
those in the tropics serve as storehouses of biodiversity and consequently deforestation,
fragmentation and degradation destroys the biodiversity as a whole and habitat for migratory
species including the endangered ones.
Other environmental hazards had 9.2%. Forest serves a number of protective roles to the
environment, when these forests are absent, environmental hazard is bound to occur. When
trees are felled without replacement, environmental hazards would likely occur.
Table 3. Effects of Deforestation
Factors Frequency (n = 120) Percentage (%)
Global warming 38 31.7
Aridity 27 22.4
Soil Erosion 29 24.2
Extinction of wildlife habitat 15 12.5
Other environmental hazards 11 9.2
Source: Field Survey, 2017.
3. 4. Strategies for Reducing Deforestation in the Study Area
Table 4 shows the strategies for reducing deforestation. It was revealed that
afforestation had 27.5%. Increasing the area of forest plantations by using vacant or marginal
lands and on land not ideal for agricultural production will be beneficial. Planting trees
outside forest areas will reduce pressure on forests for timber, fodder and fuelwood demands.
Public enlightenment had 13.3%. When the communities have knowledge about the
adverse effects of deforestation, the level of forest degradation would be reduced.
Encouragement of agroforestry practices had 30.8%. This can meet the need of the rural
community by providing food, environmental benefits and fuelwood.
Enforcement of forest land and policy had 12.5%. A wide variety of policies are
currently in place to protect forests but need to be effectively enforced. New modifications are
required for site specific conditions.
Forest education had 8.3%, forest conservation and preservation had 7.5%.Training and
education of stakeholder’s helps people understand how to prevent and reduce adverse
environmental effects associated with deforestation and to take appropriate action when
possible.
-68-World News of Natural Sciences 18(2) (2018) 62-71
Table 4. Strategies for Reducing Deforestation
Factors Frequency (n = 120) Percentage (%)
Afforestation and reforestation 33 27.5
Public enlightenment 16 13.3
Encourage agroforestry practices 37 30.8
Enforcement of forest law and policy 15 12.5
Forest education 10 8.3
Forest conservation and preservation 9 7.5
Source: Field Survey, 2017.
4. CONCLUSION
The study has revealed that there were many causes of deforestation in the study area
and they include; logging, fuel wood gathering, urbanization, overpopulation, farming and
inequitable distribution of income. Global warming, soil erosion, extinction of wildlife habitat
were some of the effects of deforestation in the study area. Afforestation, agroforestry
practices, forest education enforcement of forest law and policy, forest preservation and
conservation were ways to mitigate deforestation in the study area.
References
[1] A.A. Aiyeloja and U.D. Chima, Economic and Ecological Consequences of Charcoal
Production in Oyo State, Nigeria. Asia-Pacific Journal of Rural Development 21(1)
(2011) 85-92.
[2] A. Soury, Sacred forests: a sustainable conservation strategy. The case of sacred forests
in the Ouémé Valley, Benin. Netherland: Wageningen University (2007) 1-109.
[3] Food and agriculture organization (FAO), Global Forest Resources Assessment. FAO
Forestry Paper 140, Rome, Italy, (2000) 479.
[4] Food and agriculture organization (FAO), Global Forest Resources Assessment. Food
and Agriculture Organization of the United Nations, Rome. Italy, (2010) 340.
[5] H.K. Gibbs, A.S. Ruesch, F. Achard, M.K. Clayton, P. Holmgren, N. Ramankutty and
J. A. Foley Tropical forests were the primary sources of new agricultural land in the
1980s and 1990s. Proceedings of the National Academy of Sciences of the United States
of America 107(38) (2010) 16732–16737.
-69-World News of Natural Sciences 18(2) (2018) 62-71
[6] J. A. Foley, N. Ramankutty, K. A. Brauman, E. S. Cassidy, J. S. Gerber, M. Johnston,
N. D. Mueller, C. O’Connell, D. K. Ray, P. C. West, C. Balzer, E. M. Bennett, S. R.
Carpenter, J. Hill, C. Monfreda, S. Polasky, J. Rockström, J. Sheehan, S. Siebert, D.
Tilman and D. P. M. Zaks, Solutions for a cultivated planet. Nature 478 (2011) 337–
342.
[7] J.J. McCarthy, O.F. Canziani, N.A. Leary, D.J. Dokken, KS White, Climate Change
2001: Impacts, Adaptation and Vulnerability, Contribution of Working Group II to the
Third Assessment Report of the Intergovernmental Panel on Climate Change.
Cambridge University Press, Cambridge, UK, (2001) 1-1005.
[8] O.A. Adeniji, O.S. Zaccheaus, B.S. Ojo, and A.S. Adedeji, Charcoal Production and
Producers' Tree Species Preference in Borgu Local Government of Niger State, Nigeria.
Journal of Energy Technologies and Policy 5 (2015) 1-8.
[9] P. Gillet V. Cédric, D. Jean-Louis, C. Elisabet, L. Charlotte and F. Laurène, What Are
the Impacts of Deforestation on the Harvest of Non-Timber Forest Products in Central
Africa? Forests 7 (2016) 106.
[10] R. A. Houghton, Tropical deforestation as a source of greenhouse gas emissions. In:
Tropical deforestation and Climate change, eds. Moutinho, P. and Schwartzman, S.
Amazon Institute for Environmental Research, Belem Brazil (2005) 13-20.
[11] R.J. Culas, Deforestation and environmental Kuznets Curve: an institutional
perspective. Ecological Economics 61(2-3) (2006) 429-437.
[12] R. Sands, Forestry in a Global Context: CABI Publishing Agency, Oxfordshire, 2013.
ISBN 9781780641560, DOI: 10.1079/9781780641560.0000
[13] S. Sukumaran, and S. Jeeva, A floristic study on miniature sacred forests at
Agastheeshwaram, southern peninsular India. Eurasian Journal of Biosciences 2 (2008)
66-72.
[14] T. Ali, B. Shahbaz., and A. Suleri, “Analy sis of Myths and Realities of Deforestation in
Nort h West Pakistan: Implications for Forestry” International Journal of Agriculture
and Biology 08(01) (2006) 107-110.
[15] W. E. Habtamu, H. F. Debela, and T. Serekebirhan, Impacts of deforestation on the
livelihood of smallholder farmers in Arba Minch Zuria Woreda, Southern Ethiopia.
African Journal of Agricultural Research 12(15) (2017) 1293-1305.
[16] Boyowa A. Chokor. Government policy and environmental protection in the developing
world: The example of Nigeria. Environmental Management January 1993, Volume 17,
Issue 1, pp 15–30
[17] Aweto, D. O. 1990. Plantation forestry and forest conservation in Nigeria. The
Environmentalist 10: 127–137
[18] Chokor, B. A. 1989. Environmental cognition and Landscape research: Issues and
opportunities for environmental planning in Nigeria. Annals of the Social Sciences
Council of Nigeria 2: 82–97
[19] Conable, B. B. 1989. Development and the environment: A global balance. Finance and
Development 26: 1–4
-70-World News of Natural Sciences 18(2) (2018) 62-71
[20] Omuta, G. E. D. 1985. The petroleum factor in environmental decay in Isoko Local
Government Area, Bendel State, Nigeria. GeoJournal 11: 173–181
[21] Walker, B. 1985. Famine in Africa—the real causes and possible solutions. The
Environmentalist 5: 167–170.
[22] A. C. Salihu, A. B. Nabegu, B. Abdulkarim, A. Mustapha, Analysis of the factors
affecting facilities compliance to environmental regulations in Minna – Niger State,
Nigeria. World Scientific News 45(2) (2016) 174-184
[23] Nicholas E. Okwodu, Aquaculture for sustainable development in Nigeria. World
Scientific News 47(2) (2016) 151-163
[24] A. M. Yunusa, A. B. Nabegu, R. O. Yusuf, Assessment of the constraints in the
environmental management plan of filling stations in Kaduna metropolis, Nigeria.
World Scientific News 56 (2016) 178-188
[25] Shasho Megersa, Abdella Gure, Melaku Alemu, Sisay Feleke, Qualitative Assays and
Quantitative Determinations of Laccases of White Rot Fungi from Plantation and
Natural Forests of Arsi Forest Enterprise, Ethiopia. World Scientific News 67(2) (2017)
303-323
[26] Gabriel A. Adedeji, Adedapo A. Aiyeloja, Exotic versus indigenous and implication for
Environmental Forestry Management in the Niger Delta, Nigeria. World Scientific News
74 (2017) 53-67
[27] Sunday Edet Etuk, Okechukwu Ebuka, Ekaete Sunday Edet, Spatial Distribution of
Government and Donor Organization Provided Public Water Facilities in Uyo
Metropolis, Niger Delta Region, Nigeria, Using Geographical Information System.
World Scientific News 94(2) (2018) 217-235
-71-You can also read