Influence of initial soil moisture in a regional climate model study over West Africa - Part 2: Impact on the climate extremes
←
→
Page content transcription
If your browser does not render page correctly, please read the page content below
Hydrol. Earth Syst. Sci., 26, 731–754, 2022
https://doi.org/10.5194/hess-26-731-2022
© Author(s) 2022. This work is distributed under
the Creative Commons Attribution 4.0 License.

Influence of initial soil moisture in a regional climate model study
over West Africa – Part 2: Impact on the climate extremes
Brahima Koné1 , Arona Diedhiou1,2 , Adama Diawara1 , Sandrine Anquetin2 , N’datchoh Evelyne Touré1 ,
Adama Bamba1 , and Arsene Toka Kobea1
1 LASMES    – African Centre of Excellence on Climate Change, Biodiversity and Sustainable
Agriculture (ACE CCBAD)/Université Félix Houphouët Boigny, 00225 Abidjan, Côte d’Ivoire
2 Univ. Grenoble Alpes, IRD, CNRS, Grenoble INP, IGE, 38000 Grenoble, France

Correspondence: Arona Diedhiou (arona.diedhiou@ird.fr)

Received: 7 March 2020 – Discussion started: 8 May 2020
Revised: 12 December 2021 – Accepted: 20 December 2021 – Published: 11 February 2022

Abstract. The influence of soil moisture initial conditions         region. Over the Central Sahel, wet (dry) experiments lead to
on the climate extreme indices over West Africa was in-             a decrease (increase) in the maximum values of the minimum
vestigated using the fourth generation of the International         temperature.
Centre for Theoretical Physics regional climate model (non-
hydrostatic) coupled with version 4.5 of the Community
Land Model (RegCM4–CLM4.5) at a 25 km spatial reso-                 1   Introduction
lution. We initialized the control experiments with the re-
analysis soil moisture data from the European Centre for            West Africa experienced large rainfall variability during the
Medium-Range Weather Forecasts (ECMWF) reanalysis of                late 1960s. This variability often leads to flooding events,
the 20th century (ERA-20C), while we initialized the dry and        severe drought and regional heat waves, which have major
wet experiments with the maximum and minimum soil mois-             economic, environmental and societal impacts (Easterling et
ture values over the West Africa domain, respectively. For          al., 2000; Larsen, 2003). In recent years, climate extremes
each experiment, an ensemble of five runs was performed             have attracted much interest because they are expected to oc-
for 5 years (2001–2005) with soil moisture initial conditions       cur more frequently (International Panel on Climate Change
for the runs prescribed on 1 June and the simulations being         – IPCC, 2013) than changes in the mean climate. Yan and
performed over 4 months (122 d) from June to September.             Yang (2000) showed that extreme climate changes were 5–10
The performance of RegCM4–CLM4.5 with respect to sim-               times greater than climate mean change in many cases. Many
ulating the 10 extreme rainfall and temperature indices used        key factors or physical mechanisms could be the cause of
in this study is presented. The results are then discussed for      the increase in climate extremes (Nicholson, 1980; Le Barbé
the two idealized simulations that are most sensitive to the        et al., 2002), such as the effect of increasing greenhouse
dry and wet soil moisture initial conditions in order to high-      gases in the atmosphere on the intensification of hot ex-
light the impacts beyond the limits of soil moisture internal       tremes (IPCC, 2007), sea surface temperature (SST) anoma-
forcing in the model. Over the Central Sahel, dry (wet) ex-         lies (Fontaine and Janicot, 1996; Folland et al., 1986) and
periments lead to a decrease (increase) in precipitation ex-        land surface conditions (Philippon et al., 2005; Nicholson,
treme indices related to the number of events, but this was         2000). In addition, smaller-scale physical processes, includ-
not seen for indices related to the intensity of the events. Soil   ing the interactions of land–atmosphere coupling, can lead to
moisture initial conditions unequally affect the daily mini-        changes in climate extremes. Jaeger and Seneviratne (2011)
mum and maximum temperatures. The strongest impact is               studied the influence of soil moisture on land–atmosphere
found on the maximum temperature: wet (dry) experiments             coupling during the European summer using a regional cli-
decrease (increase) the maximum temperature over the whole          mate model with a focus on the extremes and trends in pre-
                                                                    cipitation and temperature. For extreme temperatures, their

Published by Copernicus Publications on behalf of the European Geosciences Union.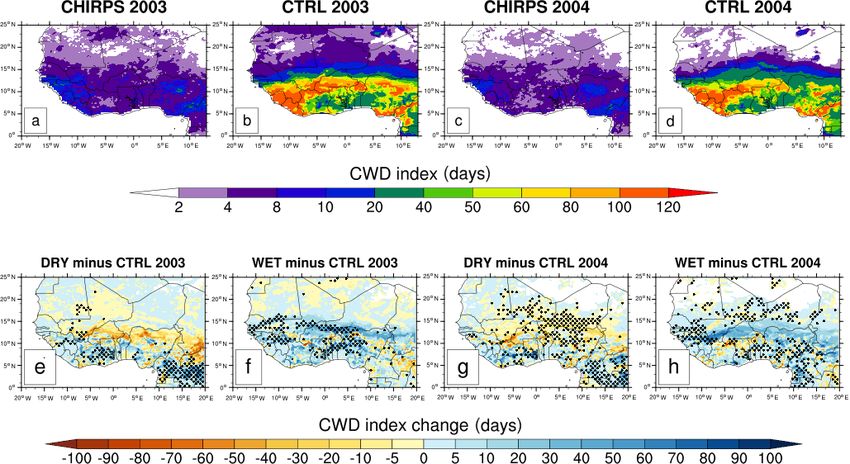
732          B. Koné et al.: Influence of initial soil moisture in a regional climate model study over West Africa – Part 2

study showed that interactions between soil moisture and cli-       SUBgrid EXplicit moisture scheme (SUBEX) and considers
mate have a significant impact, whereas they only influence         the sub-grid variability in clouds. The accretion and evapo-
the frequency of wet days for extreme precipitation. Over           ration processes for stable precipitation are from Sundqvist
Asia, Liu et al. (2014) studied the impact of soil moisture         et al. (1989). The sensible heat and water vapor in the plan-
anomalies on subsequent precipitation and temperature us-           etary boundary layer over land and ocean as well as the tur-
ing a regional climate model. They showed that numerical            bulent transport of momentum are reported by Holtslag et
wet (dry) experiments decrease (increase) the hot extremes,         al. (1990). The heat and moisture as well as the momentum of
decrease (increase) the drought extremes and increase (de-          ocean surface fluxes are from Zeng et al. (1998). Convective
crease) the cold extremes in a zone with strong soil moisture–      precipitation and land surface processes in RegCM4.7 are
atmospheric coupling. However, none of these studies exam-          represented by several options. Based on Koné et al. (2018),
ined the impacts of the soil moisture initial conditions on sub-    the convective scheme of Emanuel (1991) is used. The pa-
sequent climate extremes using a regional climate model over        rameterization of land surface processes is from CLM4.5
West Africa. In Part 1 (Konë et al., 2022) of this study, the in-   (Oleson et al., 2013). In each grid cell of CLM4.5, there are
fluence of initial soil moisture on the climate mean was based      16 different plant functional types (PFTs) and 10 soil layers
on a performance assessment of the fourth generation of the         (Lawrence et al., 2011; Wang et al., 2016). The integration
International Centre for Theoretical Physics regional climate       of RegCM4 over the West Africa domain is shown in Fig. 1
model coupled with the complex Community Land Model                 with 18 vertical levels and a 25 km horizontal resolution
(RegCM4–CLM4.5) performed by Koné et al. (2018), who                (182 × 114 grid points; from 20◦ W to 20◦ E and from 5◦ S
validated the ability of the model to reproduce the climate         to 21◦ N). The European Centre for Medium-Range Weather
mean. However, in this paper (Part 2), prior to studying the        Forecasts (ECMWF) ERA-Interim reanalysis (EIN75; Up-
influence of initial soil moisture on climate extremes, it was      pala et al., 2008; Simmons et al., 2007) provides the ini-
necessary to assess the performance of RegCM4–CLM4.5                tial and boundary conditions. The sea surface temperatures
with respect to simulating the 10 temperature indices and ex-       are derived from the National Oceanic and Atmosphere Ad-
treme rainfall events used in this work. This has never been        ministration Optimal Interpolation weekly (NOAA OI_WK)
done before in Africa; therefore, we separated the work in          (Reynolds and Smith, 1994). The topography is derived from
two parts. This paper is organized as follows: Sect. 2 de-          the United States Geological Survey (USGS) Global Multi-
scribes the RegCM4 model, the experimental design and the           resolution Terrain Elevation Data (GMTED; Danielson and
methodology used in this study; Sect. 3 presents the assess-        Gesch, 2011) at a spatial resolution of 30 arcsec, which is an
ment of RegCM4–CLM4.5 with respect to extreme climate               update of the Global Land Cover Characterization (GTOPO;
simulation and the impacts of the soil moisture initial condi-      Loveland et al., 2000) dataset.
tions on climate extremes; and Sect. 4 documents the conclu-           We used the soil moisture from the ECMWF reanaly-
sions.                                                              sis of the 20th century (ERA-20C) to initialize the con-
                                                                    trol runs. Wet and dry experiments were initialized for the
                                                                    soil moisture at the maximum (0.489 m3 m−3 ) and minimum
2     Model, experimental design and methodology                    (0.117×10⁻⁴ m3 m−3 ) soil moisture values over West Africa
                                                                    derived from the ERA-20C soil moisture dataset. We de-
2.1    Model description and numerical experiments                  signed three experiments (reference, wet and dry), each with
                                                                    an ensemble of five simulations (2001, 2002, 2003, 2004
The fourth generation of the International Centre for The-          and 2005) starting from 1 June to 30 September. The dif-
oretical Physics (ICTP) regional climate model (RegCM4)             ference between these three experiments is the change in the
is used in this study. Since this version, physical represen-       initial soil moisture conditions (reference initial soil moisture
tations have been subject to a continuous process of imple-         condition, wet initial soil moisture condition and dry initial
mentation and development. The release used in this study           soil moisture condition) during the first day of the simulation
was RegCM4.7. The non-hydrostatic dynamical core of the             over the West Africa domain. We then selected the 2 years
MM5 (Mesoscale Model version 5; Grell et al., 1994) was             most affected by the wet and dry initial soil moisture condi-
ported to RegCM4 while maintaining the existing hydro-              tions (2003 and 2004) to estimate the limits of the impact of
static core. RegCM4 is a limited-area model using a ver-            the internal soil moisture forcing on the new non-hydrostatic
tical grid sigma hydrostatic pressure coordinate and a hor-         dynamic core of RegCM4.
izontal grid of the Arakawa B-grid (Giorgi et al., 2012).              For the 2 years most sensitive to soil moisture initial con-
The radiation scheme is from the National Center for Atmo-          ditions, a Student t test is used to compare the significance
spheric Research (NCAR) Community Climate Model ver-                of changes in climate extreme indices between a wet or dry
sion 3 (CCM3) (Kiehl et al., 1996), and the aerosol represen-       sensitivity test (sample 1) and the control (sample 2), under
tation is from Zakey et al. (2006) and Solmon et al. (2006).        the assumption that this method performs well for climate
The large-scale precipitation scheme used in this study is          simulations (Damien et al., 2014) and knowing that it is ex-
from Pal et al. (2000); the moisture scheme is called the           tensively used for climatological analysis (Menédez et al.,

Hydrol. Earth Syst. Sci., 26, 731–754, 2022                                           https://doi.org/10.5194/hess-26-731-2022
B. Koné et al.: Influence of initial soil moisture in a regional climate model study over West Africa – Part 2                   733

Figure 1. Topography of the West Africa domain. The analysis of the model results has an emphasis on the whole West Africa domain and
the three subregions, Guinea coast, Central Sahel and West Sahel, which are marked with black boxes.

2019; Takahashi and Polcher, 2019). In this study, a t test at          The performance of RegCM4–CLM4.5 with respect to
the 95 % confidence level was used to define statistical sig-        simulating the extreme indices is evaluated using four se-
nificance.                                                           lected subregions (Fig. 1), based on the previous work of
                                                                     Koné et al. (2018), that correspond to different annual pre-
2.2   Validation datasets and evaluation metrics                     cipitation cycle features. We used the mean bias (MB), which
                                                                     captures the small-scale differences between the simulations
Our investigation focused on the air temperature at 2 m              and observations. The pattern correlation coefficient (PCC)
and the precipitation over the West Africa domain during             is also used as a spatial correlation between model simula-
the June–July–August–September (JJAS) period for 2003                tions and observations to indicate the large-scale similarity
and 2004. The simulated precipitation fields were validated          degree.
with the high-resolution 0.05◦ Climate Hazards Group In-                To quantify the impact of soil moisture initial condi-
fraRed Precipitation Station (CHIRPS) dataset from the Uni-          tions on climate extremes over Asia, Liu et al. (2014) used
versity of California at Santa Barbara, available from 1981          the MBs of five subregions. In our study, we used the MBs
to 2020. We used CHIRPS as a reference in this study                 and the probability density functions (PDFs; Gao et al., 2016;
mainly because it has been widely assessed and used for the          Jaeger and Seneviratne, 2011) for this purpose in order to bet-
study of extreme events in West Africa by Bichet and Died-           ter capture the number of grid points impacted by initial soil
hiou (2018a, b) and Didi et al. (2020).                              moisture as well as their highest value.
   We validated the 2 m temperature using the National
Oceanic and Atmospheric Administration (NOAA) Climate                2.3   Extreme rainfall and temperature indices
Prediction Center (CPC) daily maximum and minimum
global surface air temperature. The NOAA/CPC global daily            In this study, we investigated the changes in precipitation and
surface 2 m air temperature (CPC-T2m) is a land-only grid-           temperature in terms of duration, occurrence and intensity
ded global daily maximum (Tmax) and minimum (Tmin)                   of six extreme rainfall and four extreme temperature indices
temperature analysis from 1979 to the present, available at          using daily rainfall and daily minimum and maximum tem-
two spatial resolutions: 10 min × 10 min and 0.5◦ ×0.5◦ (lat-        perature data (Table 1). These 10 extreme indices are recom-
itude × longitude). This product provides an observational           mended by the Expert Team on Climate Change Detection
T2m estimate for climate monitoring, model evaluation and            and Indices (ETCCDI; Peterson et al., 2001).
forecast verification (Fan and van den Dool, 2008; Pan et al.,
2019). In this study, the daily Tmax and Tmin are used at
a spatial resolution of 0.5◦ × 0.5◦ . To compare the model
simulations with the observation datasets, we regridded all
the products to 0.22◦ × 0.22◦ using a bilinear interpolation
method (Nikulin et al., 2012).

https://doi.org/10.5194/hess-26-731-2022                                             Hydrol. Earth Syst. Sci., 26, 731–754, 2022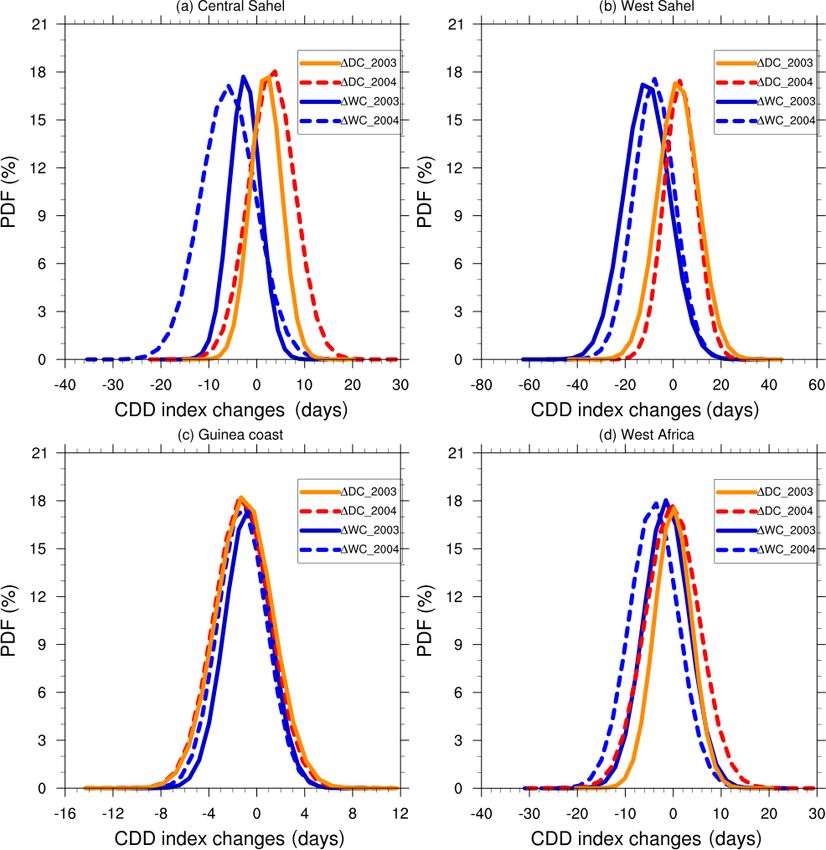
734 B. Koné et al.: Influence of initial soil moisture in a regional climate model study over West Africa – Part 2
Table 1. The 10 extreme climate indices used in this study.
Extreme indices Definition Units
Extreme rainfall indices
1. R1mm Number of wet days (daily precipitation ≥ 1 mm) Days
2. SDII The mean amount of precipitation on wet days (daily precipitation ≥ 1 mm) mm d−1
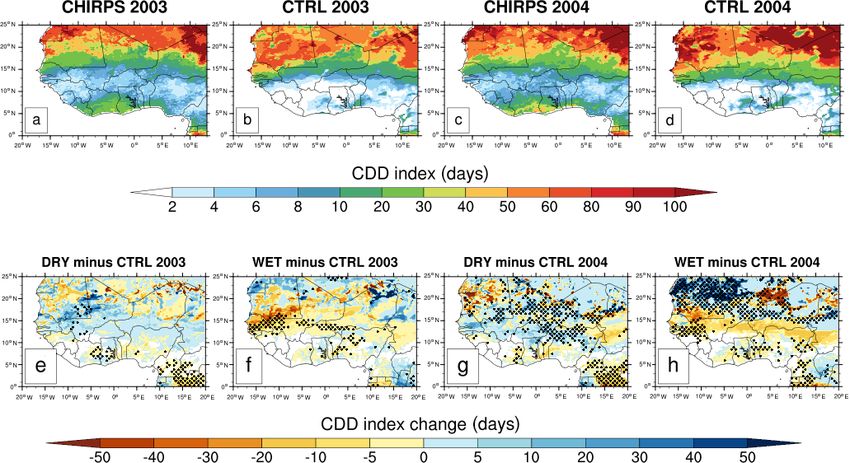
3. CDD Maximum number of consecutive dry days (daily precipitation < 1 mm d−1 ) Days
4. CWD Maximum number of consecutive wet days (daily precipitation ≥ 1 mm d−1 ) Days
5. RX1day The maximum 1 d precipitation accumulation mm
6. R95pTOT Precipitation percent due to very heavy precipitation days mm
Extreme temperature indices
7. TXn Minimum value of daily maximum temperature ◦C
8. TXx Maximum value of daily maximum temperature ◦C
9. TNn Minimum value of daily minimum temperature ◦C
10. TNx Maximum value of daily minimum temperature ◦C
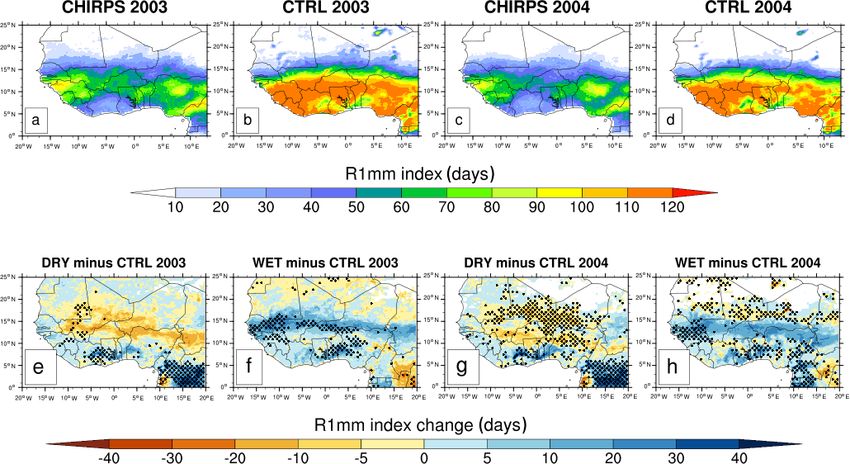
Figure 2. Mean values of the number of the wet days (R1mm index in days) from CHIRPS (a, c) observations for JJAS 2003 and JJAS 2004
and the simulated control (CTRL) experiments (b, d) initialized with initial soil moisture values from the ERA-20C reanalysis (top row) and
changes in R1mm index in days (bottom row) for JJAS 2003 and JJAS 2004, from dry (e, g) and wet (f, h) experiments with respect to the
control experiments. Areas with values passing the 95 % significance test are dotted.
3 Results and discussion ues of all of the precipitation indices studied in this section
for simulations obtained from control experiments with re-
3.1 Seasonal extreme rainfall spect to CHIRPS observations calculated for the West Sahel,
Central Sahel, Guinea coast and entire West Africa domains
In this section, we analyzed six extreme rainfall indices based during the JJAS 2003 and JJAS 2004 runs.
on daily precipitation in RegCM4 simulations over West
Africa. All precipitation indices were calculated for JJAS
in 2003 and 2004. Table 2 summarizes the PCC and MB val-
Hydrol. Earth Syst. Sci., 26, 731–754, 2022 https://doi.org/10.5194/hess-26-731-2022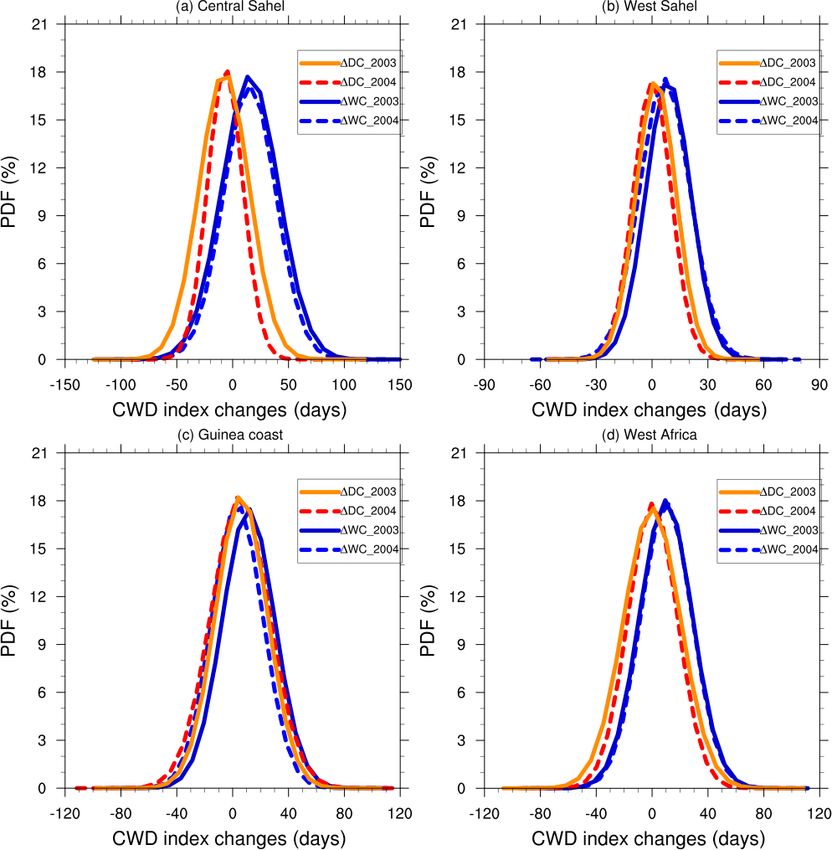
B. Koné et al.: Influence of initial soil moisture in a regional climate model study over West Africa – Part 2                    735

Table 2. The pattern correlation coefficient (PCC) and the mean bias (MB) of the R1mm (in days), SDII (in mm d−1 ), CDD (in days), CWD
(in days), RX1day (in mm) and R95pTOT (in mm) indices for control experiments (initialized with initial soil moisture values from the
ERA-20C reanalysis) with respect to CHIRPS calculated over the Guinea coast, Central Sahel, West Sahel and entire West Africa domains
for JJAS 2003 and JJAS 2004.

                                    Central Sahel         West Sahel            Guinea coast         West Africa
                                      MB     PCC            MB    PCC             MB      PCC          MB     PCC
                   R1mm (days)
                   CTRL_2003         33.17   0.98        −5.25     0.96         53.16     0.96       22.18    0.96
                   CTRL_2004         29.50   0.98          1.34    0.96         55.46     0.96       23.85    0.95
                   SDII (mm d−1 )
                   CTRL_2003        −7.52    0.97        −9.95     0.94        −13.62     0.77       −7.67    0.73
                   CTRL_2004        −7.01    0.97        −9.37     0.94        −14.65     0.81       −7.59    0.77
                   CDD (days)
                   CTRL_2003          0.93   0.90         14.49    0.91         −7.84     0.66         2.63   0.85
                   CTRL_2004          4.75   0.91         17.51    0.95         −9.43     0.68         6.99   0.89
                   CWD (days)
                   CTRL_2003         45.56   0.83         18.44    0.75         59.21     0.88       31.20    0.81
                   CTRL_2004         36.78   0.79         20.48    0.78         60.51     0.82       29.74    0.79
                   RX1day (mm)
                   CTRL_2003        −26.46   0.78       −38.07     0.91        −30.28     0.54     −20.08     0.50
                   CTRL_2004        −22.89   0.46       −36.67     0.88        −42.44     0.42     −20.23     0.40
                   R95pTOT (mm)
                   CTRL_2003        −27.67   0.67       −33.39     0.77        −43.22     0.65     −29.12     0.59
                   CTRL_2004        −24.38   0.46       −31.75     0.80        −46.61     0.60     −27.45     0.55

3.1.1   The number of the wet days (R1mm)                              found over the Guinea coast, with MB values of more than
                                                                       53.16 and 55.46 d for the JJAS 2003 and JJAS 2004 runs,
                                                                       respectively (Table 2). This overestimation of the number of
Figure 2 shows the mean values of the number of wet
                                                                       wet days in RegCM4 is also found by Thanh et al. (2017)
days (R1mm, in days) from CHIRPS observations (Fig. 2a, c)
                                                                       with RegCM4 for Asia.
and the simulated control experiments (Fig. 2b, d) with the
                                                                          Figure 2 (bottom row) displays additional changes in the
initial soil moisture derived from the ERA-20C reanalysis.
                                                                       R1mm index for JJAS 2003 and JJAS 2004 from the dry
The R1mm index maximum values of up to 100 d in CHIRPS
                                                                       (Fig. 2e, g) and wet experiments (Fig. 2f, h) compared with
observations are found over mountainous regions such as the
                                                                       the control experiments; the dotted area shows changes with
Cameroon Mountains, Jos Plateau and Guinea Highlands,
                                                                       statistical significance at the 95 % level. The dry experiments
whereas minimum values of less than 50 d are found over the
                                                                       (Fig. 2e, g) decrease the R1mm index values, whereas the
Sahel and along the coastline from Liberia to Ghana, with
                                                                       wet experiments (Fig. 2h, j) increase them, especially over
the number of wet days decreasing gradually from south to
                                                                       the Central Sahel. However, over the Guinea coast subregion,
north.
                                                                       both wet and dry experiments show a significant increase in
   The control experiments (Fig. 2b, d) reproduce the large-
                                                                       R1mm index values.
scale pattern of the observed rainfall well, with PCC values
                                                                          For a better quantitative evaluation, Fig. 3 displays the
of 0.96 and 0.95 for the JJAS 2003 and JJAS 2004 runs, re-
                                                                       PDF distributions of changes in R1mm over the subdomains
spectively (Table 2), over the entire West Africa domain, but
                                                                       (Fig. 1) during the JJAS 2003 and JJAS 2004 runs, and Ta-
they exhibit some spatial extent and magnitude biases at the
                                                                       ble 3 summarizes the maximum PDF values. The results es-
local scale. The control experiments display a large and quite
                                                                       sentially confirm the linear impact found over the Central Sa-
homogeneous area of maximum R1mm index values below
                                                                       hel (Fig. 3a). Over the West Sahel, the Guinea coast and the
12◦ N latitude and overestimate the number of wet days over
                                                                       West Africa domain (Fig. 3b–d), both dry and wet experi-
most of the study domains (Table 2). The largest MBs are

https://doi.org/10.5194/hess-26-731-2022                                                Hydrol. Earth Syst. Sci., 26, 731–754, 2022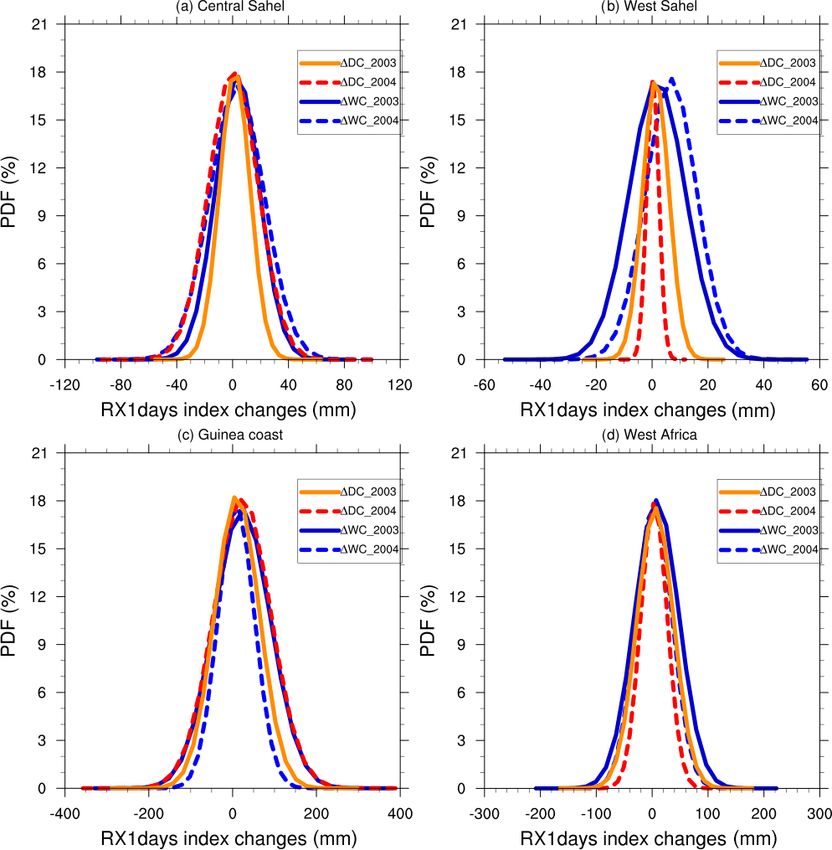
736          B. Koné et al.: Influence of initial soil moisture in a regional climate model study over West Africa – Part 2

ments increase the R1mm index values. The strongest R1mm           3.1.3   Maximum number of consecutive dry days (CDD)
increase is found in wet experiments over the West Sahel,
with a maximum change of about 12 d in JJAS 2003 (Ta-              The duration of consecutive dry days (CDD, in days), which
ble 3), whereas the strongest R1mm decrease is found for dry       represents the maximum number of consecutive dry days
experiments over the Central Sahel, with a maximum change          with precipitation less than 1 mm y−1 , is analyzed in this
of about −5.19 d (Table 3).                                        subsection. Figure 6 (top row) is the same as Fig. 2 (top
   Summarizing the results of this section, RegCM4 over-           row) but for CDD. CHIRPS observations locate the high-
estimated the number of wet days over most of the study            est CDD values over the Sahara, with a length of more than
domains. Over the Central Sahel, wet and dry experiments           50 d (Fig. 6a, c). The lowest CDD values are found over the
both lead to a linear impact on the R1mm index with an in-         Guinea coast, with a length of less than 8 d.
crease and a decrease in the number of rainy days, respec-            The control experiments (Fig. 6b, d) over the entire West
tively. These results are compatible with previous work that       Africa domain reproduce the large-scale pattern of the ob-
sustained a strong land–atmosphere coupling in transition ar-      served rainfall well, with PCC values of more than 0.85
eas between wet and dry climate regimes (Zhang et al., 2011;       and 0.89 for the JJAS 2003 and JJAS 2004 runs, respectively
Koster et al., 2006).                                              (Table 1). However, in terms of magnitude, some differences
                                                                   are observed at the local scale. In general, the control experi-
3.1.2   Simple daily intensity index (SDII)                        ments overestimate the CDD over most of subdomains stud-
                                                                   ied, except over the Guinea coast (Table 2). The strongest
In this section, we analyze the SDII index (rainfall intensity,    overestimation is found over the West Sahel, with MB values
in mm d−1 ), which gives the mean amount of precipitation          reaching more than 14.49 and 17.51 d for the JJAS 2003 and
on total wet days (daily precipitation > 1 mm). Figure 4 (top      JJAS 2004 runs, respectively (Table 2). The current model
row) is the same as Fig. 2 (top row) but for the rainfall inten-   parameterization increases the drought extreme over most of
sity. Over the Guinea coast coastline, CHIRPS observations         the study domains, except over the Guinea coast (Table 2).
(Fig. 4a, c) depicted the highest SDII index values (more than        Figure 6 (bottom row) is the same as Fig. 2 (bottom row)
25 mm d−1 ), whereas, CHIRPS observations showed large             but for the CDD. The soil moisture initial conditions’ impact
extend SDII index values (not exceeding 12 mm d−1 ) over           on the CDD index is linear over the Central and West Sahel
the Sahel and Sahara in both the JJAS 2003 and JJAS 2004           (Fig. 6, bottom row); over the Sahel, dry (wet) experiments
runs.                                                              increase (decrease) the length of dry spells. Over the Guinea
   The control experiments (Fig. 4b, d) reproduced the large-      coast, the impacts on the CDD are weak for both dry and wet
scale pattern of CHIRPS well, with PCC values reaching 0.73        experiments and, on average, soil moisture initial conditions
and 0.77 over the West Africa domain in the respective             seem to decrease the length of dry spells in a central band
JJAS 2003 and JJAS 2004 runs (Table 2). However, at the            between Côte d’Ivoire and Nigeria.
local scale, some biases are found. Over most of the study do-        Figure 7 is the same as Fig. 3 but displays the PDF dis-
mains, the magnitude of the SDII is underestimated and does        tribution of the changes in the CDD. The highest increase
not exceed 10 mm d−1 , except over the Cameroon Moun-              in length in the CDD is found over the Central Sahel in
tains (Fig. 4b, d). The largest MB values were located over        dry experiments, with a maximum change in length of up to
the Guinea coast, with MB values greater than −13.62 and           3.80 d in JJAS 2004 (Table 3), whereas the highest decrease
−14.65 mm d−1 for the JJAS 2003 and JJAS 2004 runs, re-            in the CDD is found over the West Sahel in wet experiments,
spectively (Table 2).                                              with maximum change in length of up to −12.73 d in the
   Figure 4 (bottom row) is the same as Fig. 2 (bottom             JJAS 2003 run (Table 3).
row) but for the rainfall intensity. Unlike the R1mm index,           In summary, RegCM4 overestimated the maximum num-
changes in the SDII index due to soil moisture initial condi-      ber of consecutive dry days over most of the subdomains
tions are not linear over most of the study domains. Figure 4      studied, except over the Guinea coast. However, the impact
(bottom row) shows that the impacts of dry and wet experi-         of soil moisture initial conditions is linear over the Central
ments on rainfall intensity generally present areas of increase    and West Sahel. Over the Guinea coast, the dry and wet ex-
and decrease over most of the subdomains studied.                  periments generally decrease the length of dry spells.
   Figure 5 displays PDFs of changes in the SDII, as in Fig. 3.
The PDFs show a maximum change value centered approxi-             3.1.4   Maximum number of consecutive wet
mately on zero (Table 3), indicating that changes in the rain-             days (CWD)
fall intensity for wet and dry experiments are not significant.
   In summary, RegCM4 underestimates the rainfall intensity        The duration of wet spells, represented by the maximum
over the study domain compared with the observations, and          number of consecutive wet days (CWD) with precipita-
the impacts of the wet and dry experiments on the SDII index       tion ≥ 1 mm d−1 , is investigated in this subsection. Figure 8
are not significant.                                               (top row) is the same as Fig. 2 (top row) but shows the
                                                                   CWD duration. In the CHIRPS observations, a maximum

Hydrol. Earth Syst. Sci., 26, 731–754, 2022                                          https://doi.org/10.5194/hess-26-731-2022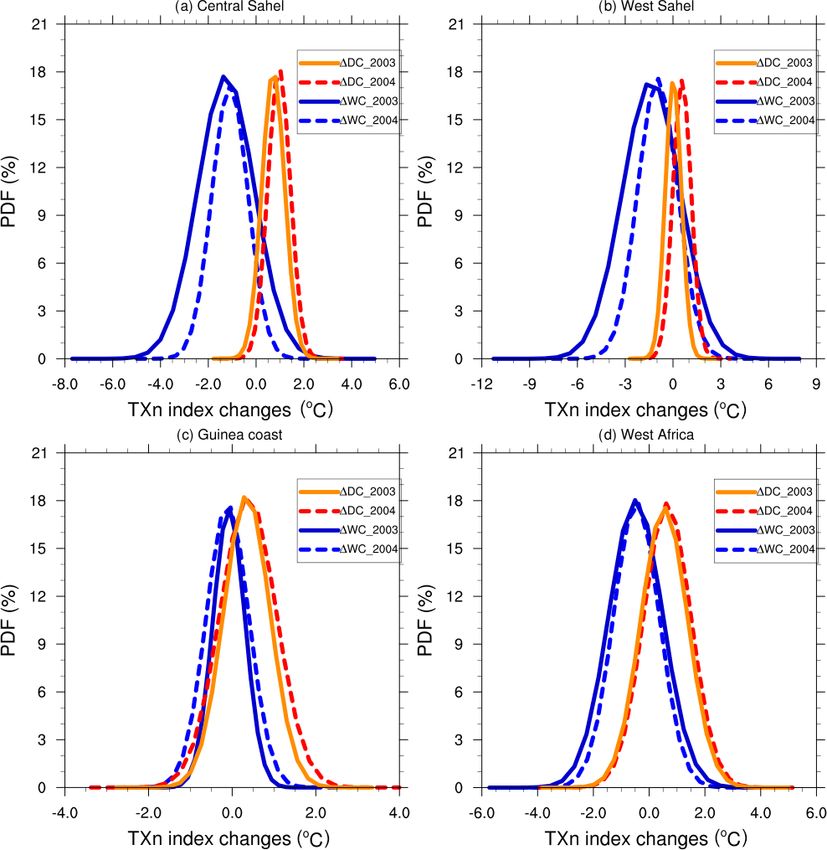
B. Koné et al.: Influence of initial soil moisture in a regional climate model study over West Africa – Part 2                        737

Figure 3. PDF distributions (%) of mean values of the changes in the number of the wet days in JJAS 2003 and JJAS 2004 over the (a) Central
Sahel, (b) West Sahel, (c) Guinea coast and (d) West Africa domains derived from dry (1DC) and wet (1WC) experiments with respect to
the control experiment.

Table 3. Summary of the maximum values of change in PDFs for the R1mm, SDII, CDD, CWD, RX1day and R95pTOT indices. Values in
bold indicate regions with the largest changes in maximum values for the dry and wet experiments.

               Precipitation            Central Sahel           West Sahel            Guinea coast           West Africa
               indices                 1WC        1DC         1WC        1DC         1WC       1DC          1WC       1DC
               R1mm            2003      8.14    –5.19         12.02      0.69         3.92     2.88         4.67      1.75
               (days)          2004     10.01    −3.79         10.14      0.56         4.90     3.57         7.90      2.61
               SDII            2003      0.07      0.11        –0.11     0.14          0.70     0.17         0.29      0.31
               (mm d−1 )       2004      0.03      0.09         0.26    −0.07          0.56     0.22         0.24      0.21
               CWD             2003     13.25    −3.15          6.61     0.64        12.24      4.05         9.43     1.09
               (days)          2004     15.58    –4.48          7.20    −0.19         6.08      3.18        11.89    −0.37
               CDD             2003    −2.80       2.58       –12.73      0.83       −0.68    −1.31        −1.53      0.19
               (days)          2004    −5.92       3.80       −7.75       2.75       −0.93    −1.46        −3.57     −0.44
               RX1day          2003      1.97      3.78         0.11      0.65       26.14      4.17         7.16      7.27
               (mm)            2004      3.35      3.03         7.05      0.19       14.93     15.73         6.46      2.28
               R95pTOT         2003      1.54      1.77         2.88      1.53         4.33     2.37         2.83      2.46
               (mm)            2004      1.66      0.89         4.03      0.43         1.69     0.92         1.37      2.43

https://doi.org/10.5194/hess-26-731-2022                                                 Hydrol. Earth Syst. Sci., 26, 731–754, 2022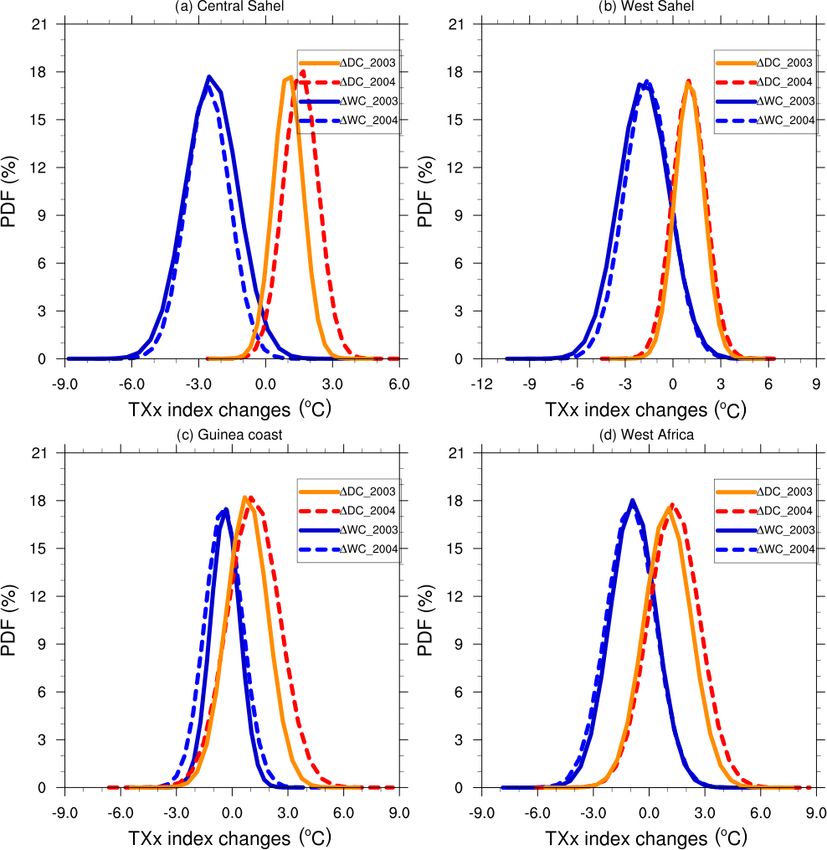
738           B. Koné et al.: Influence of initial soil moisture in a regional climate model study over West Africa – Part 2

Figure 4. Same as Fig. 2 but for the SDII index (in mm d−1 ).

Figure 5. Same as Fig. 3 but for the SDII index (in mm d−1 ).

Hydrol. Earth Syst. Sci., 26, 731–754, 2022                                       https://doi.org/10.5194/hess-26-731-2022
B. Koné et al.: Influence of initial soil moisture in a regional climate model study over West Africa – Part 2              739

Figure 6. Same as Fig. 2 but for the CDD index (in days).

CWD length of more than 20 d is found over the mountain              Figure 9 is the same as Fig. 3 but shows the PDF distri-
regions, such as the Cameroon Mountains, Jos Plateau and          bution of changes in the CWD. In the wet experiments, the
Guinea Highlands, whereas a minimum CWD length of less            strongest CWD increase is found over the Central Sahel, with
than 4 d is found over most of the area above 17◦ N latitude      maximum changes reaching 15.58 d; for the dry experiments,
(Fig. 8a, c).                                                     the strongest CWD decrease is found in the same subdomain,
   The control experiments reproduce the large-scale pattern      with maximum changes reaching −4.48 d.
over the entire West Africa domain well, with PCC values             Summarizing the results of this section, as for the R1mm
of around 0.81 and 0.87 for JJAS 2003 and JJAS 2004, re-          and CDD indices, the impact of wet and dry experiment on
spectively (Table 2). However, at the local scale, the con-       the CWD is linear over the Central Sahel, meaning that dry
trol experiments exhibit some biases in the CWD minimum           (wet) experiments decrease (increase) the CWD lengths. The
and maximum values, both in terms of magnitude and spatial        RegCM4 model overestimates the duration of consecutive
extent. Control experiments overestimate the CWD length           wet days over most of the subdomains studied. This overes-
over most of the subdomains studied (Fig. 8b, d). We note         timation is associated with the excessive number of wet days
that areas of overestimation coincide with areas of excessive     in the model, as documented by Diaconescu et al. (2015).
R1mm values (Fig. 2b, d). The strongest overestimation is
found over the Guinea coast, reaching 59.21 and 60.51 d for       3.1.5   Maximum 1 d precipitation
JJAS 2003 and JJAS 2004, respectively (Table 2).                          accumulation (RX1day)
   Figure 8 (bottom row) is the same as Fig. 2 (bottom row)
but displays changes in the CWD. As for the R1mm in-
                                                                  The maximum 1 d precipitation accumulation (RX1day) dur-
dex, the dry (wet) experiments decrease (increase) the CWD
                                                                  ing JJAS 2003 and JJAS 2004 is assessed in this section. Fig-
length for both JJAS 2003 and JJAS 2004 over the Central
                                                                  ure 10 (top row) shows the spatial distribution of the RX1day.
Sahel. This result confirms the strong influence of soil mois-
                                                                  CHIRPS observations confine the spatial extent of RX1day
ture initial conditions in the Sahel band, as found by Zhang et
                                                                  maximum values greater than 80 mm to the Guinea coast
al. (2011) and Koster et al. (2006) over transition zones with
                                                                  coastline, whereas a large extent of RX1day minimum val-
a climate between dry and wet regimes. However, over the
                                                                  ues (less than 50 mm) are found over the Sahara, Sahel and
Guinea coast and the West Sahel, the changes are not linear,
                                                                  part of Guinea coast.
and both dry and wet experiments increase the CWD length
                                                                     The control experiments capture the spatial pattern of
(Fig. 8e–h).
                                                                  the RX1day, with PCC values of around 0.50 and 0.4 for

https://doi.org/10.5194/hess-26-731-2022                                         Hydrol. Earth Syst. Sci., 26, 731–754, 2022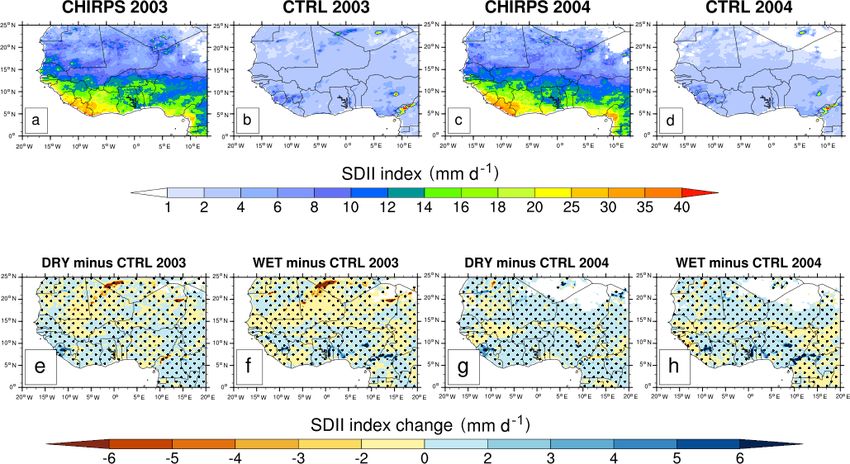
740           B. Koné et al.: Influence of initial soil moisture in a regional climate model study over West Africa – Part 2

Figure 7. Same as Fig. 3 but for the CDD index (in days).

JJAS 2003 and JJAS 2004, respectively (Table 2). A low           with values reaching 26.14 and 14.93 during JJAS 2003 and
PCC is also obtained by Thanh et al. (2017) over Asia with       JJAS 2004, respectively (Table 3).
RegCM4 (correlation < 0.3). The model simulations fail to          In summary, RegCM4 underestimates the maximum 1 d
capture the magnitude and spatial extent of the RX1day           precipitation accumulation over most of the study domain.
maxima. The control experiments underestimate the RX1day         Both wet and dry experiments lead to an increase in the
over most of the subdomains studied, and this seems to be        RX1day.
associated with the overly weak precipitation simulated by
the model. The largest underestimation is located over the       3.1.6   Precipitation percent due to very heavy
Guinea coast and the West Sahel. For instance, over the                  precipitation days (R95pTOT)
West Sahel, the MB values are −38.07 and −36.67 mm for
JJAS 2003 and JJAS 2004, respectively (Table 2).                 In this section, we investigate the precipitation percentage
   Figure 10 (bottom row) is similar to Fig. 2 (bottom row)      due to very heavy precipitation days during JJAS 2003 and
but displays changes in the RX1day. As for the SDII, the         JJAS 2004. Figure 12 (top row) is the same as Fig. 2 (top
impact of the soil moisture initial conditions on the RX1day     row) but shows the spatial distribution of R95pTOT. CHIRPS
is not linear (Fig. 10, bottom row).                             observations confine the R95pTOT maximum values greater
   Figure 11 is similar to Fig. 3 but shows the PDF distri-      than 40 mm to the Guinea coast, whereas R95pTOT index
bution of changes in the RX1day. Increases in the RX1day         minimum values of less than 30 mm are found over the
for both dry and wet experiments are found over most of the      Central and West Sahel (Fig. 10a, c). The control experi-
subdomains studied (Fig. 11). The strongest increase in the      ments (Fig. 12b, d) capture the large spatial pattern, with
RX1day is found over the Guinea coast for wet experiments,       PCC values of 0.59 and 0.55 for JJAS 2003 and JJAS 2004,
                                                                 respectively (Table 2). As with the SDII and RX1day in-
                                                                 dices, the control experiments underestimate the values of

Hydrol. Earth Syst. Sci., 26, 731–754, 2022                                       https://doi.org/10.5194/hess-26-731-2022
B. Koné et al.: Influence of initial soil moisture in a regional climate model study over West Africa – Part 2 741 Figure 8. Same as Fig. 2 but for the CWD index (in days). Figure 9. Same as Fig. 3 but for the CWD index (in days). https://doi.org/10.5194/hess-26-731-2022 Hydrol. Earth Syst. Sci., 26, 731–754, 2022
742          B. Koné et al.: Influence of initial soil moisture in a regional climate model study over West Africa – Part 2

Figure 10. Same as Fig. 2 but for the RX1day index (in mm).

the R95pTOT index, whereas they overestimate the R1mm               3.2     Temperature extreme indices
index. This is also due to the current physical parameteriza-
tion scheme of the RegCM4 model, which results in a posi-           In this section, using daily maximum and minimum temper-
tive bias for the number of wet days with a low precipitation       atures, we analyzed four extreme temperature indices (Ta-
amount (e.g., 1 mm d−1 ) and a negative bias for the num-           ble 1) in RegCM4 simulations over West Africa. All temper-
ber of wet days with a higher precipitation threshold (e.g.,        ature indices are calculated for JJAS 2003 and JJAS 2004.
10 mm d−1 ; not shown here).                                        Table 4 summarizes the PCC and MB values of all temper-
   The control experiments underestimate R95pTOT over the           ature indices for the control experiments (with initial soil
different study domains. The highest R95pTOT underestima-           moisture from the ERA-20C reanalysis) with respect to CPC-
tion is found over the Guinea coast, with MB values of more         T2m observations, calculated over the subdomains presented
than −43.22 and −46.61 mm for JJAS 2003 and JJAS 2004,              in Fig. 1, during JJAS 2003 and JJAS 2004.
respectively (Table 2).
   Figure 12 (bottom row) is similar to Fig. 2 (bottom row)         3.2.1    Maximum value of the daily maximum
but displays changes in the R95pTOT index. Both dry and                      temperature (TXx)
wet experiments lead to an R95pTOT index increase over
                                                                    In this section, we analyze the TXx, which gives the hottest
the orographic regions. Therefore, the soil moisture initial
                                                                    day’s temperature during JJAS 2003 and JJAS 2004. Fig-
conditions, whether they are dry or wet extremes, reinforce
                                                                    ure 14 (top row) shows the TXx (in ◦ C) from the CPC-T2m
the occurrence of extreme floods events.
                                                                    observations (Fig. 14a, c) for JJAS 2003 and JJAS 2004 and
   Figure 13 is the same as Fig. 3 but shows the PDF distri-
                                                                    from the mean control experiments (Fig. 14b, d). The CPC-
bution of changes in the R95pTOT. The highest R95pTOT
                                                                    T2m observations show that the highest TXx values (more
increase is found over the West Sahel and Guinea coast with
                                                                    than 46 ◦ C) are found over the Sahara, whereas the lowest
maximum change values of around 4.03 and 4.33 mm for
                                                                    TXx index values (less than 32 ◦ C) are found over the Guinea
JJAS 2003 and JJAS 2004, respectively (Table 3).
                                                                    coast (Fig. 14a, d).
   In summary, RegCM4 underestimates R95pTOT, and the
                                                                       The control experiments (Fig. 14c, f) reasonably replicate
soil moisture initial conditions, either dry or wet, increase the
                                                                    the large-scale patterns of the TXx values, with PCC values
precipitation percent due to very heavy precipitation days.
                                                                    of up to 0.99 (Table 3) over the entire West Africa domain;
This result is consistent with the work of Liu et al. (2014)
                                                                    however, they exhibit some biases at the local scale. The con-
over Asia using RegCM4.
                                                                    trol experiments are closer to the maximum and minimum

Hydrol. Earth Syst. Sci., 26, 731–754, 2022                                           https://doi.org/10.5194/hess-26-731-2022
B. Koné et al.: Influence of initial soil moisture in a regional climate model study over West Africa – Part 2 743
Figure 11. Same as Fig. 3 but for the RX1day index (in mm).
Table 4. The pattern correlation coefficient (PCC) and the mean bias (MB, in ◦ C) of the TXx, TXn, TNn and TNx indices for the control
experiments (initialized with initial soil moisture from the ERA-20C reanalysis) with respect to CPC-T2m, calculated for the Guinea coast,
Central Sahel, West Sahel and entire West Africa domain for JJAS 2003 and JJAS 2004.
Temperature Central Sahel West Sahel Guinea coast West Africa
indices MB PCC MB PCC MB PCC MB PCC
TXx (◦ C) CTRL_2003 2.10 0.99 3.02 0.99 −1.34 0.99 0.32 0.99
CTRL_2004 1.14 0.99 2.02 0.99 −1.41 0.99 −0.16 0.99
TXn (◦ C) CTRL_2003 5.12 0.99 6.56 0.99 3.76 0.99 5.65 0.99
CTRL_2004 3.43 0.99 5.44 0.99 2.75 0.99 4.14 0.99
TNn (◦ C) CTRL_2003 2.37 0.99 3.30 0.99 1.53 0.99 1.45 0.99
CTRL_2004 2.09 0.99 2.55 0.99 1.28 0.99 0.71 0.99
TNx (◦ C) CTRL_2003 −1.91 0.99 −2.86 0.99 −3.35 0.99 −3.85 0.99
CTRL_2004 −1.90 0.99 −2.54 0.99 −3.32 0.99 −3.99 0.99
values displayed in the CPC-T2m observations. The control 2.02 ◦ C for JJAS 2003 and JJAS 2004, respectively (Table 4).
simulations overestimate the TXx values over the Central and However, the biases obtained for TXx are much lower than
West Sahel, and they underestimate the TXx values over the those reported by Thanh et al. (2017), who used RegCM4
Guinea coast (Table 4). The greatest overestimation is found over Asia and found biases of up to 8 ◦ C.
over the West Sahel, with MB values of around 3.02 and
https://doi.org/10.5194/hess-26-731-2022 Hydrol. Earth Syst. Sci., 26, 731–754, 2022744 B. Koné et al.: Influence of initial soil moisture in a regional climate model study over West Africa – Part 2 Figure 12. Same as Fig. 2 but for the R95pTOT index (in mm). Figure 13. Same as Fig. 3 but for theR95pTOT index (in mm). Hydrol. Earth Syst. Sci., 26, 731–754, 2022 https://doi.org/10.5194/hess-26-731-2022
B. Koné et al.: Influence of initial soil moisture in a regional climate model study over West Africa – Part 2                    745

Figure 14. The mean maximum value of the daily maximum temperature (TXx index, in ◦ C) from CPC-T2m observations (a, c) for
JJAS 2003 and JJAS 2004 and from the simulated control (CTRL) experiments (b, d) initialized with the initial soil moisture of the ERA-
20C reanalysis (top row), and changes in the TXx index (in ◦ C; bottom row) for JJAS 2003 and JJAS 2004 from dry (e, g) and wet (f, h)
experiments with respect to the control experiments. Areas with values passing the 95 % significance test are dotted.

Table 5. Summary of the maximum values of change in PDFs for the TXx, TXn, TNn and TNx indices. Values in bold indicate regions with
the largest changes in maximum values for the dry and wet experiments.

               Temperature             Central Sahel          West Sahel           Guinea coast           West Africa
               indices                1WC       1DC         1WC       1DC         1WC       1DC         1WC       1DC
               TXx (◦ C)      2003    −2.54      1.14       −2.11      0.90       −0.34      0.68       −0.89      1.06
                              2004    –2.57      1.69       −1.58      0.98       −0.32      1.01       −0.86      1.27
               TXn (◦ C)      2003    −1.37      0.81       –1.67    −0.05        −0.06      0.28       −0.50      0.59
                              2004    −1.09      1.03       −0.93     0.55        −0.04      0.31       −0.38      0.61
               TNn (◦ C)      2003    −0.37    −0.20        −0.23    –1.15          0.05    0.04        −0.20     0.03
                              2004    −0.03    −0.37         0.06    −1.07          0.11   −0.03        −0.05    −0.11
               TNx (◦ C)      2003    −1.29      0.25       −0.94    −1.37          0.12     0.04       −0.49     0.13
                              2004    –1.67      0.15       −0.62    −1.13          0.02     0.03       −0.51    −0.07

   Figure 14 (bottom row) displays changes in TXx for                 tively) derived from dry and wet experiments compared with
JJAS 2003 and JJAS 2004 in dry (Fig. 14g, i) and wet exper-           the control experiments are shown. Table 5 summarizes the
iments (Fig. 14h, j) with respect to the control experiments;         maximum values of changes obtained in the PDFs of TXx.
the dotted area shows changes with a statistical significance         The strongest decrease (increase) in the TXx index is found
of 95 %. Dry experiments lead to an increase in TXx values,           over the Central Sahel, with a maximum change of around
whereas the wet experiments decrease them.                            −2.57 ◦ C (more than 1.69 ◦ C) in wet (dry) experiments in
   The PDF distributions of TXx changes for JJAS 2003                 JJAS 2004.
and JJAS 2004 over the Central Sahel, West Sahel, Guinea                 In summary, during JJAS 2003 and JJAS 2004, the
coast and West Africa domains (Fig. 15a, b, c and d, respec-          RegCM4 model overestimates and underestimates the hottest

https://doi.org/10.5194/hess-26-731-2022                                              Hydrol. Earth Syst. Sci., 26, 731–754, 2022
746 B. Koné et al.: Influence of initial soil moisture in a regional climate model study over West Africa – Part 2
Figure 15. PDF distributions (%) of changes in the maximum value of the daily maximum temperature (TXx index, in ◦ C) for JJAS 2003
and JJAS 2004 over the (a) Central Sahel, (b) West Sahel, (c) Guinea coast and (d) West Africa derived from dry (1DC) and wet (1WC)
experiments compared with the control experiment.
day’s temperature over the Sahel and Guinea coast, respec- (Table 4). The TXn biases in our study are lower than those
tively. Dry experiments result in an increase in TXx, whereas obtained by Thanh et al. (2017) in their work over Asia using
wet experiments lead to a decrease in TXx values. RegCM4. As in Fig. 14 (bottom row), Fig. 16 (bottom row)
displays changes in the TXn index. Dry experiments increase
3.2.2 Minimum value of the daily maximum TXn index values, whereas wet experiments decrease them.
temperature (TXn) Figure 17 is similar to Fig. 15 but displays the PDF distri-
bution of changes in TXn. The impact on the TXn is rather
In this section, we investigate the TXn index, which gives the weak compared with the TXx. The strongest increase in the
coolest day’s temperature during JJAS 2003 and JJAS 2004. TXn index is found over the Central Sahel, reaching 1.03 ◦ C
Figure 16 (top row) is the same as Fig. 14 (top row) but in dry experiments during JJAS 2004 (Table 5), whereas the
presents the spatial distribution of the TXn index. The CPC- strongest decrease is found over the West Sahel, reaching
T2m observations display maxima (greater than 36 ◦ C) and about −1.67 ◦ C in wet experiments during JJAS 2004 (Ta-
minima (less than 24 ◦ C) of TXn over the Sahara and the ble 5).
Guinea coast, respectively (Fig. 16a, c). In summary, RegCM4 overestimates the coolest day’s
The control experiments (Fig. 16b, d) show good agree- temperature during JJAS 2003 and JJAS 2004 over the whole
ment with the CPC-T2m datasets with respect to the large- West Africa domain. As for the TXx index, dry (wet) exper-
scale patterns, with PCC values of approximately 0.99; how- iments increase (decrease) the TXn values.
ever, the magnitude of the TXn index over most of the study
domain is overestimated. The strongest positive bias was ob-
served over the West Sahel domain, with MB values of about
6.56 and 5.44 ◦ C for JJAS 2003 and JJAS 2004, respectively
Hydrol. Earth Syst. Sci., 26, 731–754, 2022 https://doi.org/10.5194/hess-26-731-2022B. Koné et al.: Influence of initial soil moisture in a regional climate model study over West Africa – Part 2 747 Figure 16. Same as Fig. 14 but for the TXn index. Figure 17. Same as Fig. 15 but for the TXn index. https://doi.org/10.5194/hess-26-731-2022 Hydrol. Earth Syst. Sci., 26, 731–754, 2022
748           B. Koné et al.: Influence of initial soil moisture in a regional climate model study over West Africa – Part 2

Figure 18. Same as Fig. 14 but for the TNn index.

3.2.3   Minimum value of the daily minimum                                Figure 18 (bottom row) is the same as Fig. 14 (bottom row)
        temperature (TNn index)                                        but displays changes in the TNn. Over the Central and West
                                                                       Sahel, both dry and wet experiments decrease the TNn val-
In this section, we examine the TNn index, which gives the             ues; conversely, over the Guinea coast, they increase the TNn
lowest temperature at night during JJAS 2003 and JJAS 2004.            values.
Figure 18 (top row) is the same as Fig. 14 (top row) but dis-             Figure 19 is the same as Fig. 15 but shows the PDF dis-
plays the spatial distribution of the TNn index. The CPC-              tribution of changes in the TNn. Wet (dry) experiments in-
T2m observations (Fig. 18a, c) show TNn maxima with val-               crease (decrease) the TNn values, especially over the Cen-
ues not exceeding 27 ◦ C (above 15◦ N latitude), whereas the           tral Sahel. Table 5 shows that the strongest increase in the
minima values (less than 17 ◦ C) are found over the mountain-          TNn index in wet experiments is found over Guinea coast,
ous regions such as the Cameroon Mountains, Jos Plateau                with a maximum change of around 0.11 ◦ C in JJAS 2004,
and Guinea Highlands.                                                  whereas the strongest decrease in the TNn is found in dry ex-
   The control experiments (Fig. 18b, d) show good agree-              periments over the West Sahel, with a maximum change of
ment with CPC-T2m observations, with PCC values of ap-                 around −1.15 ◦ C in JJAS 2003.
proximately 0.99; however, they exhibit some biases at the                In summary, RegCM4 overestimates the lowest tempera-
local scale. The control experiments overestimate the magni-           ture at night during JJAS 2003 and JJAS 2004. Wet (dry) ex-
tude of the TNn index over most of the study domains.                  periments lead to an increase (a decrease) in the TNn index.
   The strongest positive biases are found over the West Sa-
hel, with MB values reaching 3.30 and 2.55 ◦ C for JJAS 2003           3.2.4   Maximum value of the daily minimum
and JJAS 2004, respectively (Table 4). These positive biases                   temperature (TNx)
obtained for the TXx, TXn and TNn indices are the inverse
of the cold bias known from RegCM4 in mean climate simu-               In this section, the TNx index, which gives the warmest night
lations (Koné et al., 2018; Klutse et al., 2016). It is difficult to   temperature during JJAS 2003 and JJAS 2004, is analyzed.
determine the origin of RegCM4 temperature biases, as they             Figure 20 (top row) is the same as Fig. 14 (top row) but
can depend on several factors, such as surface energy fluxes           for the TNx index. The CPC-T2m observations (Fig. 20a, c)
and water, cloudiness, and surface albedo (Sylla et al., 2012;         show the maxima of the TNx index over the Sahara, with val-
Tadross et al., 2006).                                                 ues reaching 40 ◦ C, whereas the minima (around 24 ◦ C) are
                                                                       located over the Guinea coast.

Hydrol. Earth Syst. Sci., 26, 731–754, 2022                                             https://doi.org/10.5194/hess-26-731-2022
B. Koné et al.: Influence of initial soil moisture in a regional climate model study over West Africa – Part 2 749 Figure 19. Same as Fig. 14 but for the TNn index. Figure 20. Same as Fig. 14 but for the TNx index. https://doi.org/10.5194/hess-26-731-2022 Hydrol. Earth Syst. Sci., 26, 731–754, 2022
750          B. Koné et al.: Influence of initial soil moisture in a regional climate model study over West Africa – Part 2

Figure 21. Same as Fig. 15 but for the TNx index.

   The control experiments (Fig. 20b, d) reproduced the gen-    increase (decrease) is found over the Central Sahel in dry
eral features of the TNx index well, with PCC value of          (wet) experiments with maximum changes of up to 0.25
up to 0.99; however, some differences exist at the local        (−1.67 ◦ C) for JJAS 2003 (JJAS 2004) (Table 5). In sum-
scale. Unlike the TNn index, the control experiments un-        mary, RegCM4 underestimates the warmest night tempera-
derestimate the TNx over most of the study domain. The          ture, and dry (wet) experiments lead to an increase (decrease)
strongest negative biases are found over the Central Sahel,     in TNx magnitude.
with MB values of up to −3.35 and −3.32 ◦ C for JJAS 2003
and JJAS 2004, respectively (Table 4). The TNx index un-
derestimation seems to be systematically related to the cold    4   Conclusions
bias in RegCM4 over West Africa, which has been reported
in several papers (Koné et al., 2018; Klutse et al., 2016).     The impact of the soil moisture initial conditions on six pre-
   Figure 20 (bottom row) is the same as Fig. 14 (bottom row)   cipitation extreme indices and four temperature extreme in-
but displays changes in the TNx. As for the TNn index, dry      dices over West Africa was investigated using RegCM4–
experiments increase the TNx values over the Central Sahel,     CLM45. We first evaluated the performance of RegCM4–
whereas the wet experiments decrease them. However, both        CLM4.5 with respect to representing these climate extreme
wet and dry experiments led to a dominant decrease over the     indices over West Africa. We then performed sensitivity stud-
West Sahel. Conversely, although the signal is weak, both       ies over the West Africa domain, with a spatial resolution
dry and wet experiments led to a dominant increase over the     of 25 km. We initialized the control runs using soil moisture
Guinea coast.                                                   from the ERA-20C reanalysis, and we initialized dry and wet
   Figure 21 is the same as Fig. 15 but displays the PDF        experiments using the respective maximum and minimum
distributions of the changes in the TNx. The highest TNx        values from ERA-20C over the whole domain. Results are
                                                                presented for JJAS 2003 and JJAS 2004, which are two con-

Hydrol. Earth Syst. Sci., 26, 731–754, 2022                                       https://doi.org/10.5194/hess-26-731-2022
B. Koné et al.: Influence of initial soil moisture in a regional climate model study over West Africa – Part 2 751
trasting runs that were the most sensitive to the effects of dry Code availability. The RegCM4.7 model is freely available for
and wet soil moisture initial conditions. public use at https://github.com/ICTP/RegCM/releases/tag/4.7.1
Compared with CHIRPS observations, the model overesti- (Giuliani, 2021). The NCL language was used for the com-
mates and underestimates the number of wet days. RegCM4 putations and the plots, and the source can be found at
also underestimates the simple daily precipitation intensity https://doi.org/10.5065/D6WD3XH5 (NCAR, 2019).
index (SDII), the maximum 1 d precipitation (Rx1day) and
the precipitation percentage due to very heavy precipita-
Data availability. The validation of simulated precipitation was
tion days (R95pTOT). The current physical parameterization
done using the high-resolution 0.05◦ Climate Hazards Group
scheme of the RegCM4 model used in our study results in
InfraRed Precipitation with Station (CHIRPS) dataset, devel-
a positive bias of the number of wet days with a low pre- oped at the University of California at Santa Barbara, for
cipitation threshold (e.g., 1 mm d−1 ) as well as in a negative the period from 1981 to 2020 (Funk et al., 2015). The
bias for a higher precipitation threshold (e.g., 10 mm d−1 ; not CHIRPS dataset is available at https://data.chc.ucsb.edu/products/
shown here). RegCM4 generally overestimates the CWD and CHIRPS-2.0/global_daily/netcdf/p05/ (Funk et al., 2014).
CDD indices over West Africa. Most of the temperature ex- We validated the 2 m temperature using the National Oceanic
treme indices used in this study (TXx, TXn and TNn) are and Atmospheric Administration (NOAA) Climate Prediction Cen-
also overestimated, except for the TNx index, which is un- ter (CPC) daily maximum and minimum global surface air
derestimated over the West Africa domain. temperature: https://downloads.psl.noaa.gov/Datasets/cpc_global_
The impact of the soil moisture initial conditions on ex- temp/ (Pan et al., 2019).
treme precipitation indices is only linear over the Central
Sahel for indices related to the number of precipitation
Competing interests. The contact author has declared that neither
events (the R1mm, CDD and CWD indices), meaning that
they nor their co-authors have any competing interests.
wet (dry) experiments lead to an increase (decrease) in the
number of days; however, for indices related to the amount or
intensity of precipitation (the SDII, RX1day and R95pTOT Author contributions. BK and ADie fixed the analysis framework.
indices), no linear relation is found. Nevertheless, the dry and BK carried out all of the simulations and produced the figures
wet experiments increase the precipitation percentage due to according to the outline proposed by ADie. BK, ADie, SA and
very heavy precipitation days and the maximum 1 d precipi- ADia worked on the analyses. All authors contributed to drafting
tation accumulation (the R95pTOT and RX1day indices, re- this paper.
spectively) over most of the study domain.
The soil moisture initial conditions unequally influence the
daily maximum and minimum temperatures over the West Disclaimer. Publisher’s note: Copernicus Publications remains
Africa domain: the impact on daily maximum temperature neutral with regard to jurisdictional claims in published maps and
extremes are greater than those on the daily minimum tem- institutional affiliations.
perature extremes. These results are consistent with previous
studies (Jaeger and Seneviratne, 2011; Zhang et al., 2009).
The wet (dry) experiments lead to TXx and TXn increases Acknowledgements. The research leading to this publication is co-
(decreases) over West Africa. However, regarding the min- funded by the NERC/DFID “Future Climate for Africa” program
under the AMMA-2050 project (grant no. NE/M019969/1) and by
imum temperature, we showed that dry (wet) experiments
the Institut de Recherche pour le Développement (IRD), France
lead to a TNx increase (decrease).
(UMR IGE Imputation, grant no. 252RA5).
This study helped to quantify the impact of the soil mois-
ture initial conditions on precipitation and temperature ex-
treme events in terms of intensity, frequency and duration Financial support. This research has been supported by the
over West Africa. This study is the first to investigate the im- NERC/DFID “Future Climate for Africa” program under the
pact of soil moisture initial conditions on climate extreme in- AMMA-2050 project (grant no. NE/M019969/1) and the Institut de
dices in this region. These experiments were done in a highly Recherche pour le Développement (IRD), France (UMR IGE Im-
idealized framework and were intended to show the poten- putation, grant no. 252RA5).
tial impact of very strong soil moisture initial conditions on
climate extremes. Consequently, this work should be consid-
ered as a first overview of the influence of initial soil moisture Review statement. This paper was edited by Shraddhanand Shukla
on climate extremes using an RCM (RegCM4). This study and reviewed by three anonymous referees.
will benefit from being performed in a multi-model frame-
work with several RCMs within the CORDEX-Africa initia-
tive (Coordinated Regional Downscaling Experiment).
https://doi.org/10.5194/hess-26-731-2022 Hydrol. Earth Syst. Sci., 26, 731–754, 2022752 B. Koné et al.: Influence of initial soil moisture in a regional climate model study over West Africa – Part 2
References Giuliani, G.: The Regional Climate Model version 4.7.1 source
code, ICTP [code], https://github.com/ICTP/RegCM/releases/
tag/4.7.1 (last access: 7 February 2022), 2021.
Bichet, A. and Diedhiou, A.: West African Sahel has become wet- Grell, G., Dudhia, J., and Stauffer, D. R.: A description
ter during the last 30 years, but dry spells are shorter and more of the fifth generation Penn State/NCAR Mesoscale
frequent, Clim. Res., 75, 155–162, 2018a. Model (MM5), National Center for Atmospheric Research
Bichet, A. and Diedhiou, A.: Less frequent and more intense rain- Tech Note NCAR/TN-398+STR, NCAR, Boulder, CO,
fall along the coast of the Gulf of Guinea in West and Central https://doi.org/10.5065/D60Z716B, 1994.
Africa (1981–2014), Clim. Res., 76, 191–201, 2018b. Holtslag, A., De Bruijn, E., and Pan, H. L.: A high resolution air
Damien, D., Chung, C. E., Ekman, A. M. L., and mass transformation model for short-range weather forecasting,
Brandefelt, J.: Which significance test performs the Mon. Weather Rev., 118, 1561–1575, 1990.
best in climate simulations?, Tellus A, 66, 23139, IPCC: Climate Change 2007: The Physical Science Basis, in: Con-
https://doi.org/10.3402/tellusa.v66.23139, 2014. tribution of Working Group I to the Fourth Assessment Report
Danielson, J. J. and Gesch, D. B.: Global multi-resolution of the Intergovernmental Panel on Climate Change, edited by:
terrain elevation data 2010 (GMTED2010), US Ge- Solomon, S., Qin, D., Manning, M., Chen, Z., Marquis, M., Av-
ological Survey Open-File Report 2011-1073, p. 26, eryt, K. B., Tignor, M., and Miller, H. L., Cambridge University
https://doi.org/10.3133/ofr20111073, 2011. Press, Cambridge, UK., 996 pp., https://www.ipcc.ch/report/ar4/
Diaconescu, E. P., Gachon, P., Scinocca, J., and Laprise, R.: Eval- wg1/ (last access: 7 February 2022), 2007.
uation of daily precipitation statistics and monsoon onset/retreat IPCC: Climate Change 2013: The Physical Science Basis, in: Con-
over West Sahel in multiple data sets, Clim. Dynam., 45, 1325– tribution of Working Group I to the Fifth Assessment Report
1354, https://doi.org/10.1007/s00382-014-2383-2, 2015. of the Intergovernmental Panel on Climate Change, edited by:
Didi Sacré Regis, M , Mouhamed, L., Kouakou, K., Adeline, B., Stocker, T. F., Qin, D., Plattner, G.-K., Tignor, M., Allen, S. K.,
Arona, D., Koffi Claude, A. K., Talnan, J. H. C., Salomon, O., Boschung, J., Nauels, A., Xia, Y., Bex, V., and Midgley, P. M.,
and Issiaka, S.: Using the CHIRPS Dataset to Investigate Histor- Cambridge University Press, Cambridge, UK and New York, NY,
ical Changes in Precipitation Extremes in West Africa, Climate, USA, 1535 pp., http://www.ipcc.ch/report/ar5/wg1/ (last access:
8, 84, https://doi.org/10.3390/cli8070084, 2020. 7 February 2022), 2013.
Easterling, D. R., Meehl, G. A., Parmesan, C., Changnon, S. Jaeger, E. B., and Seneviratne, S. I.: Impact of soil moisture–
A., Karl, T. R., and Mearns, L. O.: Climate Extremes: Ob- atmosphere coupling on European climate extremes and trends
servations, Modeling and Impacts, Science, 289, 2068–2074, in a regional climate model, Clim. Dynam., 36, 1919–1939,
https://doi.org/10.1126/science.289.5487.2068, 2000. https://doi.org/10.1007/s00382-010-0780-8, 2011.
Emanuel, K. A.: A scheme for representing cumulus convection in Kiehl, J. T., Hack, J. J., Bonan, G. B., Boville, B. A., Briegleb,
large-scale models, J. Atmos. Sci., 48, 2313–2335, 1991. B. P., Williamson, D. L., and Rasch, P. J.: Description of
Fan, Y. and van den Dool, H.: A global monthly land surface air the NCAR Community Climate Model (CCM3), Technical
temperature analysis for 1948–present, J. Geophys. Res., 113, Note NCAR/TN−420+STR, University Corporation for Atmo-
D01103, https://doi.org/10.1029/2007JD008470, 2008. spheric Research, 152 pp., https://doi.org/10.5065/D6FF3Q99,
Folland, C. K., Palmer, T. N. , and Parker, D. E.: Sahel rainfall and 1996.
worldwide sea temperatures, Nature, 320, 602–607, 1986. Klutse, B. A. N., Sylla, B. M., Diallo, I., Sarr, A., Dosio, A.,
Fontaine, B. and Janicot, S.: Sea Surface Temper- Diedhiou, A., Kamga, A., Lamptey, B., Ali, A., Gbobaniyi, E.
ature Fields Associated with West African Rain- O., Owusu, K., Lennard, C., Hewitson, B., Nikulin, G., Panitz,
fall Anomaly Types, J. Climate, 9, 2935–2940, H.-J., and Büchner, M.: Daily characteristics of West African
https://doi.org/10.1175/15200442(1996)009$$, summer monsoon precipitation in CORDEX simulations, Theor.
1996. Appl. Climatol., 123, 369–386, https://doi.org/10.1007/s00704-
Funk, C. C., Peterson, P. J., Landsfeld, M. F., Pedreros, D. 014-1352-3, 2016.
H., Verdin, J. P., Rowland, J. D., Romero, B. E., Husak, Koné, B., Diedhiou, A., N’datchoh, E. T., Sylla, M. B., Giorgi, F.,
G. J., Michaelsen, J. C., and Verdin, A. P.: A quasi-global Anquetin, S., Bamba, A., Diawara, A., and Kobea, A. T.: Sen-
precipitation time series for drought monitoring, US Ge- sitivity study of the regional climate model RegCM4 to differ-
ological Survey Data Series 832, US Geological Survey ent convective schemes over West Africa, Earth Syst. Dynam., 9,
[data set], p. 4, https://data.chc.ucsb.edu/products/CHIRPS-2.0/ 1261–1278, https://doi.org/10.5194/esd-9-1261-2018, 2018.
global_daily/netcdf/p05/ (last access: 7 February 2022), 2014. Koné, B., Diedhiou, A., Diawara, A., Anquetin, S., Touré, N. E.,
Gao, X.-J., Shi, Y., and Giorgi, F.: Comparison of convective pa- Bamba, A., and Kobea, A. T.: Influence of initial soil moisture
rameterizations in RegCM4 experiments over China with CLM in a regional climate model study over West Africa – Part 1: Im-
as the land surface model, Atmos. Ocean. Sci. Lett., 9, 246–254, pact on the climate mean, Hydrol. Earth Syst. Sci., 26, 711–730,
https://doi.org/10.1080/16742834.2016.1172938, 2016. https://doi.org/10.5194/hess-26-711-2022, 2022.
Giorgi, F., Coppola, E., Solmon, F., Mariotti, L., Sylla, M. B., Bi, Koster, R. D., Guo, Z. H., Dirmeyer, P. A., Bonan, G., Chan, E.,
X., Elguindi, N., Diro, G. T., Nair, V., Giuliani, G., Cozzini, S., Cox, P., Davies, H., Gordon, C. T., Gordon, C. T., Lawrence,
Guettler, I., O’Brien, T., Tawfik, A., Shalaby, A., Zakey, A. S., D., Liu, P., Lu, C. H., Malyshev, S., McAvaney, B., Mitchell, K.,
Steiner, A., Stordal, F., Sloan, L., and Brankovic, C.: RegCM4: Mocko, D., Oki, K., Oleson, K., Pitman, A., Sud, Y. C., Taylor, C.
model description and preliminary tests over multiple CORDEX M., Verseghy, D., Vasic, R., Xue, Y., and Yamada, T.: The global
domains, Clim. Res., 52, 7–29, https://doi.org/10.3354/cr01018, land–atmosphere coupling experiment. Part I: Overview, J.
2012.
Hydrol. Earth Syst. Sci., 26, 731–754, 2022 https://doi.org/10.5194/hess-26-731-2022You can also read