Integrative genomic analysis of a novel small nucleolar RNAs prognostic signature in patients with acute myelocytic leukemia
←
→
Page content transcription
If your browser does not render page correctly, please read the page content below
MBE, 19(3): 2424–2452.
                                                                      DOI: 10.3934/mbe.2022112
                                                                      Received: 10 September 2021
                                                                      Revised: 24 October 2021
                                                                      Accepted: 11 November 2021
                                                                      Published: 07 January 2022
http://www.aimspress.com/journal/MBE

Research article

Integrative genomic analysis of a novel small nucleolar RNAs
prognostic signature in patients with acute myelocytic leukemia

Rui Huang1, Xiwen Liao2 and Qiaochuan Li1,*

1
    Department of Hematology, The First Affiliated Hospital of Guangxi Medical University, Nanning
    530021, China
2
    Department of Hepatobiliary Surgery, The First Affiliated Hospital of Guangxi Medical
    University, Nanning 530021, China

* Correspondence: Email: liqiaochuan@sohu.com; Tel: +867715356746; Fax: +867715352681.

Abstract: This study mainly used The Cancer Genome Atlas (TCGA) RNA sequencing dataset to
screen prognostic snoRNAs of acute myeloid leukemia (AML), and used for the construction of
prognostic snoRNAs signature for AML. A total of 130 AML patients with RNA sequencing dataset
were used for prognostic snoRNAs screenning. SnoRNAs co-expressed genes and differentially
expressed genes (DEGs) were used for functional annotation, as well as gene set enrichment analysis
(GSEA). Connectivity Map (CMap) also used for potential targeted drugs screening. Through
genome-wide screening, we identified 30 snoRNAs that were significantly associated with the
prognosis of AML. Then we used the step function to screen a prognostic signature composed of 14
snoRNAs (SNORD72, SNORD38, U3, SNORA73B, SNORD79, SNORA73, SNORD12B,
SNORA74, SNORD116-12, SNORA65, SNORA14, snoU13, SNORA75, SNORA31), which can
significantly divide AML patients into high- and low-risk groups. Through GSEA, snoRNAs
co-expressed genes and DEGs functional enrichment analysis, we screened a large number of
potential functional mechanisms of this prognostic signature in AML, such as phosphatidylinositol
3-kinase-Akt, Wnt, epithelial to mesenchymal transition, T cell receptors, NF-kappa B, mTOR and
other classic cancer-related signaling pathways. In the subsequent targeted drug screening using
CMap, we also identified six drugs that can be used for AML targeted therapy, they were
alimemazine, MG-262, fluoxetine, quipazine, naltrexone and oxybenzone. In conclusion, our current
study was constructed an AML prognostic signature based on the 14 prognostic snoRNAs, which
may serve as a novel prognostic biomarker for AML.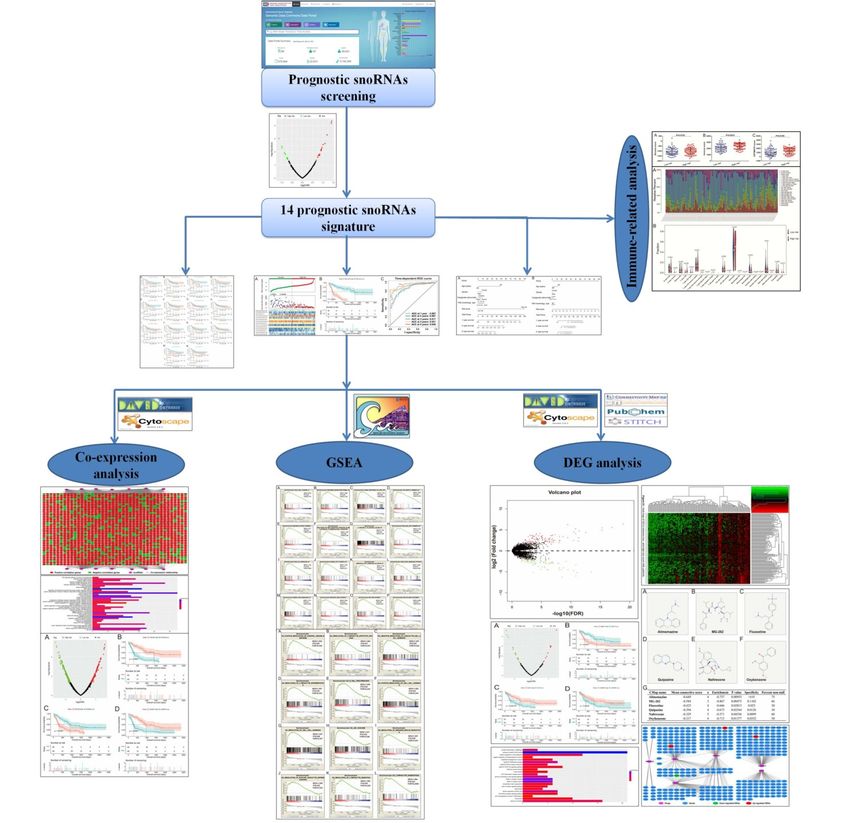
2425

Keywords: small nucleolar RNA; RNA sequencing; acute myeloid leukemia; the cancer genome
atlas; prognostic signature

1.   Introduction

      As a clonal malignant disease of hematopoietic system, acute myeloid leukemia (AML) is a
group of diseases with high heterogeneity [1,2]. In recent years, with the development of
immunology, cytogenetics and molecular biology, the biological characteristics of AML tumor cells
have been more deeply understood and laid a foundation for the precise classification, diagnosis,
prognosis and selection of the best treatment for AML [3–6]. Epidemiological studies have shown that
environmental, occupational and genetic factors are closely related to the incidence of AML [7,8]. Small
nucleolar RNA (snoRNA) is also a class of non-coding RNA, with a length of 60-30nt. As early
studies found that snoRNA was mainly located in the nucleoli and was related to the processing and
modification of rRNA, its function was relatively simple [9–11]. However, in recent years, more and
more RNA sequencing (RNA-seq) dataset show that snoRNA shows a general trend of high
expression in tumors, and some studies show that snoRNA is involved in the occurrence, progression
and prognosis of tumors, and may be a kinds of new clinical biomarkers [12–14]. Gong et al.
organized The Cancer Genome Atlas (TCGA) pan-cancer RNA-seq datasets and turned the analyzed
snoRNA datasets into a visual webpage for researchers to analyze the relationship between snoRNAs
and cancers [15]. Through literature search, we have not found any related research on the
relationship between snoRNAs and AML prognosis. To fill in this research gap, we extracted the
snoRNA dataset from the RNA-seq dataset of TCGA AML cohort, and used to screen for the
prognostic snoRNAs of AML, and explored their related molecular mechanisms. This study mainly
used TCGA RNA sequencing dataset to screen prognostic snoRNAs of AML, and used for the
construction of prognostic signature for AML.

2.   Materials and methods

2.1. Data acquisition and processing

     Level 3 RNA-seq dataset was downloaded from TCGA website (https://portal.gdc.cancer.gov),
and the corresponding clinical parameters were obtained from University of California, Santa Cruz
(UCSC) Xena (http://xena.ucsc.edu) [16]. Inclusion criteria for this study were that AML patients
with complete prognostic parameters and RNA sequencing data sets would be included in the
follow-up prognostic analysis of this study, otherwise they will be excluded. The raw RNA-seq
dataset was normalized with edgeR [17]. SnoRNA is included in the RNA-seq dataset. We download
genome annotation files from the Ensembl website (http://asia.ensembl.org/index.html) to annotate
the genes and snoRNAs in the RNA-seq matrix. Then separate the snoRNAs from the RNA-seq
matrix according to the annotated file. Prognostic snoRNAs were identified by the multivariate Cox
proportional hazards regression model using the survival package in the R platform. Then we used
step function and Cox model to screen the optimal prognostic signature in R platform. The
calculation formula of prognostic signature is as follows: risk score = ExpsnoRNA1 × βsnoRNA1 +
ExpsnoRNA2 × βsnoRNA2 + … ExpsnoRNAn × βsnoRNAn (Exp: expression value) [18–20]. The

Mathematical Biosciences and Engineering                                    Volume 19, Issue 3, 2424–2452.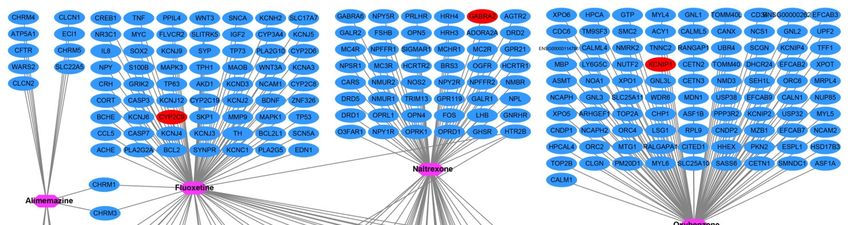
2426

time-dependent receiver operating characteristic curve is realized by the survivalROC package in the
R platform. The nomogram was implemented by the rms package of R platform. Since all datasets of
gastric cancer included in the present study were downloaded from open access public database, and
the authors were not involved in any animal or human experiments. Therefore, additional approval
by an Ethics Committee was not needed.

2.2. Functional enrichment analysis

      The co-expression genes screening of snoRNAs are realized by Cor function of R platform.
Pearson correlation coefficient |r| > 0.4 and P value < 0.05 was identified as the co-expressed genes
of snoRNA. Functional enrichment analysis was performed using Database for Annotation,
Visualization, and Integrated Discovery v6.8 (DAVID v6.8, https://david.ncifcrf.gov/home.jsp) [21].
We also used the gene set enrichment analysis (GSEA) approach to perform differential functional
enrichment analysis for AML patients between high-risk and low-risk phenotypes. Gene set database
of GSEA were used the c2 (curated gene sets: c2.all.v7.0.symbols.gmt)and c5 (gene ontology gene
sets: c5.all.v7.0.symbols.gmt) gene set, which were downloaded from the molecular signatures
database [22–25]. GSEA results of | normalized enrichment score (NES)| > 1, P value < 0.05 and
false discovery rate (FDR) < 0.25 were considered to be statistically significant. We then used edgeR
packages to screen differentially expressed genes (DEGs) between AML patients with high- and
low-risk phenotypes. Genes with |log2 fold change (FC)| > 2, P value < 0.05 and FDR < 0.05 were
identified as DEGs. After screening DEGs, we also use these DEGs and Connectivity Map (CMap:
https://portals.broadinstitute.org/cmap/) online analysis tools to screen potential AML targeted
therapeutic drugs [26,27]. The chemical formula of the drug is obtained from the PubChem website
(https://pubchem.ncbi.nlm.nih.gov) [28,29], and the gene-drug interaction network were obtained
from the STITCH website (http://stitch.embl.de/) [30–32]. We further used the Estimation of
STromal and Immune cells in MAlignant Tumor tissues using Expression data (ESTIMATE) method
to score the immune cells and stromal cells in the tumor microenvironment [33]. CIBERSORT was
used for immune cell infiltration analysis [34].

2.3. Statistical analysis

      The grouping of high- and low-expression groups are based on the median expression value of
each gene. In this study, FDR was calculated in strict accordance with the Benjamini-Hochberg
program [35]. Volcano plot and heat map are drawn in R platform by ggplot2 package in the R
platform (Version 3.6.2, https://www.r-project.org) and interactive network diagrams are drawn using
Cytoscape software (Version 3.6.1, https://cytoscape.org) [36,37]. P < 0.05 was considered to be
statistically significant.

3. Results

3.1. Pronostic snoRNAs screening

     The flow chart of this study is shown in Figure 1. There were 130 AML patients of TCGA
cohort were included into our current study, the clinical parameters were shown in Table 1. In the
obtained clinical parameters, we found that age and french american british (FAB) morphology type

Mathematical Biosciences and Engineering                                  Volume 19, Issue 3, 2424–2452.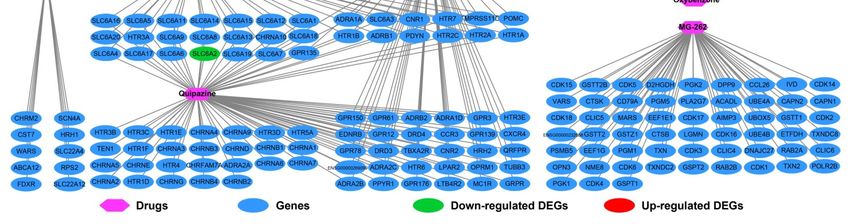
2427

were significantly related to the prognosis of AML. Subsequently, we also conducted survival
analysis based on ALP classification and found that APL patients had a better prognosis than
non-APL patients (P = 0.003, Table 1). We included these two parameters in the subsequent
multivariate Cox proportional hazard regression model for adjustment. A total of 940 snoRNAs were
derived from the RNA-seq dataset. After normalization by edgeR, we finally obtained 354 snoRNAs
with an average value greater than 1 for subsequent survival analysis. By using the survival package
of the R platform, we screened a total of 30 snoRNAs in the TCGA cohort that were significantly
related to the prognosis of AML (Figure 2 and Table S1).

                                Figure 1. Flow chart of the present study.

Mathematical Biosciences and Engineering                                     Volume 19, Issue 3, 2424–2452.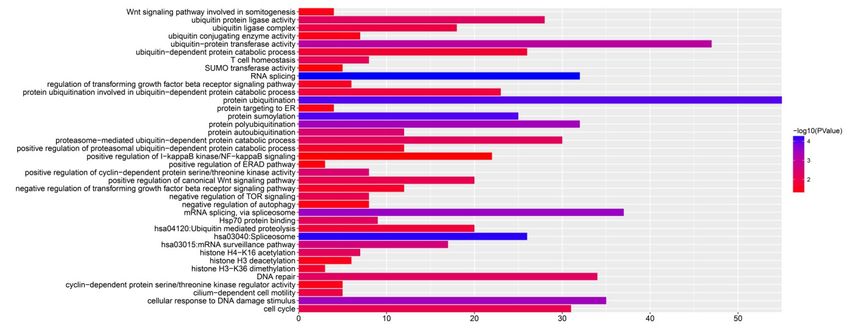
2428

                  Table 1. Clinical parameters of 130 AML patients in TCGA cohort.
Variables                                  Events/total (n =   MST      HR (95% CI)         Log-rank
                                           130)                (days)                       P
Age (years)                                                                                 < 0.0001
≤ 65                                       48/96               822      1
> 65                                       30/34               214      3.236(2.022–5.1
                                                                        80)
Gender                                                                                      0.916
Female                                     36/60               671      1
Male                                       42/70               577      0.976(0.625–1.5
                                                                        26)
Cytogenetics abnormality §                                                                  0.19
Normal                                     42/61               518      1
Complex                                    8/15                366      0.984
                                                                        (0.460–2.105)
Others                                     21/42               945      0.625(0.369–1.0
                                                                        56)
FAB morphology type                                                                         0.029
M0                                         7/12                792      1
M1                                         19/30               731      1.438(0.604–3.4
                                                                        24)
M2                                         19/32               486      1.240(0.520–2.9
                                                                        55)
M3                                         3/14                NA       0.278(0.072–1.0
                                                                        83)
M4                                         19/27               580      1.451(0.609–3.4
                                                                        58)
M5                                         8/12                214      2.027(0.728–5.6
                                                                        44)
M6 + M7                                    3/3                 304      3.361(0.851–13.
                                                                        272)
FAB morphology type (APL                                                                    0.003
classification)
APL                                        3/14                NA       1
Non-APL                                    75/116              518      4.965(1.554–15.
                                                                        867)
Risk score                                                                                  < 0.0001
Low risk                                   24/65               1706   1
High risk                                  54/65               245    6.761(3.911–11.
                                                                      687)
Notes: §Information of cytogenetics abnormality was unavailable in 12 patients.

Mathematical Biosciences and Engineering                                  Volume 19, Issue 3, 2424–2452.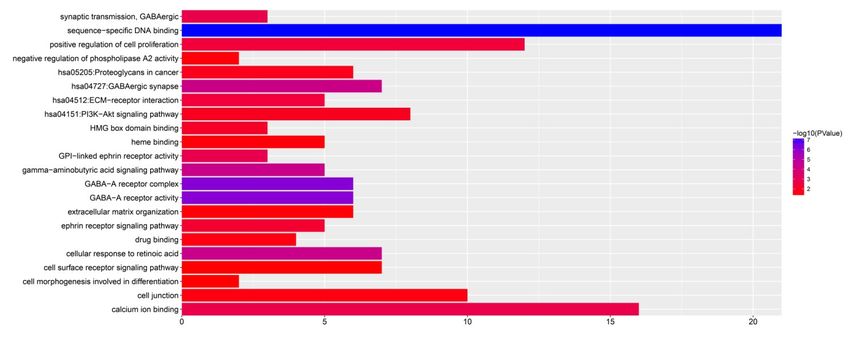
2429

                        Figure 2. Volcano plot of prognostic snoRNAs screening.

3.2. Prognostic signature and nomogram construction

     Then we used the step function in the R platform to screen the optimal prognostic signature
model, and finally screened out 14 prognostic snoRNAs combinations in the TCGA AML cohort,
which can significantly divide AML patients into high-risk and low-risk patients (Figure 3A–C,
Table 1, log-rank P < 0.0001, median survival time of low risk vs. high risk = 1706 vs. 245 days).
These 14 prognostic snoRNAs were SNORD72, SNORD38, U3, SNORA73B, SNORD79,
SNORA73, SNORD12B, SNORA74, SNORD116-12, SNORA65, SNORA14, snoU13, SNORA75,
SNORA31. The risk score model formula is as follows: risk score = ExpSNORD72 × 0.452 +
ExpSNORD38 × 0.310 + ExpU3 × (-0.203) + ExpSNORA73B × 0.527 + ExpSNORD79 × (-0.288) + ExpSNORA73
× (-0.712) + ExpSNORD12B × (-0.608) + ExpSNORA74 × 0.226 + ExpSNORD116-12 × (-0.540) + ExpSNORA65 ×
1.227 + ExpSNORA14 × 0.290 + ExpsnoU13 × 0.756 + ExpSNORA75 × 0.225 + ExpSNORA31 × (-0.282). After
correcting age and FAB morphology type in the multivariate Cox proportional hazards regression
model, we found that AML patients with high risk score had a significantly increased risk of death
than these with lower risks (adjusted P < 0.0001, adjusted hazard ratio = 5.967, 95% confidence
interval = 3.319-10.728). The time-dependent ROC curve indicated that this prognostic signature had
a high accuracy in predicting survival for AML patients [all area under the curve (AUC) were greater
than 0.8], especially the highest accuracy in predicting 5-year survival for AML patients, which the
AUC was 0.940 (Figure 3C). The kaplan-meier survival curves of the 14 snoRNAs that make up the
prognostic signature were summarized in Figure 4A–N. Then we constructed the AML prognosis
nomogram according to the risk value and phenotype of risk score, we found that the risk score
contributed the most to AML prognosis than other clinical parameters (Figure 5A,B).

Mathematical Biosciences and Engineering                                  Volume 19, Issue 3, 2424–2452.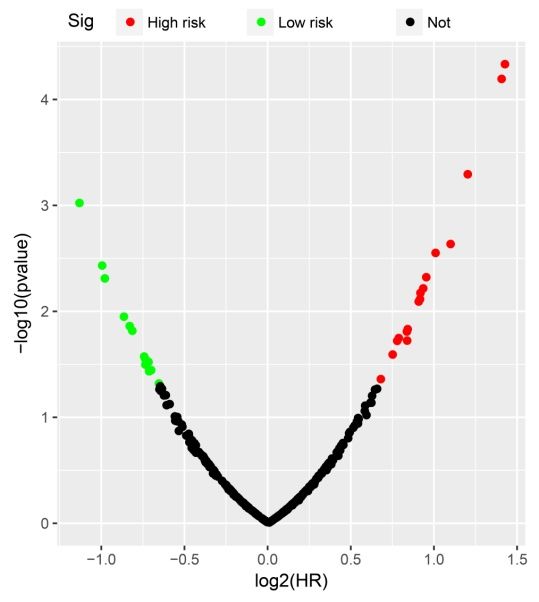
2430

      Figure 3. Prognostic signature of fourteen prognostic snoRNAs in AML overall survival.
      (A) Survival distribution plot of fourteen prognostic snoRNAs and AML; (B)
      Kaplan-Meier curve of the prognostic signature; (C) Time-dependent ROC curve of the
      prognostic signature.

Mathematical Biosciences and Engineering                                Volume 19, Issue 3, 2424–2452.
2431
Figure 4. Kaplan-Meier curve of fourteen prognostic snoRNAs in AML. (A)SNORA14;
(B) SNORA31; (C) SNORA65; (D) SNORA73; (E) SNORA73B; (F) SNORA74; (G)
SNORA75; (H) SNORA12B; (I) SNORD38; (J) SNORD72; (K) SNORD79; (L)
SNORD116-12; (M) snoU13; (N) U3.
Mathematical Biosciences and Engineering Volume 19, Issue 3, 2424–2452.2432
Figure 5. Nomogram of the risk score in AML overall survival. (A) Nomogram of low-
and high-risk score phenotypes in AML; (B) Nomogram of the risk score in AML.
3.3. Functional enrichment analysis
In order to further understand the role of this prognostic signature in AML, we used RNA-seq
dataset to screen the co-expression protein coding genes (PCGs) for snoRNAs, and then used for
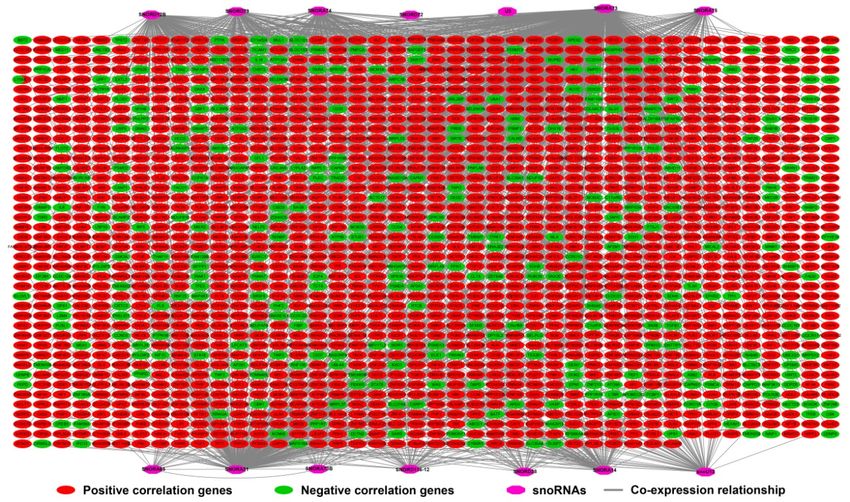
functional enrichment. Through co-expression analysis, we obtained a total of 1971 snoRNA-PCG
co-expression interaction pairs (Figure 6, Table S2). Through DAVID v6.8 functional enrichment, we
found that these snoRNAs co-expressed PCGs can be significantly enriched in protein SUMOylation,
protein ubiquitination, cellular response to DNA damage stimulus, DNA repair, positive regulation of
canonical Wnt signaling pathway, negative regulation of target of rapamycin (TOR) signaling, cell
cycle, regulation of transforming growth factor beta receptor signaling pathway, cyclin-dependent
protein serine/threonine kinase regulator activity, positive regulation of I-kappaB kinase/NF-kappaB
signaling and negative regulation of autophagy (Figure 7, Table S3). We then used the survival
package of the R platform to perform a prognosis analysis of these snoRNAs co-expressed PCGs
using a multivariate Cox proportional hazard regression model. In total, we obtained 382 snoRNAs
co-expressed PCGs that were significantly related to the prognosis of AML (Figure 8A, Table S4).
The top three genes with the most significant P values are phosphodiesterase 3B (PDE3B), branched
chain keto acid dehydrogenase kinase (BCKDK) and centromere protein C (CENPC). Kaplan-meier
survival curves of these three genes were shown in Figure 8B–D.
Mathematical Biosciences and Engineering Volume 19, Issue 3, 2424–2452.2433
Figure 6. SnoRNA-gene co-expressed interaction networks of fourteen prognostic
snoRNAs in AML.
Figure 7. Functional enrichment results of the fourteen prognostic snoRNAs co-expressed genes.
Mathematical Biosciences and Engineering Volume 19, Issue 3, 2424–2452.2434
Figure 8. Survival analysis results of the fourteen prognostic snoRNAs co-expressed
genes in AML. (A) Volcano plot of the survival results;(B) Kaplan-Meier curve of
PDE3B; (C) Kaplan-Meier curve of BCKDK; (D) Kaplan-Meier curve of CENPC.
Then we also used GSEA to enrich the differential biological functions and pathways between
high- and low-risk score phenotypes. We used c2 reference data set for pathway enrichment analysis
in GSEA, and we found that high-risk phenotypes could be significantly enriched in AML cluster 15,
metastasis model up, apoptosis via trail dn, mitogen-activated protein kinase 14 (MAPK14) targets
up, Th1/Th2 pathway, transforming growth factor (TGF) beta receptor signaling in epithelial to
mesenchymal transition (EMT), T to natural killer up, janus kinase 2 (JAK2) targets up, IL6
signaling up, tumor protein 53 (TP53) targets up, Akt1 signaling via mTOR up, vascular endothelial
growth factor A (VEGF) signaling pathway, CD40 signaling up, Rho pathway, T cell receptors (TCR)
pathway, and P38/Mikk3/6 pathway (Figure 9A–P, Table S5). While GSEA using c5 reference data
set were significantly enriched in positive regulation of humoral immune response, regulation of
lymphocyte apoptotic process, negative regulation of leukocyte cell-cell adhesion, regulation of
lymphocyte differentiation, B cell proliferation, positive regulation of cell-cell adhesion, regulation
of cell-cell adhesion, JUN N-terminal kinase (JNK) cascade, regulation of immunoglobulin
Mathematical Biosciences and Engineering Volume 19, Issue 3, 2424–2452.2435
production, regulation of myeloid leukocyte differentiation, regulation of lymphocyte migration, and
lymphocyte homeostasis (Figure 10A–L, Table S6).
Figure 9. GSEA analysis results of the low- and high-risk score phenotypes in AML
using c2 reference gene set. (A) AML cluster 15; (B) metastasis model up; (C) apoptosis
via trail dn; (D) MAPK14 targets up; (E) Th1/Th2 pathway; (F) TGF beta receptor
signaling in epithelial to mesenchymal transition (EMT); (G) T to natural killer up; (H)
JAK2 targets up; (I) IL6 signaling up; (J) TP53 targets up; (K) Akt1 signaling via mTOR
up; (L) VEGF signaling pathway; (M) CD40 signaling up; (N) Rho pathway; (O) TCR
pathway; (P) P38/MIKK3/6 pathway.
Mathematical Biosciences and Engineering Volume 19, Issue 3, 2424–2452.2436
Figure 10. GSEA analysis results of the low- and high-risk score phenotypes in AML
using c5 reference gene set. (A) positive regulation of humoral immune response; (B)
regulation of lymphocyte apoptotic process; (C) negative regulation of leukocyte cell-cell
adhesion; (D) regulation of lymphocyte differentiation; (E) B cell proliferation; (F)
positive regulation of cell-cell adhesion; (G) regulation of cell-cell adhesion; (H) JNK
cascade; (I) regulation of immunoglobulin production; (J) regulation of myeloid leukocyte
differentiation; (K) regulation of lymphocyte migration; (L) lymphocyte homeostasis.
Mathematical Biosciences and Engineering Volume 19, Issue 3, 2424–2452.2437
In order to further understand the differential biological functions and pathways between high-
and low-risk phenotypes, we also screened for differentially expressed genes between the two
phenotypes and performed functional enrichment. By screening, we obtained a total of 185 DEGs
between high- and low-risk phenotypes (Figure 11, Table S7 and Figure S1). Through functional
enrichment, we found that these DEGs can be significantly enriched in cellular response to retinoic
acid, positive regulation of cell proliferation, gamma-aminobutyric acid type A receptor subunit
alpha1 (GABA-A) receptor complex, cell junction, cell surface receptor signaling pathway, ephrin
receptor signaling pathway, gamma-aminobutyric acid signaling pathway, extracellular matrix
(ECM)-receptor interaction, phosphatidylinositol 3-kinase (PI3K)-Akt signaling pathway and
proteoglycans in cancer (Figure 12, Table S8). We also use these DEGs to conduct potential AML
targeted drug screening in CMap. We have screened a total of six small molecule drugs that may be
potential targeted therapies for AML. These six drugs are alimemazine, MG-262, fluoxetine,
quipazine, naltrexone and oxybenzone (Figure 13A–G). In the analysis of the Drug-gene interaction
network constructed by STITCH, we found that fluoxetine can play a targeted therapeutic role in
AML by participating in the regulation of solute carrier family 6 member 2 (SLC6A2) and
cytochrome P450 family 2 subfamily C member 9 (CYP2C9) (Figure 14). In addition, Quipazine is
also involved in the regulation of SLC6A2 in AML (Figure 14). In addition, we also found that
naltrexone plays a targeted therapeutic role in AML through gamma-aminobutyric acid type A
receptor subunit alpha2 (GABRA2) and oxybenzone through potassium voltage-gated channel
interacting protein 1 (KCNIP1) (Figure 14). Finally, we used multivariate Cox proportional hazard
regression model to analyze the prognostic values of these DEGs in R platform, and we screened a
total of 28 DEGs that were significantly related to the prognosis of AML (Figure 15A, Table S9). The
top three genes with the most significant P values are matrix metallopeptidase 7 (MMP7) (Figure
15B), SIX homeobox 4 (SIX4) (Figure 15C) and gamma-aminobutyric acid type A receptor subunit
epsilon (GABRE) (Figure 15D).
Mathematical Biosciences and Engineering Volume 19, Issue 3, 2424–2452.2438
Figure 11. Volcano plot of the differentially expressed genes between the low- and
high-risk score phenotypes of AML.
Figure 12. Functional enrichment results of the differentially expressed genes between
the low- and high-risk score phenotypes of AML.
Mathematical Biosciences and Engineering Volume 19, Issue 3, 2424–2452.2439
Figure 13. CMap analysis results of the low- and high-risk score phenotypes in AML. (A)
The chemical structure of alimemazine; (B) The chemical structure of MG-262; (C) The
chemical structure of fluoxetine; (D) The chemical structure of quipazine; (E) The
chemical structure of naltrexone; (F) The chemical structure of oxybenzone; (G) The list
of CMap analysis results.
Mathematical Biosciences and Engineering Volume 19, Issue 3, 2424–2452.2440
Figure 14. Drug-gene interaction networks of six drugs.
Mathematical Biosciences and Engineering Volume 19, Issue 3, 2424–2452.2441
Figure 15. Survival analysis results of the differentially expressed genes between the
low- and high-risk score phenotypes of AML. (A) Volcano plot of the survival results; (B)
Kaplan-Meier curve of MMP7; (C) Kaplan-Meier curve of SIX4; (D) Kaplan-Meier
curve of GABRE.
3.4. Immune microenvironment and infiltration analysis
By calculating the scores of stromal cells and immune cells in the immune microenvironment,
we found that there are significant differences in AML patients at different risks in their immune and
ESTIMATE scores, and AML patients with high risk score have higher immune scores and
ESTIMATE scores (Figure 16A–C). No significant difference was observed in the stromal score
between the two risk score of AML patients (Figure 16A). By ploting a histogram of immune cell
infiltration in AML patients, we can clearly understand the proportion of immune cells in AML
patients (Figure 17A). Furthermore, we observed that there is significant differences in mast cell
resting infiltration between AML patients with different risk score (Figure 17B).
Mathematical Biosciences and Engineering Volume 19, Issue 3, 2424–2452.2442
Figure 16. Scatter plot of immune microenvironment score in TCGA AML cohort. (A)
Stromal score; (B) Immune score; (C) ESTIMATE score.
Figure 17. Demonstration of analysis of immune cell infiltration results in TCGA AML
cohort. (A) Histogram of the proportion of immune cells; (B) Violin plot of immune cells
between AML patients with different risk scores.
4. Discussion
With the discovery of high-throughput sequencing technology, more and more studies have
shown that snoRNAs is closely related to the prognosis of cancers. Huang et al. identified several
Mathematical Biosciences and Engineering Volume 19, Issue 3, 2424–2452.2443
snoRNAs significantly related to the prognosis of colon adenocarcinoma by analyzing the TCGA
RNA-seq dataset, and constructed a prognosis signature consisting of two snoRNAs expressions [14].
Similar to the research by Huang et al., Xing et al. identified snoRNAs of 113 snoRNAs significantly
related to the prognosis of HNSC by using the RNA-seq dataset of the TCGA head and neck
squamous cell carcinoma (HNSC) cohort, and used the least absolute shrinkage and selection
operator (LASSO) regression to construct a prognostic signature that included 5 prognostic snoRNAs,
which can significantly divide HNSC patients into high- and low-risk phenotypes [12]. In addition,
Zhao et al. used TCGA ccRCC RNA-seq dataset to identify a 6snoRNA signature for ccRCC
diagnosis and prognosis prediction [13]. Based on the above research, this study used the TCGA
sequencing dataset to screen snoRNAs related to AML prognosis. We identified a total of 30
snoRNAs that were significantly related to the prognosis of AML, and constructed an AML
prognostic signature containing 14 prognostic snoRNAs based on the above results, which can
accurately predict the 5-year survival of AML patients.
For the above 14 prognostic snoRNAs, some of them have also been reported to be closely
related to cancers in previous studies. Ronchetti et al. screened the expression profile of
sno/scaRNAs in patients with chronic lymphocytic leukemia (CLL) and found that SNORA31 is
down-regulated in CLL, which may be a new biomarker related to CLL [38]. Bignotti et al. found
that SNORD72 was significantly upregulated in high-grade serous carcinoma tissues compared with
normal control tissues [39]. Mao et al. found that SNORD72 is significantly overexpressed in
hepatocellular carcinoma (HCC) tumor tissues, and it plays an oncogene role in HCC. High
expression of SNORD72 can significantly promote HCC cell proliferation, colony formation and
invasion [40]. Human SNORA31 variations can affect the innate immunity of the central nervous system
to herpes simplex virus-1, thereby affecting the occurrence of herpes simplex encephalitis [41]. Davanian
et al found that SNORA65 was significantly up-regulated in Ameloblastoma tissue, and the
expression level was positively correlated with the tumor size [42].
For the function of the above 14 snoRNAs prognostic signature in AML, we found that this
prognostic signature is closely related to some classic tumor-related signaling pathways, including
PI3K-Akt, Wnt, EMT, TCR, NF-κB, mTOR signaling pathways. The PI3K-Akt-mTOR pathway is
one of the abnormally up-regulated signaling pathways in cancers, including AML. The increased
activity in the PI3K-Akt-mTOR pathway is a poor prognostic indicator of AML. Pharmacological
targeting of the PI3K-Akt-mTOR pathway with specific inhibitors can inhibit the growth of AML
cells [43–45]. In addition, targeted inhibition of PI3K, mTOR, Erk and Bcl-2 signaling network can
also increase the apoptosis of AML, which may be a potential AML targeted therapy strategy [46].
Targeted inhibition of mTOR kinase can be used as a potential strategy for the treatment of AML,
and may also affect the resistance of AML to chemotherapy drugs [47]. Targeted inhibition of mTOR
in AML cells can significantly reduce cell metabolic activity, block the cell cycle, and induce
apoptosis, which may be a potential therapeutic strategy for AML [48–51]. In the process of tumor
cell development and development, EMT will also cause tumor cells to lose some of the
characteristics of epithelial cells to obtain some of the characteristics of interstitial cells, and also
allow tumor cells to acquire stronger invasion and detachment capabilities. Targeted inhibition of
EMT in AML cells can significantly reduce the invasiveness of AML, and EMT-related genes are
significantly associated with poor prognosis of AML [52]. Zhang et al. found that EMT-related gene
E-cadherin is lowly expressed in AML, and ROC analysis suggests that it can be used as a diagnostic
biomarker for AML. At the same time, low expression of E-cadherin is also significantly associated
with the poor prognosis of AML [53]. High expression of EMT-related gene vimentin is significantly
associated with poor prognosis of AML [54]. Zhong et al showed that TCR gene rearrangement can
Mathematical Biosciences and Engineering Volume 19, Issue 3, 2424–2452.2444
be used to monitor minimal residual disease in AML patients [55]. Previous studies showed that
WT1-specific T cell receptor can be used for the treatment of AML, and can prevent the recurrence
of AML after hematopoietic cell transplantation [56,57]. Previous studies have shown that Wnt
signaling pathway is necessary to maintain the stem cell characteristics of AML[58,59], and
dysregulation of Wnt signaling can alter the microenvironment of AML [60]. Wnt signaling pathway
related genes are significantly associated with AML prognosis, and Wnt signaling pathway can be
used as a target for AML therapy [59]. Inhibition of the Wnt signaling pathway by the use of Wnt
antagonists in AML induces abnormal methylation in AML cells, which is closely associated with
recurrence and death of AML patients [61,62]. NF-κB signaling pathway is closely related to cancer
cell apoptosis, tumor genesis, angiogenesis, growth, tumor immunity and metastasis. Monotherapy or
combination therapy with NF-κB inhibitors aimed at preventing NF-κB activity and inducing
apoptosis can be used as a strategy for AML treatment [63–66]. Choi et al.'s research indicates that
the instability of the NF-κB and p38/MAPK signaling pathway is a key factor in the resistance of
AML cells to radiotherapy and doxorubicin [67]. Co-suppression of NF-κB and c-Jun N-terminal
kinase can significantly increase the sensitivity of drug therapy in tumor necrosis factor-expressing
AML cells [68]. The research of Bosman et al. showed that transforming growth factor-b activated kinase
1 (TAK1) is significantly upregulated in AML, and its inhibitor can induce AML cell apoptosis by
blocking NFKB [69]. Therefore, TAK1-NF-kB axis can be used as therapeutic target for AML [69].
For the six small molecule drugs screened in this study, we found that some drugs have been
reported to be closely related to tumors in previous studies. Ma et al.’s research suggests that
low-dose naltrexone can participate in the regulation of Bax/Bcl-2/caspase-3/PARP signaling axis
through M1 macrophages, thereby exerting a tumor suppressive effect in colorectal cancer cells [70].
Liu et al.’s study also reported that low-dose naltrexone can exert anti-cancer effects by inhibiting
EMT of Hela cells [71]. 1-Naphthyl, a derivative of quipazine, can exert a tumor suppressive effect
by inducing oxidative stress in melanoma cells [72]. MG-262, a proteasome inhibitor, which was
reported by Wei et al. through CMap analysis and found that MG-262 may be a targeted therapeutic
drug for head and neck squamous cell carcinoma [73]. Transcription replication will become an
effective target of the proteasome inhibitor MG-262 in cancer chemotherapy, which can enhance the
sensitivity of cancer cells to cisplatin, but has little effect on normal cells [74]. Proteasome inhibitors
are a new class of anticancer drugs that have recently been introduced into the clinical treatment of
multiple myeloma [75]. Zavrski et al. found that proteasome inhibitors, including MG-262, can
significantly inhibit the growth of myeloma cells, block the cell cycle and induce apoptosis by using
several proteasome inhibitors to intervene in human myeloma cell lines, respectively [76]. Wang et
al.’s research suggests that MG-262 can induce ovarian cancer cell apoptosis, inhibit ovarian cancer
cell proliferation and angiogenesis through the Erk signaling pathway [77]. Fluoxetine has been
reported to have anti-tumor effects. Wu et al. found that fluoxetine can induce non-small cell lung
cancer (NSCLC) cell apoptosis and inhibit DNA repair and metastatic potential by activating the
NF-κB signaling pathway [78]. Hsu et al. confirmed via in vivo experiments that fluoxetine in
hepatocellular carcinoma (HCC) and NSCLC can significantly reduce tumor cell proliferation,
induce apoptosis, and regulate the expression of invasion-related proteins. Its potential mechanism of
action in two tumors may be by blocking the activation of Akt/NF-κB or Erk/NF-κB signaling
pathways [79]. MUN et al. also supported the conclusion that Fluoxetine plays an anti-tumor role in
HCC [80]. Sun et al.’s findings suggest that fluoxetine can induce apoptosis and autophagic cell
death of Triple negative breast cancer (TNBC) cells by inhibiting eEF2K and activating the
AMPK-mTOR-ULK complex axis, which can be used as a potential TNBC treatment strategy [81].
Kabel et al.’s study also supports the conclusion that fluoxetine has an anti-cancer effect in breast
Mathematical Biosciences and Engineering Volume 19, Issue 3, 2424–2452.2445
cancer [82]. Fluoxetine also can exert tumor suppressive effect by inducing cytotoxic endoplasmic
reticulum stress and autophagy in TNBC [83]. Khing et al found that fluoxetine can significantly
enhance the antiproliferative effect of paclitaxel in gastric adenocarcinoma cells, and the combined
effect of the two drugs can significantly induce apoptosis and necroptosis [84]. The study of Khin et
al. also suggested that fluoxetine has an anti-tumor effect in gastric cancer (GC), which induces
apoptosis of GC cells through endoplasmic reticulum stress pathway [85]. Fluoxetine has also been
reported that its antitumor effect in colorectal cancer cells mainly induces apoptosis and DNA
breakage of colorectal cancer cells through its cytotoxic effect, and its mechanism of inducing
apoptosis is p53-independent [86]. Kannen et al. found that fluoxetine can significantly affect the
energy production of colorectal cancer tumor cells, and can also induce cell cycle arrest and inhibit
cell proliferation, resulting in tumors under hypoxic conditions. Then, hypoxia can lead to reduced
microvessel formation and reduced tumor size in the tumor tissue of the colorectal cancer xenograft
model [87]. Several studies have also reported that Fluoxetine has antitumor effects in colorectal
cancer [88,89]. Koh et al found that Fluoxetine can reduce the risk of experimental colitis-associated
colon cancer in mice by participating in the regulation of NF-kB signaling pathway [90]. Fluoxetine
can significantly inhibit the growth of glioblastoma and exert anticancer effect [91,92]. Although
fluoxetine exerts antitumor effects in a variety of solid tumors, however, its role on AML has not
been reported. Our study is the first to report that fluoxetine may be used as a potential AML targeted
therapy drug based on in silico analysis. Through literature search, we have not found any reports
about anti-tumor effects of alimemazine and oxybenzone.
This study has some disadvantages that need to be clarified. First, the AML cohort in this study
is derived from the TCGA single center cohort, and the sample size is small. Our results still need to
be verified in a multi-center cohorts with large sample size. Secondly, many clinical parameters are
unavailable due to dataset from TCGA. Third, because this study is a in silico analysis, we used
genome-wide dataset to screen out a large number of potential functional mechanisms and targeted
therapeutic drugs related to AML, but our results still lacks in vivo and in vitro functional
experimental verification. Despite the aforementioned disadvantages, the advantage of this study is
that we are the first to use genome-wide data set to screen prognostic snoRNAs for AML. This study
explores the genome of AML from a new perspective, which can provide a theoretical basis for
future research. At the same time, this study also identified six potential targeted drugs for AML.
Once these drugs are verified in vivo and in vitro experiments, they can also help in the future
treatment of AML. Most importantly, this study also constructed an AML prognostic signature and
nomogram model based on snoRNAs expression, which can provide new biomarkers for AML.
5. Conclusions
In conclusion, our current study was constructed an AML prognostic signature based on 14
snoRNAs, and a nomogram model for predicting AML prognosis was constructed based on this
signature. Through GSEA, snoRNAs co-expressed PCGs and DEGs functional enrichment
analysis, we screened a large number of potential functional mechanisms of this prognostic
signature in AML. In the subsequent targeted drug screening, we also identified six
small-molecule drugs that can be used for AML targeted therapy. At the same time, we also used
drug-gene interaction analysis tools to identify potential targets for some drugs to function in
AML. We have also observed that AML patients with different risk scores have significant
differences in the immune microenvironment and immune cell infiltration. Although this study is
the first to comprehensively analyze the relationship between snoRNAs and AML prognosis
Mathematical Biosciences and Engineering Volume 19, Issue 3, 2424–2452.2446
through whole-genome dataset, however, our results still need to be verified by further in vivo
and in vitro functional experiments in future studies.
Acknowledgments
This work was supported in part by the National Natural Science Foundation of China
(No.81160075, 81960038); Natural Science Foundation of Guangxi (No.0728124); Self-raised
Scientific Research Fund of the Ministry of Health of Guangxi Province (Z2014035). The authors
thank the contributors of The Cancer Genome Atlas (https://portal.gdc.cancer.gov/) for their
contribution to share the AML dataset on open access. In addition, we also would like to
acknowledge the helpful comments on this paper received from our reviewers.
Conflict of interest
The authors declare that they have no competing interests.
References
1. A. Khwaja, M. Bjorkholm, R. E. Gale, R. L. Levine, C. T. Jordan, G. Ehninger, et al., Acute
myeloid leukaemia, Nat. Rev. Dis. Primers, 2 (2016), 16010.
https://doi.org/10.1038/nrdp.2016.10
2. E. Estey, H. Dohner, Acute myeloid leukaemia, Lancet, 368 (2006), 1894–1907.
https://doi.org/10.1016/S0140-6736(06)69780-8
3. L. Bullinger, K. Dohner, E. Bair, S. Frohling, R. F. Schlenk, R. Tibshirani, et al., Use of
gene-expression profiling to identify prognostic subclasses in adult acute myeloid leukemia, N.
Eng. J. Med., 350 (2004), 1605–1616. https://doi.org/10.1056/NEJMoa031046
4. E. Papaemmanuil, M. Gerstung, L. Bullinger, V. I. Gaidzik, P. Paschka, N. D. Roberts, et al.,
Genomic classification and prognosis in acute myeloid leukemia, N. Eng. J. Med., 374 (2016),
2209–2221. https://doi.org/10.1056/NEJMoa1516192
5. C. C. Coombs, M. S. Tallman, R. L. Levine, Molecular therapy for acute myeloid leukaemia,
Nat. Rev. Clin. Oncol., 13 (2016), 305–318. https://doi.org/10.1038/nrclinonc.2015.210
6. J. W. Tyner, C. E. Tognon, D. Bottomly, B. Wilmot, S. E. Kurtz, S. L. Savage, et al., Functional
genomic landscape of acute myeloid leukaemia, Nature, 562 (2018), 526–531.
https://doi.org/10.1038/s41586-018-0623-z
7. S. Abelson, G. Collord, S. W. K. Ng, O. Weissbrod, N. M. Cohen, E. Niemeyer, et al., Prediction
of acute myeloid leukaemia risk in healthy individuals, Nature, 559 (2018), 400–404.
https://doi.org/10.1038/s41586-018-0317-6
8. S. C. Meyer, R. L. Levine, Translational implications of somatic genomics in acute myeloid
leukaemia, Lancet Oncol., 15 (2014), e382–394.
https://doi.org/10.1016/S1470-2045(14)70008-7
9. T. Bratkovic, J. Bozic, B. Rogelj, Functional diversity of small nucleolar RNAs, Nucleic Acids
Res., 48 (2020), 1627–1651. https://doi.org/10.1093/nar/gkz1140
10. J. Ni, A. L. Tien, M. J. Fournier, Small nucleolar RNAs direct site-specific synthesis of
pseudouridine in ribosomal RNA, Cell, 89 (1997), 565–573.
https://doi.org/10.1016/s0092-8674(00)80238-x
Mathematical Biosciences and Engineering Volume 19, Issue 3, 2424–2452.2447
11. V. Chikne, K. S. Rajan, M. Shalev-Benami, K. Decker, S. Cohen-Chalamish, H. Madmoni, et al.,
Small nucleolar RNAs controlling rRNA processing in Trypanosoma brucei, Nucleic Acids Res.,
47 (2019), 2609–2629. https://doi.org/10.1093/nar/gky1287
12. L. Xing, X. Zhang, X. Zhang, D. Tong, Expression scoring of a small-nucleolar-RNA signature
identified by machine learning serves as a prognostic predictor for head and neck cancer, J. Cell
Phys., 235 (2020), 8071–8084. https://doi.org/10.1002/jcp.29462
13. Y. Zhao, Y. Yan, R. Ma, X. Lv, L. Zhang, J. Wang, et al., Expression signature of
six-snoRNA serves as novel non-invasive biomarker for diagnosis and prognosis prediction
of renal clear cell carcinoma, J. Cell Mol. Med., 24 (2020), 2215–2228.
https://doi.org/10.1111/jcmm.14886
14. L. Huang, X. Z. Liang, Y. Deng, Y. B. Liang, X. Zhu, X. Y. Liang, et al., Prognostic value of
small nucleolar RNAs (snoRNAs) for colon adenocarcinoma based on RNA sequencing data,
Pathol. Res. Pract., 216 (2020), 152937. https://doi.org/10.1016/j.prp.2020.152937
15. J. Gong, Y. Li, C. J. Liu, Y. Xiang, C. Li, Y. Ye, et al., A pan-cancer analysis of the expression
and clinical relevance of small nucleolar RNAs in human cancer, Cell Rep., 21 (2017),
1968–1981. https://doi.org/10.1016/j.celrep.2017.10.070
16. The Cancer Genome Atlas Research Network, Genomic and epigenomic landscapes of adult de
novo acute myeloid leukemia, N. Eng. J. Med., 368 (2013), 2059–2074.
https://doi.org/10.1056/NEJMoa1301689
17. M. D. Robinson, D. J. McCarthy, G. K. Smyth, edgeR: a Bioconductor package for differential
expression analysis of digital gene expression data, Bioinformatics, 26 (2010), 139–140.
https://doi.org/10.1093/bioinformatics/btp616
18. R. Huang, X. Liao, Q. Li, Identification and validation of potential prognostic gene biomarkers
for predicting survival in patients with acute myeloid leukemia, Oncol. Targets Ther., 10 (2017),
5243–5254. https://doi.org/10.2147/OTT.S147717
19. X. Liao, X. Wang, K. Huang, C. Yang, T. Yu, C. Han, et al., Genome-scale analysis to identify
prognostic microRNA biomarkers in patients with early stage pancreatic ductal adenocarcinoma
after pancreaticoduodenectomy, Cancer Manage. Res., 10 (2018), 2537–2551.
https://doi.org/10.2147/CMAR.S168351
20. X. Liao, X. Wang, K. Huang, C. Han, J. Deng, T. Yu, et al., Integrated analysis of competing
endogenous RNA network revealing potential prognostic biomarkers of hepatocellular
carcinoma, J. Cancer, 10 (2019), 3267–3283. https://doi.org/10.7150/jca.29986
21. W. H. Da, B. T. Sherman, R. A. Lempicki, Systematic and integrative analysis of large gene lists
using DAVID bioinformatics resources, Nat. Protoc., 4 (2009), 44–57.
https://doi.org/10.1038/nprot.2008.211
22. V. K. Mootha, C. M. Lindgren, K. F. Eriksson, A. Subramanian, S. Sihag, J. Lehar, et al.,
PGC-1alpha-responsive genes involved in oxidative phosphorylation are coordinately
downregulated in human diabetes, Nat. Genet., 34 (2003), 267–273.
https://doi.org/10.1038/ng1180
23. A. Subramanian, P. Tamayo, V. K. Mootha, S. Mukherjee, B. L. Ebert, M. A. Gillette, et al.,
Gene set enrichment analysis: a knowledge-based approach for interpreting genome-wide
expression profiles, Proc. Nat. Acad. Sci. U. S. A., 102 (2005), 15545–15550.
https://doi.org/10.1073/pnas.0506580102
Mathematical Biosciences and Engineering Volume 19, Issue 3, 2424–2452.2448
24. A. Liberzon, C. Birger, H. Thorvaldsdottir, M. Ghandi, J. P. Mesirov, P. Tamayo, The molecular
signatures database (MSigDB) hallmark gene set collection, Cell Syst., 1 (2015), 417–425.
https://doi.org/10.1016/j.cels.2015.12.004
25. A. Liberzon, A. Subramanian, R. Pinchback, H. Thorvaldsdottir, P. Tamayo, J. P. Mesirov,
Molecular signatures database (MSigDB) 3.0, Bioinformatics, 27 (2011), 1739–1740.
https://doi.org/10.1093/bioinformatics/btr260
26. J. Lamb, The connectivity map: a new tool for biomedical research, Nat. Rev. Cancer, 7 (2007),
54–60. https://doi.org/10.1038/nrc2044
27. J. Lamb, E. D. Crawford, D. Peck, J. W. Modell, I. C. Blat, M. J. Wrobel, et al., The connectivity
map: using gene-expression signatures to connect small molecules, genes, and disease, Science,
313 (2006), 1929–1935. https://doi.org/10.1126/science.1132939
28. E. W. Sayers, J. Beck, J. R. Brister, E. E. Bolton, K. Canese, D. C. Comeau, et al., Database
resources of the national center for biotechnology information, Nucleic Acids Res., 48 (2020),
D9–D16. https://doi.org/10.1093/nar/gkz899
29. S. Kim, J. Chen, T. Cheng, A. Gindulyte, J. He, S. He, et al., PubChem 2019 update: improved
access to chemical data, Nucleic Acids Res., 47 (2019), D1102–D1109.
https://doi.org/10.1093/nar/gky1033
30. M. Kuhn, D. Szklarczyk, A. Franceschini, M. Campillos, C. V. Mering, L. J. Jensen, et al.,
STITCH 2: an interaction network database for small molecules and proteins, Nucleic Acids Res.,
38 (2010), D552–556. https://doi.org/10.1093/nar/gkp937
31. M. Kuhn, C. V. Mering, M. Campillos, L. J. Jensen, P. Bork, STITCH: interaction networks of
chemicals and proteins, Nucleic Acids Res., 36 (2008), D684–688.
https://doi.org/10.1093/nar/gkm795
32. D. Szklarczyk, A. Santos, C. V. Mering, L. J. Jensen, P. Bork, M. Kuhn, STITCH 5: augmenting
protein-chemical interaction networks with tissue and affinity data, Nucleic Acids Res., 44
(2016), D380–384. https://doi.org/10.1093/nar/gkv1277
33. K. Yoshihara, M. Shahmoradgoli, E. Martinez, R. Vegesna, H. Kim, W. Torres-Garcia, et al.,
Inferring tumour purity and stromal and immune cell admixture from expression data, Nat.
Commun., 4 (2013), 2612. https://doi.org/10.1038/ncomms3612
34. B. Chen, M. S. Khodadoust, C. L. Liu, A. M. Newman, A. A. Alizadeh, Profiling tumor
infiltrating immune cells with CIBERSORT, Methods Mol. Biol., 1711 (2018), 243–259.
https://doi.org/10.1007/978-1-4939-7493-1_12
35. Y. Benjamini, D. Drai, G. Elmer, N. Kafkafi, I. Golani, Controlling the false discovery rate in
behavior genetics research, Behav. Brain Res., 125 (2001), 279–284.
https://doi.org/10.1016/s0166-4328(01)00297-2
36. P. Shannon, A. Markiel, O. Ozier, N. S. Baliga, J. T. Wang, D. Ramage, et al., Cytoscape: a
software environment for integrated models of biomolecular interaction networks, Genome Res.,
13 (2003), 2498–2504. https://doi.org/10.1101/gr.1239303
37. D. Otasek, J. H. Morris, J. Boucas, A. R. Pico, B. Demchak, Cytoscape automation: empowering
workflow-based network analysis, Genome Biol., 20 (2019), 185.
https://doi.org/10.1186/s13059-019-1758-4
38. D. Ronchetti, L. Mosca, G. Cutrona, G. Tuana, M. Gentile, S. Fabris, et al., Small nucleolar
RNAs as new biomarkers in chronic lymphocytic leukemia, BMC Med. Genomics, 6 (2013), 27.
https://doi.org/10.1186/1755-8794-6-27
Mathematical Biosciences and Engineering Volume 19, Issue 3, 2424–2452.2449
39. E. Bignotti, S. Calza, R. A. Tassi, L. Zanotti, E. Bandiera, E. Sartori, et al., Identification of
stably expressed reference small non-coding RNAs for microRNA quantification in high-grade
serous ovarian carcinoma tissues, J. Cell Mol. Med., 20 (2016), 2341–2348.
https://doi.org/10.1111/jcmm.12927
40. L. H. Mao, S. Y. Chen, X. Q. Li, F. Xu, J. Lei, Q. L. Wang, et al., LncRNA-LALR1 upregulates
small nucleolar RNA SNORD72 to promote growth and invasion of hepatocellular carcinoma,
Aging (Albany NY), 12 (2020), 4527–4546. https://doi.org/10.18632/aging.102907
41. F. G. Lafaille, O. Harschnitz, Y. S. Lee, P. Zhang, M. L. Hasek, G. Kerner, et al., Human
SNORA31 variations impair cortical neuron-intrinsic immunity to HSV-1 and underlie herpes
simplex encephalitis, Nat. Med., 25 (2019), 1873–1884.
https://doi.org/10.1038/s41591-019-0672-3
42. H. Davanian, A. Balasiddaiah, R. Heymann, M. Sundstrom, P. Redenstrom, M. Silfverberg, et
al., Ameloblastoma RNA profiling uncovers a distinct non-coding RNA signature, Oncotarget, 8
(2017), 4530–4542. https://doi.org/10.18632/oncotarget.13889
43. I. Nepstad, K. J. Hatfield, I. S. Gronningsaeter, H. Reikvam, The PI3K-Akt-mTOR signaling
pathway in human acute myeloid leukemia (AML) cells, Int. J. Mol. Sci., 21 (2020), 2907.
https://doi.org/10.3390/ijms21082907
44. L. Herschbein, J. L. Liesveld, Dueling for dual inhibition: Means to enhance effectiveness of
PI3K/Akt/mTOR inhibitors in AML, Blood Rev., 32 (2018), 235–248.
https://doi.org/10.1016/j.blre.2017.11.006
45. J. Bertacchini, N. Heidari, L. Mediani, S. Capitani, M. Shahjahani, A. Ahmadzadeh, et al.,
Targeting PI3K/AKT/mTOR network for treatment of leukemia, Cell Mol. Life Sci., 72 (2015),
2337–2347. https://doi.org/10.1007/s00018-015-1867-5
46. Y. Su, X. Li, J. Ma, J. Zhao, S. Liu, G. Wang, et al., Targeting PI3K, mTOR, ERK and Bcl-2
signaling network shows superior antileukemic activity against AML ex vivo, Biochem.
Pharmacol., 148 (2018), 13–26. https://doi.org/10.1016/j.bcp.2017.11.022
47. Y. Tabe, A. Tafuri, K. Sekihara, H. Yang, M. Konopleva, Inhibition of mTOR kinase as a
therapeutic target for acute myeloid leukemia, Expert Opin. Ther. Targets, 21 (2017), 705–714.
https://doi.org/10.1080/14728222.2017.1333600
48. N. Guo, M. Azadniv, M. Coppage, M. Nemer, J. Mendler, M. Becker, et al., Effects of
neddylation and mTOR inhibition in acute myelogenous leukemia, Transl. Oncol., 12 (2019),
602–613. https://doi.org/10.1016/j.tranon.2019.01.001
49. J. Wu, G. Hu, Y. Dong, R. Ma, Z. Yu, S. Jiang, et al., Matrine induces Akt/mTOR signalling
inhibition-mediated autophagy and apoptosis in acute myeloid leukaemia cells, J. Cell Mol.
Med., 21 (2017), 1171–1181. https://doi.org/10.1111/jcmm.13049
50. Y. Feng, L. Wu, mTOR up-regulation of PFKFB3 is essential for acute myeloid leukemia cell
survival, Biochem. Biophys. Res. Commun., 483 (2017), 897–903.
51. J. Bertacchini, C. Frasson, F. Chiarini, D. D’Avella, B. Accordi, L. Anselmi, et al., Dual
inhibition of PI3K/mTOR signaling in chemoresistant AML primary cells, Adv. Biol. Regul., 68
(2018), 2–9. https://doi.org/10.1016/j.jbior.2018.03.001
52. V. Stavropoulou, S. Kaspar, L. Brault, M. A. Sanders, S. Juge, S. Morettini, et al., MLL-AF9
expression in hematopoietic stem cells drives a highly invasive AML expressing EMT-related
genes linked to poor outcome, Cancer Cell, 30 (2016), 43–58.
https://doi.org/10.1016/j.ccell.2016.05.011
Mathematical Biosciences and Engineering Volume 19, Issue 3, 2424–2452.2450
53. T. J. Zhang, J. D. Zhou, J. C. Ma, Z. Q. Deng, Z. Qian, D. M. Yao, et al., CDH1 (E-cadherin)
expression independently affects clinical outcome in acute myeloid leukemia with normal
cytogenetics, Clin. Chem. Lab. Med., 55 (2017), 123–131.
https://doi.org/10.1515/cclm-2016-0205
54. S. Wu, Y. Du, J. Beckford, H. Alachkar, Upregulation of the EMT marker vimentin is associated
with poor clinical outcome in acute myeloid leukemia, J. Transl. Med., 16 (2018), 170.
https://doi.org/10.1186/s12967-018-1539-y
55. L. Zhong, J. Chen, X. Huang, Y. Li, T. Jiang, Monitoring immunoglobulin heavy chain and
T-cell receptor gene rearrangement in cfDNA as minimal residual disease detection for
patients with acute myeloid leukemia, Oncol. Lett., 16 (2018), 2279–2288.
https://doi.org/10.3892/ol.2018.8966
56. A. G. Chapuis, D. N. Egan, M. Bar, T. M. Schmitt, M. S. McAfee, K. G. Paulson, et al., T cell
receptor gene therapy targeting WT1 prevents acute myeloid leukemia relapse post-transplant,
Nat. Med., 25 (2019), 1064–1072. https://doi.org/10.1038/s41591-019-0472-9
57. H. J. Stauss, S. Thomas, M. Cesco-Gaspere, D. P. Hart, S. A. Xue, A. Holler, et al.,
WT1-specific T cell receptor gene therapy: improving TCR function in transduced T cells,
Blood Cells Mol. Dis., 40 (2008), 113–116. https://doi.org/10.1016/j.bcmd.2007.06.018
58. Y. Wang, A. V. Krivtsov, A. U. Sinha, T. E. North, W. Goessling, Z. Feng, et al., The
Wnt/beta-catenin pathway is required for the development of leukemia stem cells in AML,
Science, 327 (2010), 1650–1653. https://doi.org/10.1126/science.1186624
59. A. M. Gruszka, D. Valli, M. Alcalay, Wnt signalling in acute myeloid leukaemia, Cells, 8 (2019),
1403. https://doi.org/10.3390/cells8111403
60. F. J. Staal, F. Famili, L. G. Perez, K. Pike-Overzet, Aberrant Wnt signaling in leukemia, Cancers
(Basel), 8 (2016), 78. https://doi.org/10.3390/cancers8090078
61. A. Valencia, J. Roman-Gomez, J. Cervera, E. Such, E. Barragan, P. Bolufer, et al., Wnt signaling
pathway is epigenetically regulated by methylation of Wnt antagonists in acute myeloid
leukemia, Leukemia, 23 (2009), 1658–1666. https://doi.org/10.1038/leu.2009.86
62. E. A. Griffiths, S. D. Gore, C. Hooker, M. A. McDevitt, J. E. Karp, B. D. Smith, et al., Acute
myeloid leukemia is characterized by Wnt pathway inhibitor promoter hypermethylation, Leuk.
Lymphoma, 51 (2010), 1711–1719. https://doi.org/10.3109/10428194.2010.496505
63. C. Gasparini, C. Celeghini, L. Monasta, G. Zauli, NF-kappaB pathways in hematological malignancies,
Cell Mol. Life Sci., 71 (2014), 2083–2102. https://doi.org/10.1007/s00018-013-1545-4
64. M. Breccia, G. Alimena, NF-kappaB as a potential therapeutic target in myelodysplastic
syndromes and acute myeloid leukemia, Expert Opin. Ther. Targets, 14 (2010), 1157–1176.
https://doi.org/10.1517/14728222.2010.522570
65. M. C. Bosman, J. J. Schuringa, E. Vellenga, Constitutive NF-kappaB activation in AML: Causes
and treatment strategies, Crit. Rev. Oncol. Hematol., 98 (2016), 35–44. https://doi.org/
10.1016/j.critrevonc.2015.10.001
66. J. Zhou, Y. Q. Ching, W. J. Chng, Aberrant nuclear factor-kappa B activity in acute myeloid
leukemia: from molecular pathogenesis to therapeutic target, Oncotarget, 6 (2015), 5490–5500.
https://doi.org/10.18632/oncotarget.3545
67. C. H. Choi, H. Xu, H. Bark, T. B. Lee, J. Yun, S. I. Kang, et al., Balance of NF-kappaB and p38
MAPK is a determinant of radiosensitivity of the AML-2 and its doxorubicin-resistant cell lines,
Leuk. Res., 31 (2007), 1267–1276. https://doi.org/10.1016/j.leukres.2006.11.006
Mathematical Biosciences and Engineering Volume 19, Issue 3, 2424–2452.2451
68. A. Volk, J. Li, J. Xin, D. You, J. Zhang, X. Liu, et al., Co-inhibition of NF-kappaB and JNK is
synergistic in TNF-expressing human AML, J. Exp. Med., 211 (2014), 1093–1108.
https://doi.org/10.1084/jem.20130990
69. M. C. Bosman, H. Schepers, J. Jaques, A. Z. Brouwers-Vos, W. J. Quax, J. J. Schuringa, et al.,
The TAK1-NF-kappaB axis as therapeutic target for AML, Blood, 124 (2014), 3130–3140.
https://doi.org/10.1182/blood-2014-04-569780
70. M. Ma, X. Wang, N. Liu, F. Shan, Y. Feng, Low-dose naltrexone inhibits colorectal cancer
progression and promotes apoptosis by increasing M1-type macrophages and activating the
Bax/Bcl-2/caspase-3/PARP pathway, Int. Immunopharmacol., 83 (2020), 106388.
https://doi.org/10.1016/j.intimp.2020.106388
71. N. Liu, M. Ma, N. Qu, R. Wang, H. Chen, F. Hu, et al., Low-dose naltrexone inhibits the
epithelial-mesenchymal transition of cervical cancer cells in vitro and effects indirectly on
tumor-associated macrophages in vivo, Int. Immunopharmacol., 86 (2020), 106718.
https://doi.org/10.1016/j.intimp.2020.106718
72. A. C. Menezes, M. Carvalheiro, J. M. P. F. de Oliveira, A. Ascenso, H. Oliveira, Cytotoxic effect
of the serotonergic drug 1-(1-Naphthyl)piperazine against melanoma cells, Toxicol. Int. Vitro, 47
(2018), 72–78. https://doi.org/10.1016/j.tiv.2017.11.011
73. G. G. Wei, L. Gao, Z. Y. Tang, P. Lin, L. B. Liang, J. J. Zeng, et al., Drug repositioning in head
and neck squamous cell carcinoma: An integrated pathway analysis based on connectivity map
and differential gene expression, Pathol. Res. Pract., 215 (2019), 152378.
https://doi.org/10.1016/j.prp.2019.03.007
74. J. Takezawa, Y. Ishimi, K. Yamada, Proteasome inhibitors remarkably prevent translesion
replication in cancer cells but not normal cells, Cancer Sci., 99 (2008), 863–871.
https://doi.org/10.1111/j.1349-7006.2008.00764.x
75. P. G. Richardson, C. Mitsiades, T. Hideshima, K. C. Anderson, Bortezomib: proteasome
inhibition as an effective anticancer therapy, Annu. Rev. Med., 57 (2006), 33–47.
https://doi.org/10.1146/annurev.med.57.042905.122625
76. I. Zavrski, C. Naujokat, K. Niemoller, C. Jakob, U. Heider, C. Langelotz, et al., Proteasome
inhibitors induce growth inhibition and apoptosis in myeloma cell lines and in human bone
marrow myeloma cells irrespective of chromosome 13 deletion, J. Cancer Res. Clin. Oncol.,
129 (2003), 383–391. https://doi.org/10.1007/s00432-003-0454-6
77. W. X. Wang, B. H. Kong, P. Li, K. Song, X. Qu, B. X. Cui, et al., Effect of extracellular signal
regulated kinase signal pathway on apoptosis induced by MG262 in ovarian cancer cells,
Zhonghua Fu Chan Ke Za Zhi, 43 (2008), 690–694
78. J. Y. Wu, S. S. Lin, F. T. Hsu, J. G. Chung, Fluoxetine inhibits DNA repair and
NF-kB-modulated metastatic potential in non-small cell lung cancer, Anticancer Res., 38 (2018),
5201–5210. https://doi.org/10.21873/anticanres.12843
79. L. C. Hsu, H. F. Tu, F. T. Hsu, P. F. Yueh, I. T. Chiang, Beneficial effect of fluoxetine on
anti-tumor progression on hepatocellular carcinoma and non-small cell lung cancer bearing
animal model, Biomed. Pharmacother., 126 (2020), 110054.
https://doi.org/10.1016/j.biopha.2020.110054
80. A. R. Mun, S. J. Lee, G. B. Kim, H. S. Kang, J. S. Kim, S. J. Kim, Fluoxetine-induced apoptosis
in hepatocellular carcinoma cells, Anticancer Res., 33 (2013), 3691–3697
Mathematical Biosciences and Engineering Volume 19, Issue 3, 2424–2452.You can also read