Intracranial Mapping of a Cortical Tinnitus System using Residual Inhibition
←
→
Page content transcription
If your browser does not render page correctly, please read the page content below
Report

Intracranial Mapping of a Cortical Tinnitus System
using Residual Inhibition
Highlights                                                            Authors
d   Extensive intracranial recordings were made from an awake,        William Sedley, Phillip E. Gander, ...,
    behaving tinnitus patient                                         Matthew A. Howard III,
                                                                      Timothy D. Griffiths
d   Tinnitus intensity was modulated with tight control over other
    factors                                                           Correspondence
d   Tinnitus is linked to widespread coherent delta-band cortical     willsedley@gmail.com (W.S.),
                                                                      phillip-gander@uiowa.edu (P.E.G.)
    oscillations

d   Rich local cross-frequency interactions link delta to all other   In Brief
    frequency bands                                                   Recording from an extensive array of
                                                                      intracranial electrodes in an awake,
                                                                      behaving human patient, Sedley, Gander
                                                                      et al. expose the detailed workings of a
                                                                      brain system responsible for generating
                                                                      tinnitus.

            Sedley et al., 2015, Current Biology 25, 1208–1214
            May 4, 2015 ª2015 The Authors
            http://dx.doi.org/10.1016/j.cub.2015.02.075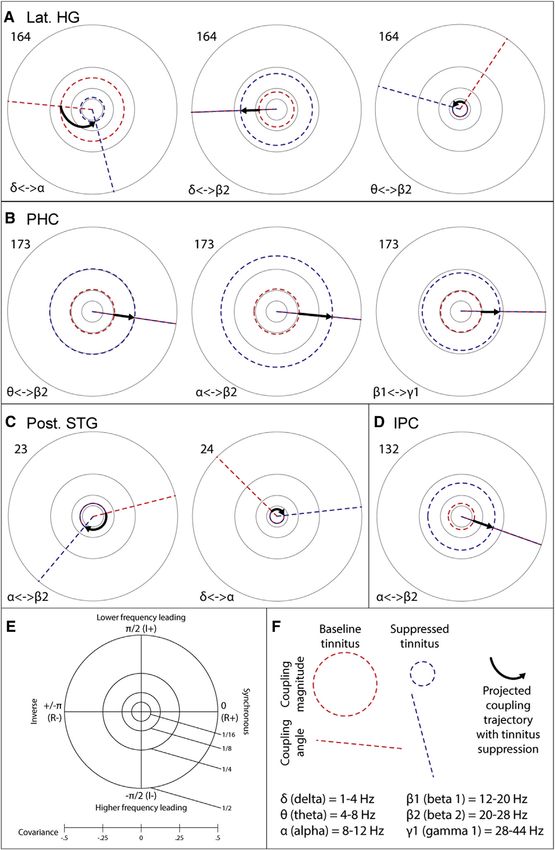
Current Biology

                                                                                                               Report

Intracranial Mapping of a Cortical
Tinnitus System using Residual Inhibition
William Sedley,1,2,4,* Phillip E. Gander,1,4,* Sukhbinder Kumar,2,3 Hiroyuki Oya,1 Christopher K. Kovach,1 Kirill V. Nourski,1
Hiroto Kawasaki,1 Matthew A. Howard III,1 and Timothy D. Griffiths1,2,3
1Human    Brain Research Laboratory, Department of Neurosurgery, The University of Iowa, Iowa City, IA 52242, USA
2Auditory  Group, Institute of Neuroscience, Newcastle University, Newcastle upon Tyne, Tyne and Wear NE2 4HH, UK
3Wellcome Trust Centre for Neuroimaging, University College London, London WC1N 3BG, UK
4Co-first author

*Correspondence: willsedley@gmail.com (W.S.), phillip-gander@uiowa.edu (P.E.G.)
http://dx.doi.org/10.1016/j.cub.2015.02.075
This is an open access article under the CC BY license (http://creativecommons.org/licenses/by/4.0/).

SUMMARY                                                            bilateral hearing loss (Figure S1A). See the Supplemental
                                                                   Experimental Procedures for further subject details and the
Tinnitus can occur when damage to the peripheral                   Supplemental Discussion with regard to the typicality of his
auditory system leads to spontaneous brain activity                case. He underwent chronic intracranial monitoring of the left
that is interpreted as sound [1, 2]. Many abnormal-                hemisphere (contralateral to his better hearing ear) for intrac-
ities of brain activity are associated with tinnitus,              table focal seizures. During the invasive monitoring period,
but it is unclear how these relate to the phantom                  his tinnitus was repeatedly transiently suppressed using resid-
                                                                   ual inhibition (RI; transient reduction in tinnitus loudness after
sound itself, as opposed to predisposing factors
                                                                   presentation of a sound) [4, 8] and assessed by periodic rat-
or secondary consequences [3]. Demonstrating
                                                                   ings of tinnitus loudness, in between which were 10 s blocks
‘‘core’’ tinnitus correlates (processes that are both              (from which data were used for analysis) in which he was pre-
necessary and sufficient for tinnitus perception) re-              sented no stimuli and had no task to perform. RI can be
quires high-precision recordings of neural activity                achieved in the vast majority of tinnitus patients and is thought
combined with a behavioral paradigm in which the                   to suppress tinnitus by temporarily reducing the underlying hy-
perception of tinnitus is manipulated and accurately               peractivity in the ascending auditory pathway [13]. The subject
reported by the subject. This has been previously                  reported that all masker presentations produced some RI, but
impossible in animal and human research. Here we                   there was variation in the duration of the effect across trials.
present extensive intracranial recordings from an                  Data collection used for the main analyses commenced after
awake, behaving tinnitus patient during short-term                 the subject provided his first post-masker rating of tinnitus
                                                                   loudness, and we classified trials as ‘‘RI trials’’ when his
modifications in perceived tinnitus loudness after
                                                                   tinnitus remained suppressed at this time. The experiment
acoustic stimulation (residual inhibition) [4], permit-
                                                                   was performed on two separate days, with 15/30 trials on
ting robust characterization of core tinnitus pro-                 day 1 and 14/30 on day 2 constituting ‘‘RI trials.’’ Efficacy
cesses. As anticipated, we observed tinnitus-linked                was greater in the first half of each experiment (Figure 1).
low-frequency (delta) oscillations [5–9], thought to               Given that the task and acoustic stimuli were identical in all tri-
be triggered by low-frequency bursting in the thal-                als, the observed results could be considered to represent
amus [10, 11]. Contrary to expectation, these delta                changes in tinnitus itself, with minimal influence of confound-
changes extended far beyond circumscribed audi-                    ing factors. The presented results were derived from regres-
tory cortical regions to encompass almost all of audi-             sion of neural activity, recorded electrocorticographically,
tory cortex, plus large parts of temporal, parietal,               against the degree of subjective tinnitus suppression. Neuro-
sensorimotor, and limbic cortex. In discrete auditory,             physiological results were nearly identical across the two
                                                                   experimental days (Figure S2), and the data were therefore
parahippocampal, and inferior parietal ‘‘hub’’ regions
                                                                   pooled for further analysis. Though we recorded mainly from
[12], these delta oscillations interacted with middle-
                                                                   the left hemisphere, we assume that similar results might
frequency (alpha) and high-frequency (beta and                     have been obtained from the right hemisphere as the subject’s
gamma) activity, resulting in a coherent system of                 tinnitus, the maskers used, and the RI achieved, were all
tightly coupled oscillations associated with high-                 symmetrical.
level functions including memory and perception.
                                                                   Auditory Response Characterization
RESULTS AND DISCUSSION                                             Evoked, induced, and steady-state auditory responses were
                                                                   measured to 5 kHz (tinnitus-matched) tones and were localized
Subject and Paradigm                                               entirely to primary auditory cortex (A1), which was defined phys-
The subject was a 50-year-old left-handed male with a typical      iologically as occupying medial Heschl’s gyrus (HG). See Fig-
tinnitus pattern of bilateral tonal tinnitus in association with   ure S1B for more details and other stimulus responses.

1208 Current Biology 25, 1208–1214, May 4, 2015 ª2015 The Authors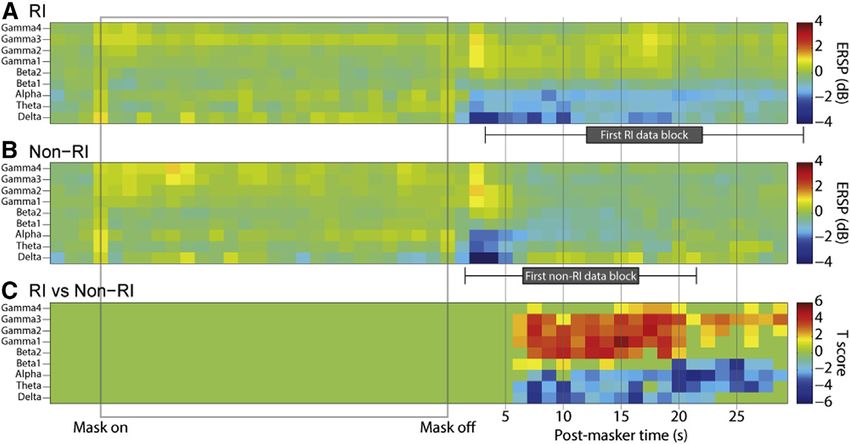
Figure 1. Summary of Experiment
The experiment was performed on 2 days (upper and lower rows). On each day, the experiment was divided into two sessions (left and right columns), separated
by a short break (gap between columns). Time is denoted by the horizontal axis. In each trial of the experiment, a masker was presented lasting 30 s (gray blocks),
followed by four periods in which the subject rated the intensity of his tinnitus (green blocks) that were separated by three silent taskless recording periods of 10 s
each (pale green/white blocks) whose data formed the basis of further analysis. Note that the duration of each session was not fixed, but rather depended on the
sum of response times (green blocks) across a fixed number of repetitions. The rating scale used consisted of integers from 2 to +2 (though the range of
responses given by the subject was 1 to 1, as shown here). A rating of 0 corresponded to the subject’s usual baseline tinnitus intensity, which he confirmed was
the same as it had been immediately before the start of each experiment. Each recording period had a tinnitus rating value assigned to it that was the average of
the ratings immediately preceding and following that period; these ratings were mainly 0.5 (average of 1, preceding, and 0, following) or 0. Data corresponding
to the single rating of +1 (0 pre and +2 post) on day 2 were removed prior to analysis. As tinnitus ratings showed some correlation with overall time elapsed since
the start of the experiment and with time elapsed since the end of the preceding masker, the tinnitus ratings were orthogonalized with respect to these variables,
yielding partial tinnitus ratings. Tinnitus ratings corresponding to each recording period are shown in blue, and the corresponding partial ratings are shown in red.
Note that partial tinnitus ratings have been centered to a mean of zero as part of the partialization process. See also Figure S1 for the subject’s audiological
assessment.

Importance of Locally Synchronized Neural Activity and                               tions that might drive tinnitus. Alternatively, A1 might show
Oscillations                                                                         elevated activity in tinnitus that does not suppress with RI. We
Animal studies measuring correlates of hearing loss and putative                     also saw concordant alpha (8–12 Hz) power decreases, which
behavioral measures of tinnitus have found increased cortical                        are discussed later. The same pattern of delta/theta/alpha sup-
neural synchrony [14] and a possible thalamic origin to this                         pression was seen along the full length of superior temporal
[11]. The equivalent measure in human research is local field po-                    gyrus (STG), posterior middle temporal gyrus (MTG), inferior
tential oscillations, though it is not clear which of the oscillatory                temporal pole (TP), inferior parietal cortex (IPC), and primary
frequency bands measured in humans these relate to. Human                            sensorimotor cortex (S1/M1). In contrast, only A1 responded to
studies have found alterations in the magnitude of all oscillatory                   presentation of a loud tone, matched to the subject’s tinnitus fre-
frequency bands in association with tinnitus, particularly delta/                    quency of 5 kHz. These results are displayed in Figures 2 and
theta (1–4/4–8 Hz) [5–7, 9, 15], alpha (8–12 Hz) [6, 15, 16] and                     S1B. We also examined the time course of oscillatory power
gamma (>30 Hz) [5, 8, 15, 17–19].                                                    changes before, during, and after the presentation of maskers
                                                                                     that did and did not result in sustained RI (Figure 3), which shows
Tinnitus-Linked Low-Frequency Oscillatory Power                                      that these oscillatory power changes occurred rapidly after
Changes                                                                              masker offset, and the difference between RI and non-RI trials
We predicted that tinnitus suppression would correlate with                          was that they lasted longer in RI trials.
reduced delta (1–4 Hz) and/or theta (4–8 Hz) oscillatory power,
thought to be triggered by the thalamocortical tinnitus input [5–                    Long-Range Propagation of Pathological Low-
10, 15]. As expected, we observed delta and theta power de-                          Frequency Oscillations
creases in auditory cortex (Figure 2). These were present in all                     Given the wide anatomical area in which oscillatory power
auditory cortex sites recorded, except for A1. As the division of                    changes were observed, we aimed to establish the pattern of
the human thalamus implicated in tinnitus (the suprageniculate/                      long-range connectivity through which these brain regions inter-
limitans complex [10]) projects to A1 and non-primary auditory                       acted. We examined oscillatory phase coherence between all
cortex [20], A1 could potentially be bypassed by thalamic projec-                    electrode pairs, expressed as phase locking value (PLV) [21].

                                                                                Current Biology 25, 1208–1214, May 4, 2015 ª2015 The Authors 1209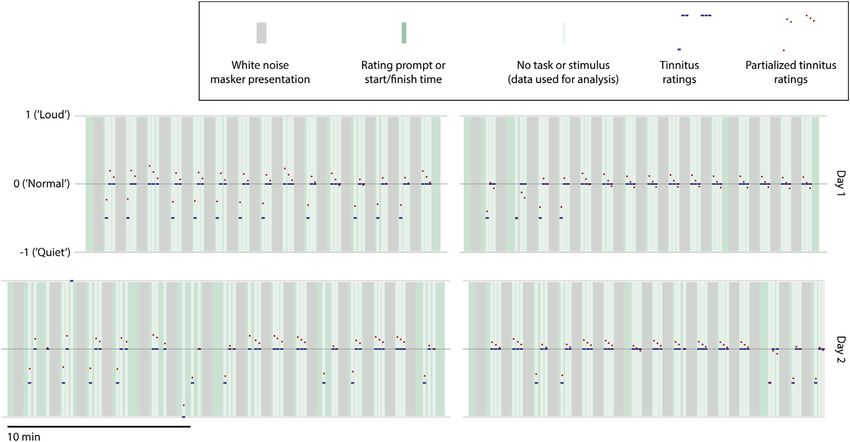
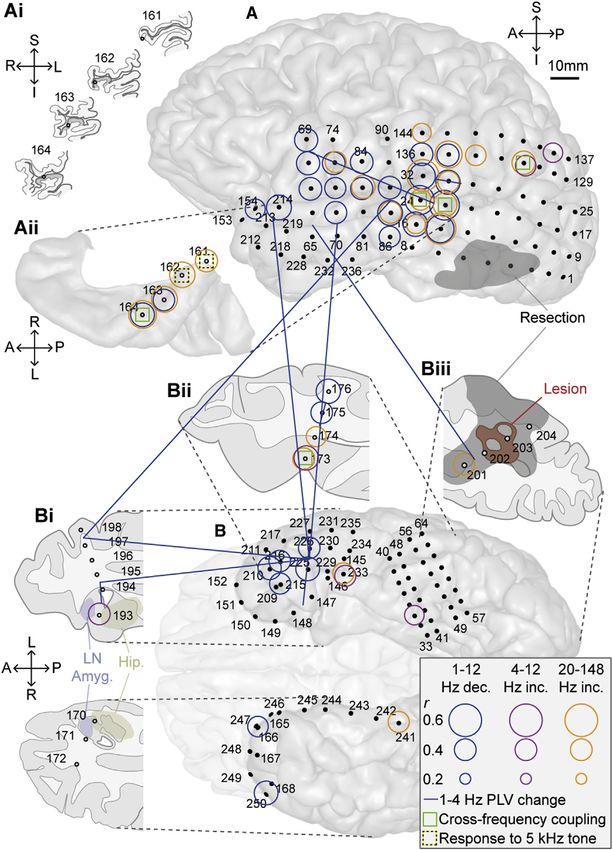
Figure 2. Oscillatory Power and Phase
Coherence Changes with Tinnitus Sup-
pression
Electrode locations are displayed with respect to a
left lateral view of the convexity (A); coronal sec-
tions illustrating the location of depth electrode
contacts with respect to the gray matter of
Heschl’s gyrus (Ai; shown in dark gray); a superior
view of the superior temporal plane centered on
Heschl’s gyrus (Aii); the inferior surface of the
temporal lobes (B); an axial slice through the
anterior temporal lobes (Bi); an axial slice through
the mid to posterior temporal lobe (Bii), with elec-
trodes 173 and 174 in posterior parahippocampal
cortex (PHC); and an axial slice through posterior
temporo-occipital cortex, including the epilepto-
genic lesion (Biii). Axial slices in (Bi), (Bii), and (Biii)
are viewed from their inferior aspects (in keeping
with the view in B). In (Bi), the solid blue area in-
dicates the lateral nucleus of the amygdala, and
the solid yellow area the hippocampus proper,
based on an automated segmentation algorithm
implemented in FreeSurfer (https://surfer.nmr.
mgh.harvard.edu/). In (Biii), the red area repre-
sents the lesion, and the gray area (also in A) rep-
resents the extent of tissue subsequently resected.
Subdural electrodes are represented by solid
black circles and depth electrodes by gray filled
circles. Significant oscillatory power changes
are denoted by colored hollow circles, with circle
radius representing the peak correlation, within
any of the specified frequency bands, between
power and tinnitus suppression. Note that neural
activity changes are displayed on all sections
except (Ai), which is for illustrative purposes only.
Blue, magenta, and orange circles indicate delta/
theta/alpha (1–12 Hz) decreases, theta/alpha (4–
12 Hz) increases, and beta2/gamma (28–148 Hz)
increases, respectively. Phase coherence (PLV)
changes were found only in the delta (1–4 Hz) band
and are represented by solid blue lines. Each PLV
connection was calculated between two bipolar
electrode pairs (each consisting of two adjacent
electrodes), and each end of each line is placed in
between the two electrodes comprising that bi-
polar pair. Green boxes indicate sites where local
cross-frequency coupling correlated significantly
with tinnitus suppression (see Figure 4). Yellow and
black boxes denote electrodes showing induced
oscillatory and steady state responses to tinnitus-
matched tones (see Figure S1B). See also Fig-
ure S2 for a full summary of power changes for
both repetitions of the experiment.
Significant PLV changes, accompanying tinnitus suppression, tions that are (at least in part) the basis of tinnitus perception
were found only in the delta frequency band (Figure 2); these [5, 22]. While there is support for this theory from resting-state
were mainly long range and linked STG with TP, anterior mesial studies, during short-term changes in tinnitus intensity, group-
temporal lobe (aMTL), parahippocampal cortex (PHC), and M1. level changes in gamma power have not been found [7, 9], and
Connections were also found between aMTL and TP. significant individual-level changes have shown both positive
and negative correlations with tinnitus strength [8]. In studies of
Tinnitus-Linked High-Frequency Oscillations normal brain function, gamma oscillations have been associated
The theory of thalamocortical dysrhythmia proposes that the un- with cognition, attention, perception, and prediction errors [23–
derlying tinnitus drive, in the form of low-frequency oscillations, 25]. It remains unclear which of these processes are associated
causes unbalanced lateral inhibition in cortical ‘‘edge’’ regions with tinnitus-related gamma [26], and varying contributions of
between normal areas and those expressing pathological low each could potentially explain the lack of a straightforward asso-
frequency oscillations, leading to high-frequency gamma oscilla- ciation between tinnitus strength and gamma magnitude. We
1210 Current Biology 25, 1208–1214, May 4, 2015 ª2015 The AuthorsFigure 3. Time-Frequency Decomposition
of Oscillatory Power Changes Occurring
during and after Noise Masker Presentation
The horizontal axis represents time, from 5 s before
masker onset, through the 30 s of masker pre-
sentation (gray box), and the 30 s following masker
offset (during some of which the data constituting
the main analyses were captured). Note that the
next masker was presented much later than 30 s
after the end of the present masker and that these
plots simply present the time period during which
most tinnitus suppression occurred. Vertical axes
represent frequency in the same bands as featured
in other analyses and figures. (A) and (B) show
mean power changes, across trials, relative to pre-
masker baseline (i.e., the 5 s before each masker),
expressed as event-related spectral perturbations
(ERSPs; 10 times the base-10 logarithm of the
power to baseline ratio), grouped according to
whether or not the first post-masker tinnitus rating indicated that RI was maintained at that time (RI trials) or had ceased (non-RI trials). Power values shown were
averaged across all electrodes in auditory cortex (HG and STG). (C) shows T scores, for each time-frequency point, of the difference between RI and non-RI trials,
thresholded for significance with a cluster approach at p < 0.05 corrected. During much of the post-masker period, the subject was engaged in the task of giving
ratings of his tinnitus loudness. Periods in which no task was performed (i.e., between one rating and the prompt for the next) were 10 s long, and their position
varied depending on response time. The mean positions of these 10 s data blocks for RI and non-RI trials are indicated by gray boxes underneath the respective
axis, and their SDs are indicated by horizontal error bars. See also Figure S3 for a trial-by-trial representation of peri-masker power changes.
therefore hypothesized that gamma power changes would be we are to consider alpha as a correlate of deviation from a base-
seen during tinnitus suppression but that these could take the line perceptual state (which could reflect silence or ongoing
form of either increases or decreases. A previous PET study us- tinnitus). Alpha oscillation strength also correlates inversely
ing RI found that tinnitus suppression was associated with with attention, and therefore changes in attention (top down or
increased blood flow in MTG and STG [27], which, based on stimulus driven) could affect the relationship between tinnitus
the strong association between local blood flow and gamma os- strength and alpha power. Overall, these findings are not ex-
cillations [28], may suggest increased gamma power in RI and/or plained by a universal inhibitory model of alpha and corroborate
decreased power in lower frequencies. We observed that, during the need for further studies of its role [32].
tinnitus suppression, there were widespread increases in both
gamma (>28 Hz) and beta2 (20–28 Hz) power. These occurred Local Cross-frequency Interactions at Cortical ‘‘Hub’’
throughout all of auditory cortex, including A1, and in other Regions
cortical areas, including MTG, IPC, S1/M1, and PHC (Figures 2 To characterize local interactions between frequency bands,
and S2); they were too extensive and confluent to constitute an which might allow the various neural processes already dis-
‘‘edge effect.’’ The data suggest instead that these gamma cussed to function as a coherent whole [12], we quantified
and beta changes are directly related to the pathological delta changes in the cross-spectral density between the power enve-
activity. lopes of each pair of frequencies (except adjacent frequency
bands) at each electrode. This measure is equivalent to the
Tinnitus-Linked Alpha Oscillations covariance of the two power envelopes, but it captures addi-
A number of studies have shown decreased alpha oscillatory po- tional information, including the phase lag inherent in the
wer and variability (8–12 Hz) in auditory regions as a correlate of coupling. Five electrodes, marked with green boxes in Figure 2,
tinnitus [6, 15, 16, 29], though the opposite has also been seen featured a total of nine tinnitus-linked cross-frequency interac-
[30]. Contrary to expectation, we observed decreased alpha po- tions (Figure 4), which in combination included all frequency
wer with the suppression of tinnitus (i.e., a positive correlation bands from delta to gamma1 (28–44 Hz). In auditory areas (lateral
between alpha power and tinnitus strength) in areas showing HG, which is strongly linked to pitch processing [33, 34], and
delta/theta decreases, with only four separate electrodes posterior STG), tinnitus suppression accompanied increases in
showing alpha increases (Figures 2 and S2), located in anterior delta-alpha coupling and decreases in high-frequency (beta2)
and posterior mesial temporal lobe and IPC. In a study of illusory to low-frequency (delta, theta, and alpha) coupling. Previous re-
percepts after the offset of notched noise (Zwicker tones), which cordings from monkey V1 have found resting-state anti-correla-
may share some underlying mechanisms with tinnitus, a cortical tion (negative covariance) between alpha and high-frequency
network was identified in which alpha power inversely correlated power [35], generated in deep and superficial cortical layers,
with the strength of the illusion [31]; this included primary and respectively. In our subject, baseline tinnitus intensity was asso-
secondary AC, as well as IPC. In the present study, we found a ciated with the opposite pattern (positive coupling between
similar distribution of alpha (along with delta and theta) reduction alpha and higher frequencies), which reversed during tinnitus
during tinnitus suppression. While these findings could be suppression, perhaps indicating a return to a more ‘‘normal’’
considered discordant, in that alpha power has the opposite state. In areas linked to auditory memory (IPC and PHC), positive
relationship with perceptual intensity, they can be reconciled if coupling was observed between theta/alpha and higher (beta2
Current Biology 25, 1208–1214, May 4, 2015 ª2015 The Authors 1211Figure 4. Local Cross-frequency Coupling
Changes Coinciding with Tinnitus Sup-
pression
Polar plots, in the complex plane, of significant
changes in local cross-frequency envelope
coupling as a function of tinnitus suppression. The
five electrodes featured in this figure are high-
lighted with green boxes in Figure 2. In each plot
(as summarized in E) the horizontal axis represents
real-valued (R; non-lagged) coupling, with values
to the right of the origin indicating positive coupling
and to the left negative or anti-coupling. Real-
valued envelope coupling is equivalent to envelope
covariance, and thus an intuitive impression of the
coupling results can be gained by just looking at
the horizontal axis of each plot and ignoring the
vertical. The vertical axis represents imaginary
(I; phase-lagged) coupling, with values above the
origin indicating the lower frequency leading and
below the higher frequency leading. Distance from
the origin indicates the strength of coupling. In
each plot (as illustrated in F), the red dashed circle
and line indicate the magnitude and phase differ-
ence, respectively, of coupling in the baseline
tinnitus state. Blue dashed circles and lines
indicate the magnitude and phase difference,
respectively, of coupling in the suppressed tinnitus
state. These are placed exactly on the equivalent
red circles and lines in cases where magnitude or
angle does not change significantly. These circles
and lines indicate the state of coupling during
the maximum partial suppression generally seen
during the experiment. Bold arrows indicate the
projected path of coupling with increasing tinnitus
suppression, based on polar coordinate interpo-
lation between the baseline and suppressed
states. The number by each plot indicates the
electrode number at which coupling is illustrated,
and the Greek letters show which frequency bands
the coupling being illustrated is between. HG,
Heschl’s gyrus (A); PHC, parahippocampal cortex
(B); STG, superior temporal gyrus (C); IPC, inferior
parietal cortex (D). See also Figure S4, for a sum-
mary of cross-frequency coupling changes in the
context of other neural activity changes.
nities are limited in humans, aspects of
the present approach could be imple-
mented in animal studies through the
use of widespread simultaneous cortical
recordings. RI could in principle also be
and gamma1) frequencies, which became stronger when tinnitus used in animals. The consistent relationship between delta/theta
was suppressed. oscillations and tinnitus intensity in this and other studies sup-
ports these oscillations as a neural correlate of tinnitus that might
Future Directions of Research be further investigated mechanistically in animal models. The
While derived from a single case, the present findings generally relevance of other frequency bands to tinnitus, however, re-
concord well, where applicable, to the more reproducible parts quires further clarification, and we suggest a possible model
of the human tinnitus literature and to those of the one existing below.
human intracranial case study of tinnitus [36]. There remains a
need for replication of these findings in other similar cases A Working Hypothesis of Interacting Tinnitus
and, where possible, to examine other cortical areas not pres- Sub-networks
ently sampled (such as precuneus, lateral prefrontal cortex, Figure S4 summarizes the tinnitus-linked neural activity changes
and several divisions of cingulate cortex). While these opportu- identified in this study, along with their putative roles with respect
1212 Current Biology 25, 1208–1214, May 4, 2015 ª2015 The Authorsto tinnitus. Examination of these findings suggests the possibility cance threshold of p < 0.05. A time-frequency decomposition was also
of three separate tinnitus ‘‘sub-networks,’’ each manifest in a performed within all auditory cortex electrodes, over the peri-masker time
period. External auditory stimulation, with tinnitus-matched and other simple
different frequency band, which interact in specific sites through
stimuli, was also performed, on separate days from the RI experiments. See
cross-frequency coupling. One of these sub-networks is charac- the Supplemental Experimental Procedures for further details.
terized by widespread changes in delta (and theta/alpha) power
and delta coherence (blue in Figures 2 and S4), thereby repre- SUPPLEMENTAL INFORMATION
senting propagation of the delta-band signal, which is hypothe-
sized to be a consequence of aberrant thalamic input. We thus Supplemental Information includes Supplemental Discussion, Supplemental
refer to this as the ‘‘tinnitus driving network.’’ It appears that Experimental Procedures, and four figures and can be found with this article
non-primary auditory cortex in STG has a particularly crucial online at http://dx.doi.org/10.1016/j.cub.2015.02.075.
role in coordinating long-range communication in this network.
AUTHOR CONTRIBUTIONS
The second sub-network is tightly localized to areas implicated
in auditory memory, namely parahippocampal and inferior parie- W.S. and P.E.G. contributed equally to this work and are joint-first authors. The
tal cortex [12, 37], and is characterized by increases in alpha subject was identified and recruited by M.A.H. Clinical and audiological
(±theta) power (magenta in Figures 2 and S4) during tinnitus sup- assessment was performed by P.E.G. and T.D.G. Electrode implantation
pression that are inverse to changes seen within the tinnitus was performed by M.A.H. and H.K. Experiments were designed by W.S.,
P.E.G., S.K., and T.D.G., run by P.E.G., and coordinated by K.V.N. Electro-
driving network. We putatively suggest that this network relates
physiologic data were analyzed by W.S. with input from P.E.G., C.K.K., and
to tinnitus-linked mnemonic processes, such as encoding or
S.K. Anatomical data were processed and illustrated by H.O., C.K.K., and
retrieval of the percept, or comparison to previous auditory W.S. The manuscript was prepared by W.S. with input from all other authors.
memories. We refer to this as the ‘‘tinnitus memory network.’’
Finally, a moderately widespread sub-network is characterized ACKNOWLEDGMENTS
by changes in high-frequency (orange in Figures 2 and S4)
beta and gamma power (representing perceptual information W.S. is funded by Medical Research Council UK grant MR/J011207/1. P.E.G.
and T.D.G. are funded by Wellcome Trust grant WT091681MA. Research took
processing [23], which may include predictive models and
place at the Human Brain Research Laboratory, University of Iowa, which is
prediction errors [25, 38]). We therefore propose that this sub- funded by NIH grants R01-DC004290 and UL1RR024979, the Hearing Health
network represents the real-time encoding of changes to the Foundation, and the Hoover Fund. We thank Haiming Chen for assistance with
tinnitus percept and thus highlights the signatures of neural ac- data acquisition and Dr. Rich Tyler for clinical audiological assessment.
tivity that are the most closely linked to the subjective experience
of tinnitus itself. We refer to this as the ‘‘tinnitus perception Received: September 29, 2014
network.’’ Notably, the sites of cross-frequency interaction Revised: February 10, 2015
Accepted: February 27, 2015
(green in Figures 2 and S4) linking these possible sub-networks
Published: April 23, 2015
(auditory cortex, PHC, and IPC) closely resemble the layout of a
recently-speculated ‘‘tinnitus core’’ network [12], comprising the REFERENCES
minimum neural ensemble required for conscious tinnitus
perception. The same model proposes that this kind of local 1. Jastreboff, P.J. (1990). Phantom auditory perception (tinnitus): mecha-
cross-frequency interaction is a fundamental organizing princi- nisms of generation and perception. Neurosci. Res. 8, 221–254.
ple of cortical tinnitus networks. Thus, our findings provide direct 2. Roberts, L.E., Eggermont, J.J., Caspary, D.M., Shore, S.E., Melcher, J.R.,
and Kaltenbach, J.A. (2010). Ringing ears: the neuroscience of tinnitus.
support for both the anatomical and physiological aspects of this
J. Neurosci. 30, 14972–14979.
hypothesis and go further in revealing the detailed workings of
3. Noreña, A.J., and Farley, B.J. (2013). Tinnitus-related neural activity:
such a ‘‘tinnitus system’’ through which the low-frequency
theories of generation, propagation, and centralization. Hear. Res. 295,
tinnitus input signal propagates spatially, across the cortex, 161–171.
and spectrally, across frequency bands, so as to lead to a 4. Roberts, L.E. (2007). Residual inhibition. Prog. Brain Res. 166, 487–495.
perceived auditory entity. 5. Llinás, R.R., Ribary, U., Jeanmonod, D., Kronberg, E., and Mitra, P.P.
(1999). Thalamocortical dysrhythmia: A neurological and neuropsychiatric
EXPERIMENTAL PROCEDURES syndrome characterized by magnetoencephalography. Proc. Natl. Acad.
Sci. USA 96, 15222–15227.
While undergoing invasive electrode monitoring, the tinnitus subject partici- 6. Weisz, N., Moratti, S., Meinzer, M., Dohrmann, K., and Elbert, T. (2005).
pated in identical RI experiments [4, 8], on two separate days, in which he Tinnitus perception and distress is related to abnormal spontaneous brain
was periodically presented noise maskers in between which he gave periodic activity as measured by magnetoencephalography. PLoS Med. 2, e153.
ratings of his current tinnitus loudness. Electrocorticography data recorded in 7. Kahlbrock, N., and Weisz, N. (2008). Transient reduction of tinnitus intensity
between maskers and ratings were compared with contemporaneous tinnitus is marked by concomitant reductions of delta band power. BMC Biol. 6, 4.
ratings. The study was approved by the University of Iowa Institutional Review
8. Sedley, W., Teki, S., Kumar, S., Barnes, G.R., Bamiou, D.-E., and Griffiths,
Board, and written informed consent was obtained from the subject prior to
T.D. (2012). Single-subject oscillatory g responses in tinnitus. Brain 135,
any experimentation. The following neural activity metrics were calculated
3089–3100.
and expressed as a function of tinnitus suppression: (1) oscillatory power at
every electrode in each frequency band; (2) long-range phase coherence 9. Adjamian, P., Sereda, M., Zobay, O., Hall, D.A., and Palmer, A.R. (2012).
(phase locking value [21]), between every possible pair of electrodes, in Neuromagnetic indicators of tinnitus and tinnitus masking in patients
each frequency band; and (3) local cross-frequency coupling, at each elec- with and without hearing loss. J. Assoc. Res. Otolaryngol. 13, 715–731.
trode, between the power envelopes of every possible pair of frequency bands 10. Jeanmonod, D., Magnin, M., and Morel, A. (1996). Low-threshold calcium
(except adjacent bands). Statistical analysis was performed with a permuta- spike bursts in the human thalamus. Common physiopathology for sen-
tion approach, intrinsically corrected for multiple comparisons, with a signifi- sory, motor and limbic positive symptoms. Brain 119, 363–375.
Current Biology 25, 1208–1214, May 4, 2015 ª2015 The Authors 121311. Kalappa, B.I., Brozoski, T.J., Turner, J.G., and Caspary, D.M. (2014). 25. Arnal, L.H., and Giraud, A.-L. (2012). Cortical oscillations and sensory pre-
Single unit hyperactivity and bursting in the auditory thalamus of awake dictions. Trends Cogn. Sci. 16, 390–398.
rats directly correlates with behavioural evidence of tinnitus. J. Physiol. 26. Sedley, W., and Cunningham, M.O. (2013). Do cortical gamma oscillations
592, 5065–5078. promote or suppress perception? An under-asked question with an over-
12. De Ridder, D., Vanneste, S., Weisz, N., Londero, A., Schlee, W., Elgoyhen, assumed answer. Front. Hum. Neurosci. 7, 595.
A.B., and Langguth, B. (2014). An integrative model of auditory phantom 27. Osaki, Y., Nishimura, H., Takasawa, M., Imaizumi, M., Kawashima, T.,
perception: tinnitus as a unified percept of interacting separable subnet- Iwaki, T., Oku, N., Hashikawa, K., Doi, K., Nishimura, T., et al. (2005).
works. Neurosci. Biobehav. Rev. 44, 16–32. Neural mechanism of residual inhibition of tinnitus in cochlear implant
13. Roberts, L.E., Moffat, G., Baumann, M., Ward, L.M., and Bosnyak, D.J. users. Neuroreport 16, 1625–1628.
(2008). Residual inhibition functions overlap tinnitus spectra and the region 28. Mukamel, R., Gelbard, H., Arieli, A., Hasson, U., Fried, I., and Malach, R.
of auditory threshold shift. J. Assoc. Res. Otolaryngol. 9, 417–435. (2005). Coupling between neuronal firing, field potentials, and FMRI in hu-
14. Eggermont, J.J. (2013). Hearing loss, hyperacusis, or tinnitus: what is man auditory cortex. Science 309, 951–954.
modeled in animal research? Hear. Res. 295, 140–149. 29. Schlee, W., Schecklmann, M., Lehner, A., Kreuzer, P.M., Vielsmeier, V.,
15. Tass, P.A., Adamchic, I., Freund, H.-J., von Stackelberg, T., and Poeppl, T.B., and Langguth, B. (2014). Reduced variability of auditory
Hauptmann, C. (2012). Counteracting tinnitus by acoustic coordinated alpha activity in chronic tinnitus. Neural Plast. 2014, 436146.
reset neuromodulation. Restor. Neurol. Neurosci. 30, 137–159. 30. Moazami-Goudarzi, M., Michels, L., Weisz, N., and Jeanmonod, D. (2010).
Temporo-insular enhancement of EEG low and high frequencies in pa-
16. Dohrmann, K., Elbert, T., Schlee, W., and Weisz, N. (2007). Tuning the
tients with chronic tinnitus. QEEG study of chronic tinnitus patients.
tinnitus percept by modification of synchronous brain activity. Restor.
BMC Neurosci. 11, 40.
Neurol. Neurosci. 25, 371–378.
31. Leske, S., Tse, A., Oosterhof, N.N., Hartmann, T., Müller, N., Keil, J., and
17. Weisz, N., Müller, S., Schlee, W., Dohrmann, K., Hartmann, T., and Elbert,
Weisz, N. (2013). The strength of alpha and beta oscillations parametrically
T. (2007). The neural code of auditory phantom perception. J. Neurosci.
scale with the strength of an illusory auditory percept. Neuroimage 88C,
27, 1479–1484.
69–78.
18. Ashton, H., Reid, K., Marsh, R., Johnson, I., Alter, K., and Griffiths, T.
32. Weisz, N., Hartmann, T., Müller, N., Lorenz, I., and Obleser, J. (2011).
(2007). High frequency localised ‘‘hot spots’’ in temporal lobes of patients
Alpha rhythms in audition: cognitive and clinical perspectives. Front.
with intractable tinnitus: a quantitative electroencephalographic (QEEG)
Psychol. 2, 73.
study. Neurosci. Lett. 426, 23–28.
33. Patterson, R.D., Uppenkamp, S., Johnsrude, I.S., and Griffiths, T.D.
19. Balkenhol, T., Wallhäusser-Franke, E., and Delb, W. (2013).
(2002). The processing of temporal pitch and melody information in audi-
Psychoacoustic tinnitus loudness and tinnitus-related distress show
tory cortex. Neuron 36, 767–776.
different associations with oscillatory brain activity. PLoS ONE 8, e53180.
34. Penagos, H., Melcher, J.R., and Oxenham, A.J. (2004). A neural represen-
20. Hackett, T.A., Stepniewska, I., and Kaas, J.H. (1998). Thalamocortical tation of pitch salience in nonprimary human auditory cortex revealed with
connections of the parabelt auditory cortex in macaque monkeys. functional magnetic resonance imaging. J. Neurosci. 24, 6810–6815.
J. Comp. Neurol. 400, 271–286.
35. Spaak, E., Bonnefond, M., Maier, A., Leopold, D.A., and Jensen, O. (2012).
21. Lachaux, J.P., Rodriguez, E., Martinerie, J., and Varela, F.J. (1999). Layer-specific entrainment of g-band neural activity by the a rhythm in
Measuring phase synchrony in brain signals. Hum. Brain Mapp. 8, monkey visual cortex. Curr. Biol. 22, 2313–2318.
194–208.
36. De Ridder, D., van der Loo, E., Vanneste, S., Gais, S., Plazier, M., Kovacs,
22. Llinás, R., Urbano, F.J., Leznik, E., Ramı́rez, R.R., and van Marle, H.J.F. S., Sunaert, S., Menovsky, T., and van de Heyning, P. (2011). Theta-
(2005). Rhythmic and dysrhythmic thalamocortical dynamics: GABA gamma dysrhythmia and auditory phantom perception. J. Neurosurg.
systems and the edge effect. Trends Neurosci. 28, 325–333. 114, 912–921.
23. Tallon-Baudry, C., and Bertrand, O. (1999). Oscillatory gamma activity 37. De Ridder, D., Elgoyhen, A.B., Romo, R., and Langguth, B. (2011).
in humans and its role in object representation. Trends Cogn. Sci. 3, Phantom percepts: tinnitus and pain as persisting aversive memory net-
151–162. works. Proc. Natl. Acad. Sci. USA 108, 8075–8080.
24. Ray, S., Niebur, E., Hsiao, S.S., Sinai, A., and Crone, N.E. (2008). High-fre- 38. Bastos, A.M., Usrey, W.M., Adams, R.A., Mangun, G.R., Fries, P., and
quency gamma activity (80-150Hz) is increased in human cortex during Friston, K.J. (2012). Canonical microcircuits for predictive coding.
selective attention. Clin. Neurophysiol. 119, 116–133. Neuron 76, 695–711.
1214 Current Biology 25, 1208–1214, May 4, 2015 ª2015 The AuthorsYou can also read