Introduction - Fairness and machine learning
←
→
Page content transcription
If your browser does not render page correctly, please read the page content below
fairness and machine learning - 2021-06-16                 1

1

Introduction

   Our success, happiness, and wellbeing are never fully of our
own making. Others’ decisions can profoundly affect the course of
our lives: whether to admit us to a particular school, offer us a job,
or grant us a mortgage. Arbitrary, inconsistent, or faulty decision-
making thus raises serious concerns because it risks limiting our
ability to achieve the goals that we have set for ourselves and access
the opportunities for which we are qualified.
   So how do we ensure that these decisions are made the right
way and for the right reasons? While there’s much to value in fixed
rules, applied consistently, good decisions take available evidence into
account. We expect admissions, employment, and lending decisions
to rest on factors that are relevant to the outcome of interest.
   Identifying details that are relevant to a decision might happen
informally and without much thought: employers might observe
that people who study math seem to perform particularly well
in the financial industry. But they could test these observations
against historical evidence by examining the degree to which one’s
major correlates with success on the job. This is the traditional work
of statistics—and it promises to provide a more reliable basis for
decision-making by quantifying how much weight to assign certain
details in our determinations.
   Decades of research have compared the accuracy of statistical
models to the judgments of humans, even experts with years of
experience, and found that in many situations data-driven decisions        1
                                                                             Dawes, Faust, and Meehl, “Clinical
trounce those based on intuition or expertise.1 These results have         Versus Actuarial Judgment,” Science 243,
been welcomed as a way to ensure that the high-stakes decisions that       no. 4899 (1989): 1668–74.
shape our life chances are both accurate and fair.
   Machine learning promises to bring greater discipline to decision-
making because it offers to uncover factors that are relevant to
decision-making that humans might overlook, given the complex-
ity or subtlety of the relationships in historical evidence. Rather than
starting with some intuition about the relationship between certain
factors and an outcome of interest, machine learning lets us defer
the question of relevance to the data themselves: which factors—
among all that we have observed—bear a statistical relationship to
the outcome.
   Uncovering patterns in historical evidence can be even more
2 solon barocas, moritz hardt, arvind narayanan powerful than this might seem to suggest. Recent breakthroughs in computer vision—specifically object recognition—reveal just how much pattern-discovery can achieve. In this domain, machine learn- ing has helped to overcome a strange fact of human cognition: while we may be able to effortlessly identify objects in a scene, we are un- able to specify the full set of rules that we rely upon to make these determinations. We cannot hand code a program that exhaustively enumerates all the relevant factors that allow us to recognize objects from every possible perspective or in all their potential visual config- urations. Machine learning aims to solve this problem by abandoning the attempt to teach a computer through explicit instruction in favor of a process of learning by example. By exposing the computer to many examples of images containing pre-identified objects, we hope the computer will learn the patterns that reliably distinguish different objects from one another and from the environments in which they appear. This can feel like a remarkable achievement, not only because computers can now execute complex tasks but also because the rules for deciding what appears in an image seem to emerge from the data themselves. But there are serious risks in learning from examples. Learning is not a process of simply committing examples to memory. Instead, it involves generalizing from examples: honing in on those details that are characteristic of (say) cats in general, not just the specific cats that happen to appear in the examples. This is the process of induction: drawing general rules from specific examples—rules that effectively account for past cases, but also apply to future, as yet unseen cases, too. The hope is that we’ll figure out how future cases are likely to be similar to past cases, even if they are not exactly the same. This means that reliably generalizing from historical examples to future cases requires that we provide the computer with good examples: a sufficiently large number of examples to uncover subtle patterns; a sufficiently diverse set of examples to showcase the many different types of appearances that objects might take; a sufficiently well-annotated set of examples to furnish machine learning with reliable ground truth; and so on. Thus, evidence-based decision- making is only as reliable as the evidence on which it is based, and high quality examples are critically important to machine learning. The fact that machine learning is “evidence-based” by no means ensures that it will lead to accurate, reliable, or fair decisions. This is especially true when using machine learning to model human behavior and characteristics. Our historical examples of the relevant outcomes will almost always reflect historical prejudices against certain social groups, prevailing cultural stereotypes, and
fairness and machine learning - 2021-06-16               3

existing demographic inequalities. And finding patterns in these data
will often mean replicating these very same dynamics.
   We write this book as machine learning begins to play a role in
especially consequential decision-making. In the criminal justice
system, defendants are assigned statistical scores that are intended to
predict the risk of committing future crimes, and these scores inform
decisions about bail, sentencing, and parole. In the commercial
sphere, firms use machine learning to analyze and filter resumes of
job applicants. And statistical methods are of course the bread and
butter of lending, credit, and insurance underwriting.
   At the same time, machine learning powers everyday applica-
tions that might seem frivolous in comparison but collectively have a
powerful effect on shaping our culture: search engines, news recom-
menders, and ad targeting algorithms influence our information diet
and our worldviews; chatbots and social recommendation engines
mediate our interactions with the world.
   This book is an attempt to survey the risks in these and many
other applications of machine learning, and to provide a critical
review of an emerging set of proposed solutions. It will show how
even well-intentioned applications of machine learning might give
rise to objectionable results. And it will introduce formal methods
for characterizing these problems and assess various computational
methods for addressing them.

Demographic disparities

Amazon uses a data-driven system to determine the neighborhoods           2
                                                                            We don’t know the details of how
in which to offer free same-day delivery.2 A 2016 study found stark       Amazon’s system works, and in par-
disparities in the demographic makeup of these neighborhoods: in          ticular we don’t know to what extent
                                                                          it uses machine learning. The same is
many U.S. cities, white residents were more than twice as likely as       true of many other systems reported
Black residents to live in one of the qualifying neighborhoods.3          on in the press. Nonetheless, we’ll use
                                                                          these as motivating examples when a
    In Chapter 2 we’ll see how to make our intuition about demo-          machine learning system for the task at
graphic disparities mathematically precise, and we’ll see that there      hand would plausibly show the same
are many possible ways of measuring these inequalities. The perva-        behavior.
                                                                          3
                                                                            Ingold and Soper, “Amazon Doesn’t
siveness of such disparities in machine learning applications is a key    Consider the Race of Its Customers.
concern of this book.                                                     Should It?” (https://www.bloomberg.
                                                                          com/graphics/2016-amazon-same-day/,
    When we observe disparities, it doesn’t imply that the designer of    2016).
the system intended for such inequalities to arise. Looking beyond
intent, it’s important to understand when observed disparities can
be considered to be discrimination. In turn, two key questions to ask
are whether the disparities are justified and whether they are harm-
ful. These questions rarely have simple answers, but the extensive
literature on discrimination in philosophy and sociology can help us
reason about them.
4 solon barocas, moritz hardt, arvind narayanan To understand why the racial disparities in Amazon’s system might be harmful, we must keep in mind the history of racial preju- dice in the United States, its relationship to geographic segregation and disparities, and the perpetuation of those inequalities over time. Amazon argued that its system was justified because it was designed based on efficiency and cost considerations and that race wasn’t an explicit factor. Nonetheless, it has the effect of providing different opportunities to consumers at racially disparate rates. The concern is that this might contribute to the perpetuation of long-lasting cycles of inequality. If, instead, the system had been found to be partial to ZIP codes ending in an odd digit, it would not have triggered a similar outcry. The term bias is often used to refer to demographic disparities in algorithmic systems that are objectionable for societal reasons. We’ll avoid using this sense of the word bias in this book, since it means different things to different people. There’s a more traditional use of the term bias in statistics and machine learning. Suppose that Amazon’s estimates of delivery dates/times were consistently too early by a few hours. This would be a case of statistical bias. A statistical estimator is said to be biased if its expected or average value differs from the true value that it aims to estimate. Statistical bias is a fundamental concept in statistics, and there is a rich set of established techniques for analyzing and avoiding it. There are many other measures that quantify desirable statistical properties of a predictor or an estimator, such as precision, recall, and calibration. These are similarly well understood; none of them require any knowledge of social groups and are relatively straightfor- ward to measure. The attention to demographic criteria in statistics and machine learning is a relatively new direction. This reflects a change in how we conceptualize machine learning systems and the responsibilities of those building them. Is our goal to faithfully reflect the data? Or do we have an obligation to question the data, and to design our systems to conform to some notion of equitable behavior, regardless of whether or not that’s supported by the data currently available to us? These perspectives are often in tension, and the differ- ence between them will become clearer when we delve into stages of machine learning. The machine learning loop Let’s study the pipeline of machine learning and understand how demographic disparities propagate through it. This approach lets us glimpse into the black box of machine learning and will prepare us for the more detailed analyses in later chapters. Studying the stages
fairness and machine learning - 2021-06-16                 5

of machine learning is crucial if we want to intervene to minimize
disparities.
   The figure below shows the stages of a typical system that pro-
duces outputs using machine learning. Like any such diagram, it is a
simplification, but it is useful for our purposes.

                                                                             Figure 1: The machine learning loop

    The first stage is measurement, which is the process by which
the state of the world is reduced to a set of rows, columns, and
values in a dataset. It’s a messy process, because the real world is
messy. The term measurement is misleading, evoking an image of a
dispassionate scientist recording what she observes, whereas we’ll
see that it requires subjective human decisions.
    The ‘learning’ in machine learning refers to the next stage, which
is to turn that data into a model. A model summarizes the patterns
in the training data; it makes generalizations. A model could be
trained using supervised learning via an algorithm such as Support
Vector Machines, or using unsupervised learning via an algorithm
such as k-means clustering. It could take many forms: a hyperplane
or a set of regions in n-dimensional space, or a set of distributions. It
is typically represented as a set of weights or parameters.
    The next stage is the action we take based on the model’s predic-
tions, which are applications of the model to new, unseen inputs.
‘Prediction’ is another misleading term—while it does sometimes
involve trying to predict the future (“is this patient at high risk for
cancer?”), usually it doesn’t. It can take the form of classification (de-
termine whether a piece of email is spam), regression (assigning risk
scores to defendants), or information retrieval (finding documents
that best match a search query).
    The corresponding actions in these three applications might be:
depositing the email in the user’s inbox or spam folder, deciding
whether to set bail for the defendant’s pre-trial release, and display-
ing the retrieved search results to the user. They may differ greatly in
their significance to the individual, but they have in common that the
collective responses of individuals to these decisions alter the state of
the world—that is, the underlying patterns that the system aims to
6 solon barocas, moritz hardt, arvind narayanan
model.
Some machine learning systems record feedback from users (how
users react to actions) and use them to refine the model. For example,
search engines track what users click on as an implicit signal of
relevance or quality. Feedback can also occur unintentionally, or even
adversarially; these are more problematic, as we’ll explore later in
this chapter.
The state of society
In this book, we’re concerned with applications of machine learning
that involve data about people. In these applications, the available
training data will likely encode the demographic disparities that
exist in our society. For example, the figure shows the gender break-
down of a sample of occupations in the United States, based on data 4
The percentage of women in a sample
released by the Bureau of Labor Statistics for the year 2017.4 of occupations in the United States.
Unsurprisingly, many occupations have stark gender imbalances. The area of the bubble represents the
number of workers.
If we’re building a machine learning system that screens job can-
didates, we should be keenly aware that this is the baseline we’re
starting from. It doesn’t necessarily mean that the outputs of our sys-
tem will be inaccurate or discriminatory, but throughout this chapter
we’ll see how it complicates things.
Why do these disparities exist? There are many potentially con-
tributing factors, including a history of explicit discrimination, im-
plicit attitudes and stereotypes about gender, and differences in
the distribution of certain characteristics by gender. We’ll see that
even in the absence of explicit discrimination, stereotypes can be
self-fulfilling and persist for a long time in society. As we integrate
machine learning into decision-making, we should be careful to
ensure that ML doesn’t become a part of this feedback loop.
What about applications that aren’t about people? Consider
“Street Bump,” a project by the city of Boston to crowdsource data on
potholes. The smartphone app automatically detects pot holes using
data from the smartphone’s sensors and sends the data to the city.
Infrastructure seems like a comfortably boring application of data-
driven decision-making, far removed from the ethical quandaries
we’ve been discussing.
And yet! Kate Crawford points out that the data reflect the pat-
terns of smartphone ownership, which are higher in wealthier parts
of the city compared to lower-income areas and areas with large
elderly populations.5 5
Crawford, “The Hidden Biases in Big
The lesson here is that it’s rare for machine learning applications Data,” Harvard Business Review 1 (2013).
to not be about people. In the case of Street Bump, the data is col-
lected by people, and hence reflects demographic disparities; besides,fairness and machine learning - 2021-06-16 7
the reason we’re interested in improving infrastructure in the first
place is its effect on people’s lives.
To drive home the point that most machine learning applications
involve people, we analyzed Kaggle, a well-known platform for data
science competitions. We focused on the top 30 competitions sorted
by prize amount. In 14 of these competitions, we observed that the
task is to make decisions about individuals. In most of these cases,
there exist societal stereotypes or disparities that may be perpetuated
by the application of machine learning. For example, the Automated 6
Kaggle, “The Hewlett Foundation:
Essay Scoring6 task seeks algorithms that attempt to match the scores Automated Essay Scoring” (https:
of human graders of student essays. Students’ linguistic choices are //www.kaggle.com/c/asap-aes, 2012).
signifiers of social group membership, and human graders are known 7
Hanna and Linden, “Discrimination
to sometimes have prejudices based on such factors.7 Thus, because in Grading,” American Economic Journal:
human graders must provide the original labels, automated grading Economic Policy 4, no. 4 (2012): 146–68;
Sprietsma, “Discrimination in Grading:
systems risk enshrining any such biases that are captured in the
Experimental Evidence from Primary
training data. School Teachers,” Empirical Economics
In a further 5 of the 30 competitions, the task did not call for mak- 45, no. 1 (2013): 523–38.
ing decisions about people, but decisions made using the model
would nevertheless directly impact people. For example, one compe-
tition sponsored by real-estate company Zillow calls for improving
the company’s “Zestimate” algorithm for predicting home sale prices.
Any system that predicts a home’s future sale price (and publicizes
these predictions) is likely to create a self-fulfilling feedback loop in
which homes predicted to have lower sale prices deter future buyers,
suppressing demand and lowering the final sale price.
In 9 of the 30 competitions, we did not find an obvious, direct
impact on people, such as a competition on predicting ocean health
(of course, even such competitions have indirect impacts on people,
due to actions that we might take on the basis of the knowledge
gained). In two cases, we didn’t have enough information to make a
determination.
To summarize, human society is full of demographic disparities,
and training data will likely reflect these. We’ll now turn to the
process by which training data is constructed, and see that things are
even trickier.
The trouble with measurement
The term measurement suggests a straightforward process, calling to
mind a camera objectively recording a scene. In fact, measurement is
fraught with subjective decisions and technical difficulties.
Consider a seemingly straightforward task: measuring the demo-
graphic diversity of college campuses. A recent New York Times
article aimed to do just this, and was titled “Even With Affirmative8 solon barocas, moritz hardt, arvind narayanan
Action, Blacks and Hispanics Are More Underrepresented at Top Col- 8
Ashkenas, Park, and Pearce,
leges Than 35 Years Ago.”8 The authors argue that the gap between “Even with Affirmative Action,
enrolled Black and Hispanic freshmen and the Black and Hispanic Blacks and Hispanics Are More
Underrepresented at Top Col-
college-age population has grown over the past 35 years. To support
leges Than 35 Years Ago” (https:
their claim, they present demographic information for more than //www.nytimes.com/interactive/2017/
100 American universities and colleges from the year 1980 to 2015, 08/24/us/affirmative-action.html,
2017).
and show how the percentages of Black, Hispanic, Asian, White,
and multiracial students have changed over the years. Interestingly,
the multiracial category was only recently introduced in 2008, but
the comparisons in the article ignore the introduction of this new
category. How many students who might have checked the “White”
or “Black” box checked the “multiracial” box instead? How might
this have affected the percentages of “White” and “Black” students at
these universities? Furthermore, individuals’ and society’s conception
of race changes over time. Would a person with Black and Latino
parents be more inclined to self-identify as Black in 2015 than in
the 1980s? The point is that even a seemingly straightforward ques-
tion about trends in demographic diversity is impossible to answer
without making some assumptions, and illustrates the difficulties
of measurement in a world that resists falling neatly into a set of
checkboxes. Race is not a stable category; how we measure race often
changes how we conceive of it, and changing conceptions of race may
force us to alter what we measure.
To be clear, this situation is typical: measuring almost any attribute
about people is similarly subjective and challenging. If anything,
things are more chaotic when machine learning researchers have to
create categories, as is often the case.
One area where machine learning practitioners often have to 9
Barocas and Selbst, “Big Data’s
define new categories is in defining the target variable.9 This is the Disparate Impact,” UCLA Law Review,
outcome that we’re trying to predict – will the defendant recidivate 2016.
if released on bail? Will the candidate be a good employee if hired?
And so on.
Biases in the training set’s target variable are especially critical, be-
cause they are guaranteed to bias the predictions (not necessarily so
with other attributes). But the target variable is arguably the hardest
from a measurement standpoint, because it is often a construct that
is made up for the purposes of the problem at hand rather than one
that is widely understood and measured. For example, “creditworthi-
ness” is a construct that was created in the context of the problem of 10
Barocas and Selbst.
how to successfully extend credit to consumers;10 it is not an intrinsic
property that people either possess or lack.
If our target variable is the idea of a “good employee,” we might
use performance review scores to quantify it. This means that our
data inherits any biases present in managers’ evaluations of their re-fairness and machine learning - 2021-06-16 9
ports. Another example: the use of computer vision to automatically 11
Plaugic, “FaceApp’s Creator Apol-
rank people’s physical attractiveness.11 The training data consists ogizes for the App’s Skin-Lightening
of human evaluation of attractiveness, and, unsurprisingly, all these ’Hot’ Filter” (The Verge. https://www.
theverge.com/2017/4/25/15419522/
classifiers showed a preference for lighter skin.
faceapp-hot-filter-racist-apology,
In some cases we might be able to get closer to a more objective 2017); Manthorpe, “The
definition for a target variable, at least in principle. For example, in Beauty.AI Robot Beauty Con-
test Is Back” (Wired UK. https:
criminal risk assessment, the training data is not judges’ decisions //www.wired.co.uk/article/
on who should get bail, but rather based on who actually went on to robot-beauty-contest-beauty-ai,
2017).
commit a crime. But there’s at least one big caveat—we can’t really
measure who committed a crime, so we use arrests as a proxy. This
replaces the biases of judges with the biases of policing. On the
other hand, if our target variable is whether the defendant appears
or fails to appear in court for trial, we would be able to measure it
directly with perfect accuracy. That said, we may still have concerns
about a system that treats defendants differently based on predicted
probability of appearance, given that some reasons for failing to
appear are less objectionable than others (trying to hold down a job
that would not allow for time off versus trying to avoid prosecution).
In hiring, instead of relying on performance reviews for (say) a
sales job, we might rely on the number of sales closed. But is that an
objective measurement or is it subject to the biases of the potential
customers (who might respond more positively to certain salespeople
than others) and workplace conditions (which might be a hostile
environment for some, but not others)?
In some applications, researchers repurpose an existing scheme
of classification to define the target variable rather than creating
one from scratch. For example, an object recognition system can be
created by training a classifier on ImageNet, a database of images 12
Deng et al., “ImageNet: A Large-
organized in a hierarchy of concepts.12 ImageNet’s hierarchy comes Scale Hierarchical Image Database,” in
from Wordnet, a database of words, categories, and the relationships Proc. CVPR, 2009.
among them.13 Wordnet’s authors in turn imported the word lists
13
Miller, “WordNet: A Lexical Database
for English,” Communications of the ACM
from a number of older sources, such as thesauri. As a result, Word- 38, no. 11 (1995): 39–41.
Net (and ImageNet) categories contain numerous outmoded words
and associations, such as occupations that no longer exist and stereo-
typed gender associations. Thus, ImageNet-trained object recognition
systems assume a categorization of the world that is mismatched
with the world in which they operate.
We think of technology changing rapidly and society being slow
to adapt, but at least in this instance, the categorization scheme at
the heart of much of today’s machine learning technology has been
frozen in time while social norms have changed rapidly.
Our favorite example of measurement bias has to do with cameras,
which we referenced at the beginning of the section as the exemplar
of dispassionate observation and recording. But are they?10 solon barocas, moritz hardt, arvind narayanan
The visual world has an essentially infinite bandwidth compared
to what can be captured by cameras, whether film or digital, which
means that photography technology involves a series of choices
about what is relevant and what isn’t, and transformations of the
captured data based on those choices. Both film and digital cameras
have historically been more adept at photographing lighter-skinned 14
Roth, “Looking at Shirley, the Ulti-
individuals.14 One reason is the default settings such as color bal- mate Norm: Colour Balance, Image
ance which were optimized for lighter skin tones. Another, deeper Technologies, and Cognitive Equity,”
Canadian Journal of Communication 34, no.
reason is the limited “dynamic range” of cameras, which makes it
1 (2009): 111.
hard to capture brighter and darker tones in the same image. This
started changing in the 1970s, in part due to complaints from fur-
niture companies and chocolate companies about the difficulty of
photographically capturing the details of furniture and chocolate
respectively! Another impetus came from the increasing diversity of
television subjects at this time.
When we go from individual images to datasets of images, we
introduce another layer of potential biases. Consider the image
datasets that are used to train today’s computer vision systems for
tasks such as object recognition. If these datasets were representative
samples of an underlying visual world, we might expect that a
computer vision system trained on one such dataset would do well
on another dataset. But in reality, we observe a big drop in accuracy 15
Torralba and Efros, “Unbiased Look
when we train and test on different datasets.15 This shows that these at Dataset Bias,” in Proc. CVPR (IEEE,
datasets are biased relative to each other in a statistical sense, and is 2011), 1521–28.
a good starting point for investigating whether these biases include
cultural stereotypes.
It’s not all bad news: machine learning can in fact help mitigate
measurement biases. Returning to the issue of dynamic range in
cameras, computational techniques, including machine learning, are 16
Liu, Zhang, and Zhang, “Learning-
making it possible to improve the representation of tones in images.16 Based Perceptual Image Quality
Another example comes from medicine: diagnoses and treatments Improvement for Video Conferencing,”
in Multimedia and Expo, 2007 IEEE
are sometimes personalized by race. But it turns out that race is
International Conference on (IEEE, 2007),
used as a crude proxy for ancestry and genetics, and sometimes 1035–38; Kaufman, Lischinski, and
environmental and behavioral factors.17 If we can measure these Werman, “Content-Aware Automatic
Photo Enhancement,” in Computer
genetic and lifestyle factors and incorporate them—instead of race— Graphics Forum, vol. 31, 8 (Wiley Online
into statistical models of disease and drug response, we can increase Library, 2012), 2528–40; Kalantari and
Ramamoorthi, “Deep High Dynamic
the accuracy of diagnoses and treatments while mitigating racial
Range Imaging of Dynamic Scenes,”
biases. ACM Trans. Graph 36, no. 4 (2017): 144.
To summarize, measurement involves defining your variables of 17
Bonham, Callier, and Royal, “Will
Precision Medicine Move Us Beyond
interest, the process for interacting with the real world and turning
Race?” The New England Journal of
your observations into numbers, and then actually collecting the data. Medicine 374, no. 21 (2016): 2003; Wilson
Usually machine learning practitioners don’t think about these steps, et al., “Population Genetic Structure
of Variable Drug Response,” Nature
because someone else has already done those things. And yet it is Genetics 29, no. 3 (2001): 265.
crucial to understand the provenance of the data. Even if someonefairness and machine learning - 2021-06-16 11
else has collected the data for you, it’s almost always too messy for
your algorithms to handle, hence the dreaded “data cleaning” step.
But the messiness of the real world isn’t just an annoyance to be dealt
with by cleaning, it is instead a manifestation of the limitations of
data-driven techniques.
From data to models
We’ve seen that training data reflects the disparities, distortions, and
biases from the real world and the measurement process. This leads
to an obvious question: when we learn a model from such data, are
these disparities preserved, mitigated, or exacerbated?
Predictive models trained with supervised learning methods
are often good at calibration: ensuring that the model’s prediction
subsumes all features in the data for the purpose of predicting the
outcome. By contrast, human intuition is notoriously poor at account-
ing for priors, and this is a major reason that statistical predictions
perform better in a wide variety of settings. But calibration also
means that by default, we should expect our models to faithfully
reflect disparities found in the input data.
Here’s another way to think about it. Some patterns in the training
data (smoking is associated with cancer) represent knowledge that
we wish to mine using machine learning, while other patterns (girls
like pink and boys like blue) represent stereotypes that we might
wish to avoid learning. But learning algorithms have no general
way to distinguish between these two types of patterns, because
they are the result of social norms and moral judgments. Absent
specific intervention, machine learning will extract stereotypes,
including incorrect and harmful ones, in the same way that it extracts
knowledge.
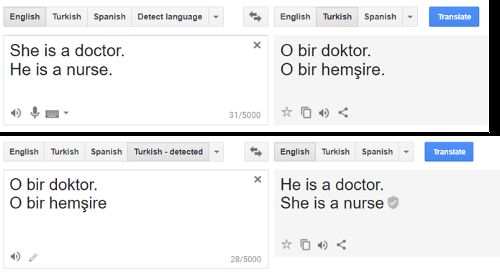
A telling example of this comes from machine translation. The
screenshot on the right shows the result of translating sentences from 18
Translating from English to Turkish,
English to Turkish and back.18 The same stereotyped translations then back to English injects gender
result for many pairs of languages and other occupation words in stereotypes.**
all translation engines we’ve tested. It’s easy to see why. Turkish has
gender neutral pronouns, and when translating such a pronoun to
English, the system picks the sentence that best matches the statistics
of the training set (which is typically a large, minimally curated
corpus of historical text and text found on the web).
When we build a statistical model of language from such text,
we should expect the gender associations of occupation words to
roughly mirror real-world labor statistics. In addition, because of 19
Danesi, Dictionary of Media and
the male-as-norm bias19 (the use of male pronouns when the gender Communications (Routledge, 2014).
is unknown) we should expect translations to favor male pronouns.12 solon barocas, moritz hardt, arvind narayanan
It turns out that when we repeat the experiment with dozens of
occupation words, these two factors—labor statistics and the male-as-
norm bias—together almost perfectly predict which pronoun will be 20
Caliskan, Bryson, and Narayanan,
returned.20 “Semantics Derived Automatically from
Here’s a tempting response to the observation that models reflect Language Corpora Contain Human-
Like Biases,” Science 356, no. 6334
data biases. Suppose we’re building a model for scoring resumes for (2017): 183–86.
a programming job. What if we simply withhold gender from the
data? Surely the resulting model can’t be gender biased? Unfortu-
Barocas and Selbst, “Big Data’s
21
nately, it’s not that simple, because of the problem of proxies21 or Disparate Impact.”
redundant encodings,22 as we’ll discuss in the next chapter. There are 22
Hardt, “How Big Data Is Un-
any number of other attributes in the data that might correlate with fair” (https://medium.com/@mrtz/
how-big-data-is-unfair-9aa544d739de,
gender. In our culture, the age at which someone starts programming 2014).
is well known to be correlated with gender. This illustrates another
problem with proxies: they may be genuinely relevant to the decision
at hand. How long someone has been programming is a factor that
gives us valuable information about their suitability for a program-
ming job, but it also reflects the reality of gender stereotyping.
Finally, it’s also possible for the learning step to introduce de-
mographic disparities that aren’t in the training data. The most
common reason for this is the sample size disparity. If we construct
our training set by sampling uniformly from the training data, then
by definition we’ll have fewer data points about minorities. Of course,
machine learning works better when there’s more data, so it will
work less well for members of minority groups, assuming that mem-
bers of the majority and minority groups are systematically different 23
Hardt.
in terms of the prediction task.23
Worse, in many settings minority groups are underrepresented
relative to population statistics. For example, minority groups are
underrepresented in the tech industry. Different groups might also
adopt technology at different rates, which might skew datasets as-
sembled form social media. If training sets are drawn from these
unrepresentative contexts, there will be even fewer training points
from minority individuals. For example, many products that incor-
porate face-detection technology have been reported to have trouble 24
Hardt.
with non-Caucasian faces, and it’s easy to guess why.24
When we develop machine-learning models, we typically only
test their overall accuracy; so a “5% error” statistic might hide the
fact that a model performs terribly for a minority group. Reporting
accuracy rates by group will help alert us to problems like the above
example. In the next chapter, we’ll look at metrics that quantify the
error-rate disparity between groups.
There’s one application of machine learning where we find espe-
cially high error rates for minority groups: anomaly detection. This
is the idea of detecting behavior that deviates from the norm as ev-fairness and machine learning - 2021-06-16 13
idence of abuse against a system. A good example is the Nymwars
controversy, where Google, Facebook, and other tech companies
aimed to block users who used uncommon (hence, presumably fake)
names.
Further, suppose that in some cultures, most people receive names
from a small set of names, whereas in other cultures, names might be
more diverse, and it might be common for names to be unique. For
users in the latter culture, a popular name would be more likely to
be fake. In other words, the same feature that constitutes evidence
towards a prediction in one group might constitute evidence against 25
Hardt.
the prediction for another group.25
If we’re not careful, learning algorithms will generalize based on
the majority culture, leading to a high error rate for minority groups.
This is because of the desire to avoid overfitting, that is, picking up
patterns that arise due to random noise rather than true differences.
One way to avoid this is to explicitly model the differences between
groups, although there are both technical and ethical challenges
associated with this, as we’ll show in later chapters.
The pitfalls of action
Any real machine-learning system seeks to make some change in the
world. To understand its effects, then, we have to consider it in the
context of the larger socio-technical system in which it is embedded.
In Chapter 2, we’ll see that if a model is calibrated—it faithfully
captures the patterns in the underlying data—predictions made using
that model will inevitably have disparate error rates for different
groups, if those groups have different base rates, that is, rates of
positive or negative outcomes. In other words, understanding the
properties of a prediction requires understanding not just the model,
but also the population differences between the groups on which the
predictions are applied.
Further, population characteristics can shift over time; this is
a well-known machine learning phenomenon known as drift. If
sub-populations change differently over time, that can introduce
disparities. An additional wrinkle: whether or not disparities are
objectionable may differ between cultures, and may change over time
as social norms evolve.
When people are subject to automated decisions, their perception
of those decisions depends not only on the outcomes but also the
process of decision-making. An ethical decision-making process
might require, among other things, the ability to explain a prediction
or decision, which might not be feasible with black-box models.
A major limitation of machine learning is that it only reveals14 solon barocas, moritz hardt, arvind narayanan
correlations, but we often use its predictions as if they reveal causa-
tion. This is a persistent source of problems. For example, an early
machine learning system in healthcare famously learned the seem-
ingly nonsensical rule that patients with asthma had lower risk of
developing pneumonia. This was a true pattern in the data, but the
likely reason was that asthmatic patients were more likely to receive 26
Caruana et al., “Intelligible Models
in-patient care.26 So it’s not valid to use the prediction to decide for Healthcare: Predicting Pneumonia
whether or not to admit a patient. We’ll discuss causality in Chapter Risk and Hospital 30-Day Readmission,”
in Proc. 21St ACM SIGKDD, 2015,
4.
1721–30.
Another way to view this example is that the prediction affects the
outcome (because of the actions taken on the basis of the prediction),
and thus invalidates itself. The same principle is also seen in the use
of machine learning for predicting traffic congestion: if sufficiently
many people choose their routes based on the prediction, then the
route predicted to be clear will in fact be congested. The effect can
also work in the opposite direction: the prediction might reinforce
the outcome, resulting in feedback loops. To better understand how,
let’s talk about the final stage in our loop: feedback.
Feedback and feedback loops
Many systems receive feedback when they make predictions. When a
search engine serves results, it typically records the links that the user
clicks on and how long the user spends on those pages, and treats
these as implicit signals about which results were found to be most
relevant. When a video sharing website recommends a video, it uses
the thumbs up/down feedback as an explicit signal. Such feedback is
used to refine the model.
But feedback is tricky to interpret correctly. If a user clicked on
the first link on a page of search results, is that simply because it was
first, or because it was in fact the most relevant? This is again a case
of the action (the ordering of search results) affecting the outcome
(the link(s) the user clicks on). This is an active area of research; there
are techniques that aim to learn accurately from this kind of biased 27
Joachims, Swaminathan, and Schn-
feedback.27 abel, “Unbiased Learning-to-Rank with
Biased Feedback,” in Proc. 10Th Interna-
Bias in feedback might also reflect cultural prejudices, which is tional Conference on Web Search and Data
of course much harder to characterize than the effects of the order- Mining (ACM, 2017), 781–89.
ing of search results. For example, the clicks on the targeted ads
that appear alongside search results might reflect gender and racial
stereotypes. There’s a well-known study that hints at this: Google
searches for Black-sounding names such as “Latanya Farrell” were
much more likely to results in ads for arrest records (“Latanya Far- 28
Sweeney, “Discrimination in Online
rell, Arrested?”) than searches for white-sounding names (“Kristen Ad Delivery,” Queue 11, no. 3 (March
Haring”).28 One potential explanation is that users are more likely to 2013): 10:10–29.fairness and machine learning - 2021-06-16 15
click on ads that conform to stereotypes, and the advertising system
is optimized for maximizing clicks.
In other words, even feedback that’s designed into systems can
lead to unexpected or undesirable biases. But there are many un-
intended ways in which feedback might arise, and these are more
pernicious and harder to control. Let’s look at three.
Self-fulfilling predictions. Suppose a predictive policing system
determines certain areas of a city to be at high risk for crime. More
police officers might be deployed to such areas. Alternatively, officers
in areas predicted to be high risk might be subtly lowering their
threshold for stopping, searching, or arresting people—perhaps even
unconsciously. Either way, the prediction will appear to be validated,
even if it had been made purely based on data biases.
Here’s another example of how acting on a prediction can change
the outcome. In the United States, some criminal defendants are
released prior to trial, whereas for others, a bail amount is set as a
precondition of release. Many defendants are unable to post bail.
Does the release or detention affect the outcome of the case? Perhaps
defendants who are detained face greater pressure to plead guilty. At
any rate, how could one possibly test the causal impact of detention
without doing an experiment? Intriguingly, we can take advantage
of a pseudo-experiment, namely that defendants are assigned bail
judges quasi-randomly, and some judges are stricter than others.
Thus, pre-trial detention is partially random, in a quantifiable way.
Studies using this technique have confirmed that detention indeed 29
Dobbie, Goldin, and Yang, “The
causes an increase in the likelihood of a conviction.29 If bail were set Effects of Pre-Trial Detention on Convic-
based on risk predictions, whether human or algorithmic, and we tion, Future Crime, and Employment:
Evidence from Randomly Assigned
evaluated its efficacy by examining case outcomes, we would see a Judges” (National Bureau of Economic
self-fulfilling effect. Research, 2016).
Predictions that affect the training set. Continuing this example,
predictive policing activity will leads to arrests, records of which
might be added to the algorithm’s training set. These areas might
then continue to appear to be at high risk of crime, and perhaps also
other areas with a similar demographic composition, depending on
the feature set used for predictions. The biases might even compound
over time.
A 2016 paper analyzed a predictive policing algorithm by PredPol, 30
PredPol deserves praise for publicly
one of the few to be published in a peer-reviewed journal.30 By releasing their algorithm, without
applying it to data derived from Oakland police records, they found which this research would not even
have been possible.
that Black people would be targeted for predictive policing of drug
crimes at roughly twice the rate of whites, even though the two 31
Lum and Isaac, “To Predict and
groups have roughly equal rates of drug use.31 Their simulation Serve?” Significance 13, no. 5 (2016):
showed that this initial bias would be amplified by a feedback loop, 14–19.
with policing increasingly concentrated on targeted areas. This is16 solon barocas, moritz hardt, arvind narayanan
despite the fact that the PredPol algorithm does not explicitly take
demographics into account.
A more recent paper built on this idea and showed mathematically
how feedback loops occur when data discovered on the basis of 32
Ensign et al., “Runaway Feedback
predictions are used to update the model.32 The paper also shows Loops in Predictive Policing,” arXiv
how to tweak the model to avoid feedback loops: by quantifying how Preprint arXiv:1706.09847, 2017.
surprising an observation of crime is given the predictions, and only
updating the model in response to surprising events.
Predictions that affect the phenomenon and society at large. Prejudicial
policing on a large scale, algorithmic or not, will affect society over
time, contributing to the cycle of poverty and crime. This is an ex-
tremely well-trodden thesis, and we’ll briefly review the sociological
literature on durable inequality and the persistence of stereotypes in
Chapter 3.
Let us remind ourselves that we deploy machine learning so
that we can act on its predictions. It is hard to even conceptually
eliminate the effects of predictions on outcomes, future training sets,
the phenomena themselves, or society at large. The more central
machine learning becomes in our lives, the stronger this effect.
Returning to the example of a search engine, in the short term it
might be possible to extract an unbiased signal from user clicks, but
in the long run, results that are returned more often will be linked to
and thus rank more highly. As a side effect of fulfilling its purpose
of retrieving relevant information, a search engine will necessarily
change the very thing that it aims to measure, sort, and rank. Sim-
ilarly, most machine learning systems will affect the phenomena
that they predict. This is why we’ve depicted the machine learning
process as a loop.
Throughout this book we’ll learn methods for mitigating societal
biases in machine learning, but let us pause to consider that there
are fundamental limits to what we can achieve, especially when we
consider machine learning as a socio-technical system instead of a
mathematical abstraction. The textbook model of training and test
data being independent and identically distributed is a simplification,
and might be unachievable in practice.
Getting concrete with a toy example
Now let’s look at a concrete setting, albeit a toy problem, to illustrate
many of the ideas discussed so far, and some new ones.
Let’s say you’re on a hiring committee, making decisions based
on just two attributes of each applicant: their college GPA and their
interview score (we did say it’s a toy problem!). We formulate this as
a machine-learning problem: the task is to use these two variables tofairness and machine learning - 2021-06-16 17
predict some measure of the “quality” of an applicant. For example,
it could be based on the average performance review score after
two years at the company. We’ll assume we have data from past
candidates that allows us to train a model to predict performance
scores based on GPA and interview score.
Figure 2: Toy example: a hiring classi-
fier that predicts job performance (not
shown) based on GPA and interview
score, and then applies a cutoff.
Obviously, this is a reductive formulation—we’re assuming that
an applicant’s worth can be reduced to a single number, and that
we know how to measure that number. This is a valid criticism, and
applies to most applications of data-driven decision-making today.
But it has one big advantage: once we do formulate the decision
as a prediction problem, statistical methods tend to do better than
humans, even domain experts with years of training, in making deci-
sions based on noisy predictors. The subject has been well researched,
and we’ll study it in Chapter 3.
Given this formulation, the simplest thing we can do is to use lin-
ear regression to predict the average job performance rating from the
two observed variables, and then use a cutoff based on the number of
candidates we want to hire. The figure above shows what this might
look like. In reality, the variables under consideration need not satisfy18 solon barocas, moritz hardt, arvind narayanan
a linear relationship, thus suggesting the use of a non-linear model,
which we avoid for simplicity.
As you can see in the figure, our candidates fall into two demo- 33
This binary categorization is a sim-
graphic groups, represented by triangles and squares.33 Note that the plification for the purposes of our
classifier didn’t take into account which group a candidate belonged thought experiment. Such simplifica-
tions are also common in the research
to. Does this mean that the classifier is fair? We might hope that it
literature. Indeed, most proposed fair-
is, based on the fairness-as-blindness idea, symbolized by the icon of ness interventions themselves start by
Lady Justice wearing a blindfold. In this view, an impartial model— assuming such a categorization. But
when building real systems, enforcing
one that doesn’t use the group membership in the regression—is fair; rigid categories of people can be ethi-
a model that gives different scores to otherwise-identical members of cally questionable. This is not specific
to machine learning, and a similar
different groups is discriminatory.
tension arises in many data-driven
We’ll defer a richer understanding of what fairness means to settings, such as the checkboxes for
Chapter 3, so let’s ask a simpler question: are candidates from the race on census forms or employment
applications.
two groups equally likely to be positively classified? The answer
is no: the triangles are more likely to be selected than the squares.
That’s because data is a social mirror; the “ground truth” labels that
we’re predicting—job performance ratings—are systematically lower
for the squares than the triangles.
There are many possible reasons for this disparity. First, the man-
agers who score the employees’ performance might have a bias
against one group. Or the overall workplace might be biased against
one group, preventing them from reaching their potential and lead-
ing to lower performance. Alternately, the disparity might originate
before the candidates were hired. For example, it might arise from
disparities in educational institutions attended by the two groups.
Or there might be intrinsic differences between them. Of course, it
might be a combination of these factors. We can’t tell from our data
how much of the disparity is attributable to these different factors. In
general, such a determination is methodologically hard, and requires 34
Zhang and Bareinboim, “Fairness
causal reasoning.34 in Decision-Making — the Causal
For now, let’s assume that we have evidence that the level of demo- Explanation Formula,” in Proc. 32Nd
AAAI, 2018.
graphic disparity produced by our selection procedure is unjustified,
and we’re interested in intervening to decrease it. How could we
do it? We observe that GPA is correlated with the demographic
attribute—it’s a proxy. Perhaps we could simply omit that variable
as a predictor? Unfortunately, we’d also cripple the accuracy of our
model. In real datasets, most attributes tend to be proxies for de-
mographic variables, and dropping them may not be a reasonable
option.
Another crude approach is to pick different cutoffs so that candi-
dates from both groups have the same probability of being hired. Or
we could mitigate the demographic disparity instead of eliminating it,
by decreasing the difference in the cutoffs.
Given the available data, there is no mathematically principledfairness and machine learning - 2021-06-16 19
way to know which cutoffs to pick. In some situations there is a legal
baseline: for example, guidelines from the U.S. Equal Employment
Opportunity Commission state that if the probability of selection for
two groups differs by more than 20%, it might constitute a sufficient
disparate impact to initiate a lawsuit. But a disparate impact alone
is not illegal; the disparity needs to be unjustified or avoidable for
courts to find liability. Even these quantitative guidelines do not
provide easy answers or bright lines.
At any rate, the pick-different-thresholds approach to mitigating
disparities seems unsatisfying. It is no longer blind, and two can-
didates with the same observable attributes may receive different
decisions depending on which group they are in.
But there are other possible interventions, and we’ll discuss one.
To motivate it, let’s take a step back and ask why the company wants
to decrease the demographic disparity in hiring.
One answer is rooted in justice to individuals and the specific
social groups to which they belong. But a different answer comes 35
Rock and Grant, “Why Diverse
from the firm’s selfish interests: diverse teams work better.35 From Teams Are Smarter” (Harvard Business
this perspective, increasing the diversity of the cohort that is hired Review. https://hbr.org/2016/11/
why-diverse-teams-are-smarter,
would benefit the firm and everyone in the cohort. 2016).
How do we operationalize diversity in a selection task? If we had
a distance function between pairs of candidates, we could measure
the average distance between selected candidates. As a strawman,
let’s say we use the Euclidean distance based on the GPA and in-
terview score. If we incorporated such a diversity criterion into
the objective function, it would result in a model where the GPA is
weighted less. This technique has the advantage of being blind: we
didn’t explicitly consider the group membership, but as a side-effect
of insisting on diversity of the other observable attributes, we have
also improved demographic diversity. However, a careless application
of such an intervention can easily go wrong: for example, the model
might give weight to attributes that are completely irrelevant to the
task.
More generally, there are many possible algorithmic interventions
beyond picking different thresholds for different groups. In particu-
lar, the idea of a similarity function between pairs of individuals is
a powerful one, and we’ll see other interventions that make use of
it. But coming up with a suitable similarity function in practice isn’t
easy: it may not be clear which attributes are relevant, how to weight
them, and how to deal with correlations between attributes.20 solon barocas, moritz hardt, arvind narayanan
Other ethical considerations
So far we’ve been mostly concerned with ethical concerns that arise
from demographic disparities in the outputs of machine learning
systems. But a few other types of concerns are worth highlighting.
Predictions versus interventions
Fairly rendered decisions under unfair circumstances may do little
to improve people’s lives. In many cases, we cannot achieve any
reasonable notion of fairness through changes to decision-making
alone; we need to change the conditions under which these decisions
are made.
Let’s return to the hiring example above. When using machine
learning to make predictions about how someone might fare in a spe-
cific workplace or occupation, we tend to treat the environment that
people will confront in these roles as a constant and ask how people’s
performance will vary according to their observable characteristics.
In other words, we treat the current state of the world as a given,
leaving us to select the person who will do best under these circum-
stances. This approach risks overlooking more fundamental changes
that we could make to the workplace (culture, family friendly poli-
36
Barocas, “Putting Data to Work,” in
Data and Discrimination: Collected Essays,
cies, on-the-job training) that might make it a more welcoming and ed. Seeta Peña Gangadharan Virginia
productive environment for people that have not flourished under Eubanks and Solon Barocas (New
America Foundation, 2014), 59–62.
previous conditions.36
The tendency with work on fairness in machine learning is to
ask whether an employer is using a fair selection process, even
37
Jackson and VanderWeele, “Decompo-
sition Analysis to Identify Intervention
though we might have the opportunity to intervene in the workplace Targets for Reducing Disparities,”
dynamics that actually account for differences in predicted outcomes Epidemiology, 2018, 825–35.
along the lines of race, gender, disability, and other characteristics.37
We can learn a lot from the so-called social model of disability,
which views a predicted difference in a disabled person’s ability to
excel on the job as the result of a lack of appropriate accommodations
(an accessible workplace, necessary equipment, flexible working ar-
rangements) rather than any inherent capacity of the person himself.
A person is only disabled in the sense that we have not built physical
environments or adopted appropriate policies to ensure their equal
participation.
The same might be true of people with other characteristics, and
changes to the selection process alone will not help us address the
fundamental injustice of conditions that keep certain people from
contributing as effectively as others.You can also read