Esri News for State & Local Government for State & Local Government - for State & Local Government
←
→
Page content transcription
If your browser does not render page correctly, please read the page content below

Esri News
Esri
for     News
    State & Local Government                                                                                              Summer 2021

for State & Local Government                                                                                              Summer 2021

SANDAG Proposes 5 Big Moves
to Forever Change Transportation
in the San Diego Region
   If given the right transportation alterna-   roles is to develop a long-range regional        SANDAG calls the 5 Big Moves—that will
tives, would people change their travel         transportation plan that provides efficient      take the region into the future.
patterns? Leaders at the San Diego              transportation systems and improves qual-
Association of Governments (SANDAG)             ity of life. In a bold move to design a new      Creating the 5 Big Moves
are posing that very question to elected        vision that would deliver a world-class trans-      Below are the key strategies needed to
officials, stakeholders, and the public.        portation system for the region, SANDAG          execute SANDAG's vision:
Through a data-driven approach, they are        turned to data and location intelligence           • Next OS—Enable new and better ser-
aiming to understand community char-            from a geographic information system (GIS).      vices for residents, transportation opera-
acteristics, lifestyles, and travel patterns    The technology supported the organiza-           tors, and planners through technology
to and from destinations such as employ-        tion's work in crafting a vision—which
                                                                                                                       continued on page 14
ment and activity centers. These leaders'
objective is a transformative plan that will                                   SANDAG's 5 Big Moves
provide a faster, fairer, and cleaner trans-
portation system for generations to come.
  The San Diego region of Southern
California is one of the fastest growing
areas and economies in the nation. By 2050,
San Diego County will be home to more
than 3.75 million people.
   With this growth come new challenges:
increased traffic, new travel patterns, and
changing transportation needs. So much
depends on resolving these transporta-
tion challenges as the area's economy
thrives on efficient connections between
housing and jobs, retail centers and busi-
ness hubs, students and education, and
visitors and attractions.
   SANDAG, a Metropolitan Planning
Organization (MPO), serves the govern-
ments of San Diego County and the
18 cities in it. One of SANDAG's primary
Inside This Issue                                          Summer 2021
                                                                         Subscribe to Esri News for
                                                                         State and Local Government
                                                                         Residents of the United States can subscribe and
                                                                         receive future print editions of Esri News for State
                                                                         and Local Government at go.esri.com/govnews.

                                                                         Manage Your Esri News for
                                                                         State and Local Government Subscription
                                                                         Make changes to your subscription information at
                                                                         go.esri.com/manage-subscriptions.

                                                                  4      Advertise in Esri News for
                                                                         State and Local Government
                                                                         For more information regarding advertising
1.    SANDAG Proposes 5 Big Moves to Forever Change                      opportunities in Esri News for State and Local
      Transportation in the San Diego Region                             Government, download the media kit at
4.    Urban Forestry in DC: Resource Equity and                          go.esri.com/Ads4SLG.
      Data Transparency
6.    The Property Mappers                                               Submit Your Content
8.    2021 Esri zHealth & Human Services GIS Conference Recap            We encourage Esri partners, startups, nonprofits,
                                                                         and customers to submit an article for inclusion in
10. Charlottesville Fire Department Tracks Fire Hydrant Inspections
                                                                         future content. Visit go.esri.com/ShareStory.
    with an All-in-One Mobile Work App

                                                                         Esri News for State and Local Government is
     10                                                                  published quarterly by Esri at 380 New York
                                                                         Street, Redlands, CA 92373-8100, USA. Esri News
                                                                         for State and Local Government is written for state
                                                                         and local government users of Esri software and
                                                                         distributed free of charge.

                                                                                                                        Copyright © 2021 Esri.
                                                                                                                        All rights reserved.
                                                                                                                        Printed in the United States of America.

12. City of Tacoma Streamlines
    the Strategic Planning                                               The information contained in this work is the exclusive property of Esri or its licensors. This work is protected
                                                                         under United States copyright law and other international copyright treaties and conventions. No part of this
                                                                         work may be reproduced or transmitted in any form or by any means, electronic or mechanical, including
    Process to Address                                                   photocopying and recording, or by any information storage or retrieval system, except as expressly permitted
                                                                         in writing by Esri. All requests should be sent to Attention: Director, Contracts and Legal Department, Esri, 380
    Affordable Housing and                                               New York Street, Redlands, CA 92373-8100 USA.
                                                                         The information contained in this work is subject to change without notice.

    Housing Inequalities with GIS                                        @esri.com, 3D Analyst, ACORN, Address Coder, ADF, AML, ArcAtlas, ArcCAD, ArcCatalog, ArcCOGO, ArcData,
                                                                         ArcDoc, ArcEdit, ArcEditor, ArcEurope, ArcExplorer, ArcExpress, ArcGIS, arcgis.com, ArcGlobe, ArcGrid, ArcIMS,
                                                                         ARC/INFO, ArcInfo, ArcInfo Librarian, ArcLessons, ArcLocation, ArcLogistics, ArcMap, ArcNetwork, ArcNews,
16. Leveraging Site Suitability                                          ArcObjects, ArcOpen, ArcPad, ArcPlot, ArcPress, ArcPy, ArcQuest, ArcReader, ArcScan, ArcScene, ArcSchool,
                                                                         ArcScripts, ArcSDE, ArcSdl, ArcSketch, ArcStorm, ArcSurvey, ArcTIN, ArcToolbox, ArcTools, ArcUSA, ArcUser,
                                                                         ArcView, ArcVoyager, ArcWatch, ArcWeb, ArcWorld, ArcXML, Atlas GIS, AtlasWare, Avenue, BAO, Business Analyst,
    Analysis to Validate Policy                                          Business Analyst Online, BusinessMAP, CityEngine, Community, Community Analyst, CommunityInfo, Community
                                                                         Maps, Companion, Database Integrator, DBI Kit, Drone2Map, EDN, Esri, esri.com, Esri—Team GIS, Esri—The
                                                                         GIS Company, Esri—The GIS People, Esri—The GIS Software Leader, Excalibur, FormEdit, GeoBIM, GeoCard,
18. Addressing Recycling                                                 GeoCollector, GeoEnrichment, GeoEvent, Geographic Design System, Geography Matters, Geography Network,
                                                                         geographynetwork.com, Geoloqi, GeoPlanner, Geoportal, Geostatistical Analyst, Geotrigger, GIS by Esri, gis.com,
                                                                         GISData Server, GIS Day, gisday.com, GIS for Everyone, Hub, Indoors, Insights, JTX, MapIt, Maplex, MapObjects,
    Challenges                                                           MapStudio, ModelBuilder, MOLE, MPS—Atlas, Network Analyst, Ortho Maker, PLTS, Rent-a-Tech, Scene Viewer,
                                                                         SDE, See What Others Can't, SML, Sourcebook•America, SpatiaLABS, Spatial Analyst, Spatial Database Engine,
                                                                         StoryMaps, Story Maps Basic, Story Maps Cascade, Story Maps Crowdsource, Story Maps Journal, Story Maps
22. What's New from                                                      Series, Story Maps Shortlist, Story Maps Swipe and Spyglass, Story Maps Tour, StreetMap, SURE, Tapestry, the
                                                                         ARC/INFO logo, the ArcGIS Explorer logo, the ArcGIS logo, the ArcPad logo, the Esri globe logo, the Esri Press
                                                                         logo, The Geographic Advantage, The Geographic Approach, the GIS Day logo, the MapIt logo, The Science
      Esri Press                                                         of Where, The World's Leading Desktop GIS, Velocity, Water Writes, and Your Personal Geographic Information
                                                                         System are trademarks, service marks, or registered marks of Esri in the United States, the European Community,
                                                                         or certain other jurisdictions.
23. American Rescue Plan—Now                 16                          Other companies and products or services mentioned herein may be trademarks, service marks, or registered
                                                                         marks of their respective mark owners.

    What Do You Do?

2     Esri News for State & Local Government Summer 2021
UTILITIES AND LOCAL GOVERNMENT WITH

Cityworks empowers your operations with
better data, better insights, and better decisions.
Local government and utility organizations have no shortage of data. But turning that data into actionable
insights can sometimes feel … impossible. Cityworks is the only GIS-centric public asset management and
permitting solution that leverages your investment in ArcGIS to make sense of the complexity of data and
create scalable systems of action. From IoT remote monitoring to intelligent asset management, now you can
easily track and visualize every asset and its associated history, labor, costs, materials, permitting workflows,
and so much more.

                                            Request your personal solution demo at Cityworks.com
Urban Forestry in DC: Resource
Equity and Data Transparency

  The District Department of Transport-         The UFD has also been a longtime           Hub, ArcGIS Online, and state and local
ation (DDOT) Urban Forestry Division            proponent of Esri technology, using it     government solutions. The hub site is
(UFD) is the primary steward of                 not only to help people understand and     designed to let users explore information
Washington, DC's 170,000 public trees           connect with the forest that surrounds     describing the history, value, and manage-
and has a mission to keep this resource         them but also to provide transparency      ment of the urban forest in Washington,
healthy, safe, and growing. Each year,          into the process of allocating service     DC, and can be found at ddot-urban-
the UFD prunes, plants, and removes             resources equitably. This has been         forestry-dcgis.hub.arcgis.com/.
thousands of public trees. These deci-          accomplished over the years through          The UFD's hub site has been accessed
sions impact the lives of both residents        ArcGIS StoryMaps, ArcGIS Dashboards,       more than 32,000 times over the last year
and visitors, as trees are critical to the      configurable web applications, and         and has been a popular destination for
city's well-being. These trees improve the      custom mapping applications. However,      the public to learn about UFD services
air and water quality; cool the neighbor-       what has been missing was a cohesive       and resources. The urban forest story
hoods; provide critical habitat for birds,      framework to bring all the components      begins with a look to the past, introduc-
bees, and urban wildlife; and more.             together under one digital roof.           ing the audience to the long history and
  With a long history of caring for the           To address this need, UFD has created    important role of trees in DC. The hub
extensive forest canopy in DC, the UFD          an interactive community engagement        site also lets users explore the impressive
has meticulously assembled datasets             site using ArcGIS Hub technology. UFD      variety of trees available for community
and applications to help in the division's      worked in collaboration with Esri Silver   enjoyment and leverages several ap-
forest management mission as well as to         partner SymGEO, a Maryland-based           plications and digital stories developed
communicate with a variety of audiences.        GIS company specializing in ArcGIS         by the UFD. The flagship dataset, the

4   Esri News for State & Local Government Summer 2021

DDOT Urban Forestry Division feeds work
order data in real time into ArcGIS Hub to
inform residents faster.
Public Tree Map, elegantly displays a subinitiatives, Urban Wood Reuse: for
tremendous amount of current informa- Schools, discusses the benefits of urban
tion about the urban tree canopy. Links wood reuse; where the wood comes from;
are provided to both the map and the and the variety of products available for
underlying data for the community to schools including benches, stumps, and
use and explore. woodchips. It also provides a link to an
The Services section of the hub site order form as a convenient and easy way
provides complete transparency into to request wood products.
existing work requests, open work Another section of the site, Forest
orders, and planned and recently Health, was designed to educate the Service requests, open work orders, scheduled
completed services. The data is sourced community on how DDOT staff and DC work, and completed work reports provide
from the UFD's internal work order residents help keep the urban canopy complete visibility into UFD's service cycle.
management system and aggregated vibrant, healthy, and productive. The
by geography, and summary statistics Forest Health pages discuss a range of
are presented using ArcGIS Hub and preventive measures—including the Early
ArcGIS Dashboards technology. The Detection Rapid Response (EDRR) and "We are excited to
Planting by Ward dashboard has been the Cryptic Wood-Borer Insect (CWBI) share our forest health
viewed thousands of times over the last programs—that the UFD takes to guard
year and provides a high-level overview against pests, and tell how DC residents
programs with the public
of the equitable distribution of planting can identify and report invasive species. in this new format. The
resources. Interactive web applications
For More Information
[hub site] is dynamic and
enable users to explore local work
orders and were designed using ArcGIS District Department of Transportation easy to use. It allows
Web AppBuilder. Often, tabulated Earl Eutsler, Associate Director/State users to learn about pests
results and the beneficial impact of Forester
these projects go unrecognized. UFD Urban Forestry Administration
and pathogens to look
staff created several ArcGIS StoryMaps 55 M Street SE, Suite 400 out for, while also giving
stories to convey the importance of Washington, DC 20003 them the opportunity to
the work being done equitably across earl.eutsler@dc.gov
all geographic wards. In addition, an report their observations."
ArcGIS Survey123 form can be found at SymGEO —Kasey Yturralde, Forest Health and
the bottom of the hub site for two-way Kevin McMaster, Principal Community Outreach Specialist, DDOT
community engagement to continually 9841 Washingtonian Boulevard Urban Forestry Division
improve service offerings. Suite 200-310
As part of the UFD's hub site, sev- Gaithersburg, MD 20878
eral subinitiatives were developed for 240-575-1215
specific project purposes. One of these kevin.mcmaster@symgeo.com
Summer 2021 esri.com/localgov 5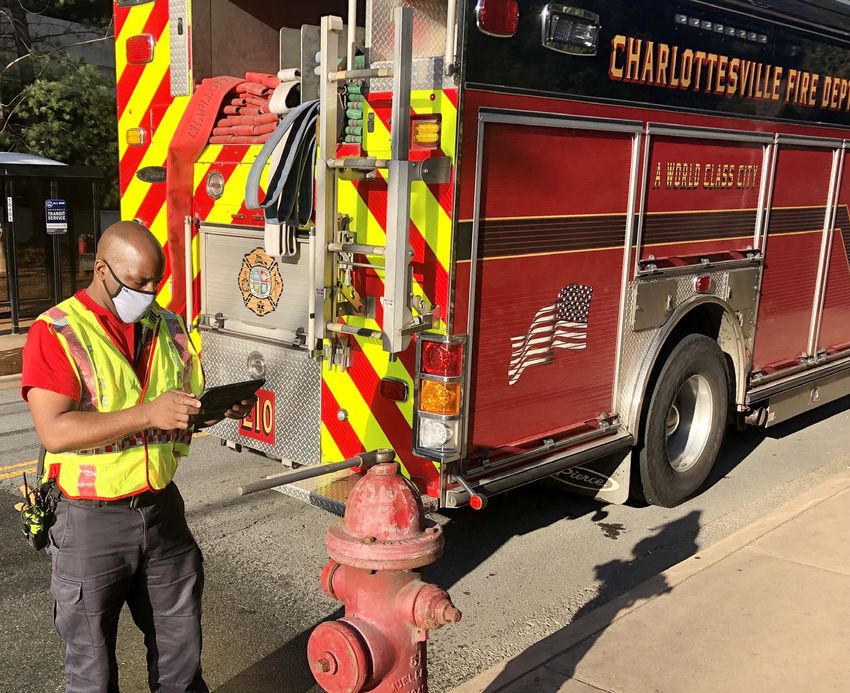
The Property Mappers
The thousands of dashboards that have been created using parcel ID links to more detailed information about the build-
ArcGIS Dashboards, from Esri, keep organizations and the ing, including the date it was sold, its owners' names, the year
public in the know, with a vast amount of valuable information the structure was built, its square footage, the current market
provided daily. value of the property, and the current taxable value.)
A dashboard can track election results, 3-1-1 requests for The data is updated monthly.
service, bird migrations, building permit information, opioid
overdoses, capital improvement and real estate development
projects, and crime statistics, to name a few examples.
Creative thinkers always come up with new ideas for dash-
boards, such as the Real Estate Sales Dashboard from the
Franklin County Auditor's Office in Ohio. The dashboard on the
auditor's website displays residential transactions data, includ-
ing the following:
• The residential real estate sales total for Franklin County as
well as more than 80 local municipalities, area commissions,
school districts, and townships
• The median sales price for homes in each area
The dashboard includes a map showing the location of the properties
• The number of sales in each area sold, photos of the buildings, and the median sales price in the area.
• The number of sales per school district, displayed in a pie chart
• The location of each building sold, shown on a map (Pop-ups Franklin County auditor Michael Stinziano said development
on each feature include a photograph and the address of of the Real Estate Sales Dashboard resulted from a request from
the building, the property's acreage, and the parcel ID. The neighborhood groups. They wanted the auditor's office website
6 Esri News for State & Local Government Summer 2021
to provide authoritative, easily accessible, and hyperlocalized The GIS team used ArcGIS Dashboards for this project be-
real estate sales information, due to the impact that the current cause it provides a seamless and efficient way to share key sta-
booming real estate market is having on neighborhoods' prop- tistics generated in ArcGIS, according to Shade. The team plans
erty values and school districts' funding in Franklin County. to release an ArcGIS StoryMaps app highlighting annual sales
"Ohio is one of the hottest real estate markets in the country," trends by compiling monthly data from the Real Estate Sales
Stinziano said in a recent interview." Dashboard and perspectives from local real estate experts.
"Having such a competitive housing market means buyers,
sellers, and agents are constantly reviewing properties for sale,"
Stinziano said. "Our dashboard gives accessible and transparent
data to help inform those choices."
Franklin County (pop. 1.3 million) is home to Ohio's state
capital, Columbus, named by Forbes magazine in 2019 as the
top real estate market in the nation. Columbus was also recently
included in the Top 10 Outperforming Metro Markets Report by
the National Association of REALTORS, meaning that over the
next three to five years, real estate sales should be strong based
on factors that make home buying more achievable. Some of
those factors include housing affordability for residents new to
the area, home price appreciation, and consistent job growth
relative to the national average.
Realtors like the dashboard because it's a good resource to
search for comparable sales. School district officials also will
find the dashboard useful because they can see, at a glance, the
number of home sales in their particular district each month,
along with the total sales amount and the median sales price.
Matt Shade, the GIS manager for the auditor's office, said that
this project was the first time his team had created a configurable
web app using ArcGIS Dashboards and that it was easy to do.
Each month, the previous month's real estate transfer data is
plotted as points on a map. The points are queried to ensure
that they are valid arm's-length transactions. Using an ArcPy
script, boundaries for each area are overlaid, and summary
statistics are generated to get the number of transactions, the
median sales price, and the total number of sales for the month.
"We publish that through ArcGIS Online, and it goes to the
dashboard," Shade said.
Once the geoprocessing script was developed, design
considerations became the main focus. The GIS team kept the
amount of information on the dashboard to a minimum, with
only four major data points plus the map.
"We utilized Esri's training when we [went] to share this data," Viewers of the dashboard can find vital information about each
Shade said. "The recommendation from Esri is to keep it simple. property sold, including the address, sales date, and parcel
identification number.
You don't want to overload people [with information]."
To find a solution for mobile viewing, the team developed a
second dashboard that only displays statistics for each area For information on how assessors and local governments can
and not the map. Users are redirected based on screen width. use GIS to increase residents' trust and confidence with public-
Another consideration was the basemap. The team decided facing technology, visit go.esri.com/PublicPropInfo.
to combine Esri's World Light Gray Base map with labels from
Esri's Human Geography basemap. Developing the dashboard
took the GIS team about a month from start to finish.
Summer 2021 esri.com/localgov 7
Four Key Takeaways from the 2021 Esri
Health & Human Services GIS Conference

On April 21 and 22, Esri hosted the virtual              1. Infrastructure Needs to Be Reusable for
2021 Esri Health & Human Services GIS                        Multiple Health Use Cases
Conference. The conference brought pro-                  Organizations must set up the IT infrastructure and train
                                                         their staff on GIS tools that they not only can use under
fessionals in public health, social services,            ordinary circumstances but also can quickly adapt for future
hospitals, health-care systems, insurers,                emergencies. The organizations that were able to quickly
                                                         respond and provide information tools to the public at the
academia, and commercial segments to-                    start of the COVID-19 pandemic were those that had GIS in
gether to share best practices on the use of             place for rapid deployment to support continuity of opera-
                                                         tions. Staff who are comfortable in geographic information
spatial thinking and GIS technology to pro-              systems and workflows are able to adapt GIS technology
                                                         when new health challenges arise.
mote health. Four clear patterns emerged
from the experiences shared by the various               2. Innovation on Demand Is Possible
speakers—and these patterns will impact                  Organizations are leveraging ArcGIS Solutions in massive num-
                                                         bers to scale GIS across departments and workflows. These
the health GIS industry. Below is a summary              maps and apps that were designed with health professionals
of these four key takeaways that you can                 in mind have allowed organizations to quickly deploy power-
                                                         ful dashboards, information products, and decision-making
share with your organization to help it use              tools for situations ranging from natural disasters to disease
                                                         outbreaks, point-in-time counts of people experiencing home-
GIS to advance quality of life and promote
                                                         lessness, the opioid crisis, and vector control as well as eve-
healthier communities.                                   ryday health-care workflows. These free tools have increased

8   Esri News for State & Local Government Summer 2021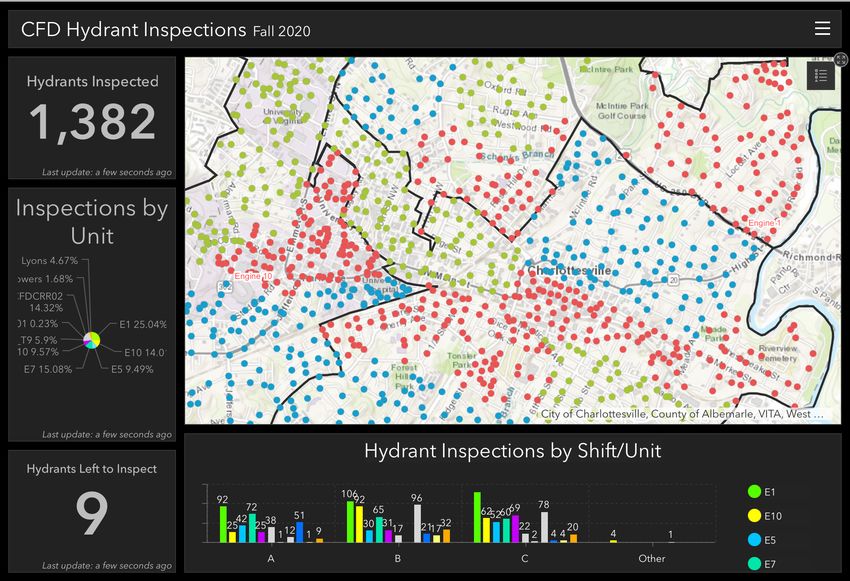
business impact for organizations of all sizes for decades. The must apply an equity lens to everything you do. By using data,
COVID-19 pandemic response continued to prove that ArcGIS maps, spatial analysis, and dashboards, you can ensure that
Solutions allows for innovation on demand as organizations you are delivering equitable experiences and healthy out-
adapted these solutions and deployed them to meet un- comes for all in the community.
foreseen workflows including providing testing site locators,
contact tracing, and vaccine distribution.
Data, applications, and dashboards help you address health equity.
4. ArcGIS Is Now More Secure and
Privacy Standards Compliant
Esri announced a new, exciting technological advancement
that will become the best of breed in the GIS industry and im-
prove the security and privacy standards compliance posture
for ArcGIS users in health: Health Insurance Portability and
Accountability Act (HIPAA)-aligned geocoding. Being in align-
Explore the gallery of free ArcGIS Solutions built to support health
and human services workflows ment with HIPPA means that Esri's ArcGIS World Geocoding
Service—which finds patterns that associate addresses with
3. Equity Must Be Part of Everything locations—has the ability to identify protected health informa-
tion (PHI) and personally identifiable information (PII) data and
We Do
treat it with privacy and security in mind.
We must acknowledge that some communities become more Now, ArcGIS is able to do the following: filter PHI/PII data
vulnerable than others, and we must hold ourselves account- from requests to the service—in other words, it can separate
able by exposing barriers in neighborhoods that have con- PHI data from PII data; limit the viewing of log files—restrict
sistently been left behind. GIS has been acknowledged as a who can view the log files as well as how long the files exist;
foundational platform for meeting the needs of communities, and create a secure area with limited Esri employee access—
whether you're making decisions about where to place re- and those employees have had all the required trainings.
sources, who needs more education on available services, who Together, these capabilities benefit the user with the knowl-
is at a disadvantage, or where the at-risk groups are. On topics edge that Esri has safety controls for PHI/PII data that is
such as health-care access, vaccine distribution, health services processed by the service.
placement, access to healthy and affordable foods, easy access To check out the event proceedings and additional
to parks, and identification of vulnerable populations in areas resources about the above-mentioned topics, visit
with poor air quality, health professionals are at the forefront of go.esri.com/2021-health-recap.
the discussion through efforts in achieving health equity. You
At a Glance
1,515 Registrants
72
Countries Represented
34
Speakers
Summer 2021 esri.com/localgov 9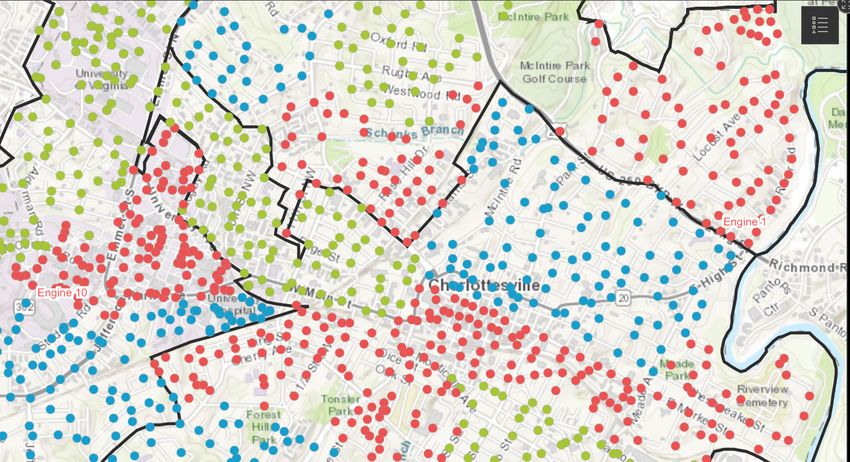
Charlottesville Fire Department Tracks Fire Hydrant Inspections with an All-in-One Mobile Work App A dashboard is used to monitor the annual fire hydrant inspections project status. The Charlottesville Fire Department As an additional layer of review, the app designed for mobile workforces to (FD) serves and protects the residents of Insurance Services Office (ISO) creates collect data and complete assignments, Charlottesville, Virginia, by providing fire ratings for fire departments that calculate streamlining the hydrant inspection protection and emergency response to how well-equipped fire departments are process and giving stakeholders access the city as well as the University of Virginia. to put out fires in a community. The City to real-time information. With a wide range of services offered by of Charlottesville has a Class 1 ISO rating, Charlottesville FD, including fire response, which is the highest ISO rating granted by Challenge hazmat, and emergency medical services, this body. One requirement necessary to After the reorganization of the the department has implemented best uphold this rating is an annual inspection Charlottesville FD in summer 2020, Joe practices to deliver the comprehensive of fire hydrants within the Charlottesville Powers, MPA, CFO, deputy chief of emergency services the city needs. city limits and the University of Virginia. community risk reduction for the City Accreditation is one aspect of deliver- Previously, inspections performed by of Charlottesville, began managing the ing superior services. The model set forth firefighters consisted of a paper-based department's ISO rating and the differ- by the Commission on Fire Accreditation workflow that had those in the field ent requirements needed to maintain International requires fire departments manually taking notes, writing emails, it, including fire hydrant inspections. The to foster an environment of continuous and making calls to get repairs done, previous method for inspection was a improvement and sets the fire department which was a time-consuming process. To manual process that involved firefighters apart by affirming that it meets the highest more efficiently perform this inspection, printing a spreadsheet with a list of fire standards of excellence. the fire department implemented a new hydrant locations, inspecting the hydrants 10 Esri News for State & Local Government Summer 2021
in the field, and recording findings on a workers to view their organization's digital Lyons created the solution with just a fea-
piece of paper. maps, collect and edit data, and capture ture layer of the hydrants, and the app has
These findings would then be transferred location tracks. inspections grouped by A, B, and C shifts
to a form by the firefighter and emailed to Powers wanted to tie in the hydrant and by unit, enabling firefighters to see
the Charlottesville Public Works division, record with the inspection performed and what other shifts have completed. Lyons
which maintains the fire hydrants. This move away from a paper-based process, made it a priority to ensure all the work was
would be followed up by a phone call from so the combination of capabilities, like divided equitably among each shift. Also,
the firefighter to confirm any needed re- mobile data collection and editing, the zones are colored to provide quick
pairs. The public works department would seemed to be exactly what they needed. information at a glance; for example, zones
then create a work order to complete "We knew Charlottesville had obstacles colored green include hydrants that have
the fixes. To move away from the manual it was trying to find solutions for. We also already been inspected.
inspection process, a digital hydrant knew that Chief Powers and Lucas [Lyons] "With Field Maps, you have a way to col-
inspections process was created in 2018 were pretty progressive and would . . . be lect data without having to go through this
by Lucas Lyons, a systems performance good storytellers for the use of technol- whole process of [asking], Where should
analyst for Charlottesville FD, with a mobile ogy to improve day-to-day operations," this data live? You just need to set up a fea-
data collection app. However, the app had says Cox. "So, it just seemed like a perfect ture layer, and you're good to go, and I like
limitations and didn't allow for advanced fit for an early rollout of Field Maps to a that," says Lyons. "I think we'll have more
enhancements or features. fire department." and better data in the future [by] having an
"The digital hydrant inspections process Bernstein adds, "I was learning from application like this in users' hands."
went okay, but users in the field were Chief Powers and Lucas [Lyons] that some After Powers and Lyons received some
asking for developer-level requests. I found users might not be as familiar with GIS or Field Maps training from Esri, Powers
we quickly hit walls, and I became some- Esri, and they wanted a simplified process created a short three-minute training video,
what frustrated by the limited features for that end user. When you can simplify which he made with a teleconferencing
within [the app]," says Lyons. everything you need into one application service, to educate the firefighters on Field
Also, the City of Charlottesville employs [like Field Maps], that's a huge thing." Maps. The video showed Lyons using
a spatial database to organize all the data the app and walking through a hydrant
in the city, but according to Lyons, user inspection, and the fire department's
permissions were a challenging obstacle. normal documentation for inspections was
"We have a master hydrant point file, and sent with it. Powers says the app was so
I had no ability to edit that and neither did straightforward, people were out inspect-
the firefighters. It kind of took some lob- ing hydrants using an iPad or mobile
bying to get access to things like that. The device the same day.
database is just a legacy system. It's not "I think it's a game changer for the fire
very open and editable, making collabora- service. It allows firefighters to record
tion difficult," says Lyons. information and collect data [with one ap-
With improvement needed in the digital plication], and it's what the fire department
inspection process, Powers began the needs to be successful in collecting data,"
search for a more efficient method that says Powers.
would save the firefighters valuable time
and enable them to more expediently Result
complete inspections. Since the successful implementation
of Field Maps, the Charlottesville FD has
Solution plans to deploy it every year in May to
To establish an easy and efficient inspect city fire hydrants. Charlottesville
method that was simple for firefighters to firefighters have been able to expediently
use, Powers began working with Renee inspect close to 1,300 fire hydrants even
Bernstein, an Esri solution engineer, and with schedule limitations, such as no in-
Mike Cox, fire and emergency medical spections on weekends, and they only have
service (EMS) industry manager at Esri, 267 left. According to Powers, the stream-
who suggested testing a new product lined process has helped to decrease the
that would streamline hydrant inspection: workload while still increasing productivity.
ArcGIS Field Maps. ArcGIS Field Maps Data can be easily captured using the "Almost all of our fire departments have
is an app designed to enable mobile ArcGIS Field Maps mobile app.
continued on page 21
Summer 2021 esri.com/localgov 11City of Tacoma Streamlines the Strategic
Planning Process to Address Affordable
Housing and Housing Inequalities with GIS
Tacoma, Washington's third-largest To respond to the affordable hous- about the benefits of diversifying housing
city, is facing a housing crisis amid rapid ing crisis, the city created Tacoma's types; the history of redlining, a discrimi-
population growth. City officials recog- Affordable Housing Action Strategy natory practice that made it difficult for
nized that the lack of affordable housing (AHAS). This strategy addresses chal- people of color to become homeowners;
continues to affect lower-income and lenges such as the lack of affordable and how the city is revisiting previous
historically marginalized communities housing for vulnerable communities and housing policies.
from securing a place to live. Over the the scarcity of housing assistance re- "When people hear the phrase afford-
last year, the economic impact of the sources and proposes solutions for low- able housing, they tend to imagine their
COVID-19 pandemic has resulted in even income residents to secure housing. In neighborhood changing for the worst, with
more residents experiencing financial 2020, the city initiated further action that inappropriately sized apartments looming
hardships. From 2010 to 2019, the region would prioritize public engagement and over their house. But Tacoma's strategy is
added three new residents for every new feedback on the AHAS, with a deadline about creating a strategic and inviting mix
housing unit. This challenge has moved of six months. This led to the creation of of housing types," says Christina Chelf, GIS
city officials and the planning depart- the Home in Tacoma Project, built using supervisor at the City of Tacoma.
ment to address inadequate housing ArcGIS StoryMaps, an interactive story- Chelf and her team, including Adriana
supply and increase housing affordability telling application. This project-focused Abramovich and John Shell, decided to
for the Tacoma community. approach educated the community lead with a geospatial approach as the
most efficient and user-friendly tool to
expedite the process of sharing informa-
"As the city moves forward with modifications to land
tion with the community. They created
use, we will definitely continue to present data by an application with interactive maps and
using ArcGIS StoryMaps to show the justifications a narrative to inform residents about the
city's need to address its housing chal-
for proposal changes. This project illustrates the lenges and promote equitable, affordable
importance of data and spatial analysis as well as how housing solutions for all.
telling a story with spatial data can have a real impact "We needed to show residents the
benefits of diversifying affordable hous-
on our community." ing types across the city. We created an
Christina Chelf, GIS Supervisor, City of Tacoma ArcGIS StoryMaps [story] that presented
the urgent need for housing supply,
12 Esri News for State & Local Government Summer 2021team also used the map narrative to educate residents on how
a diverse housing mix that included duplexes, townhomes, and
single-family homes would serve the community more effec-
tively. As a result, the map narrative gave the public greater
insight and understanding about the community's need for a
revitalized housing mix.
Gathering Feedback from the Community with GIS
As city staff reviewed plans for creating more affordable
housing, they knew community feedback was an important
part and attempted to engage with residents at every stage.
Coinciding with the release of the Home in Tacoma Project, the
This map displays historical documentation comparing which areas city used an online survey to collect general feedback on the
experienced redlining with those whose population had greater access
to affordable housing. direction of the initiative. Since the launch of this story, over
800 community members have submitted their feedback on
addressed misconceptions about what a community with the affordable housing proposal.
more diverse housing types might look like, and showed the Several months later, as the city began reviewing more specific
historical housing inequities in the region and their enduring future land-use changes, the city's GIS team again created a tool to
consequences," states Chelf. "This online tool helped us to support the project. Using Esri's ArcGIS Web AppBuilder, an app
quickly streamline the process of creating and sharing a new creation tool that requires no coding skill, the team collected over
housing strategy with our community." 200 location-specific comments on the Home in Tacoma Growth
Scenarios map in just a few short weeks. The comments will be used
Mapping to Visualize Racial Inequities to guide the final proposed change.
With Tacoma's history of redlining in the 1920s, today's city
officials wanted to address these racial inequities within the
community. The city's planning department worked with the
GIS team to incorporate maps into the Home in Tacoma Project
to help residents understand the direct impact redlining had
on under-resourced communities.
Equity and housing costs slider map of Tacoma displays the overlap
between residents' access to affordable housing.
Tacoma Median Income and Affordable Rent by Race and Ethnicity Future Plans for Regional Collaboration
While the City of Tacoma continues to gather valuable feed-
To visualize the relationship between affordability and the back from the community, the GIS and planning departments
lack of housing, the department used the city's Equity Index are collaborating with regional partners to explore affordable
map to show how historic housing policies were negatively housing solutions regionally. Based on a regional analysis, they
impacting people of color. The data presented in the equity know they will need to increase housing units by 60,000 dwell-
index influenced Tacoma's decision to prioritize creating more ings by 2040 to meet the demand of population growth. GIS
housing in areas with higher opportunity and to avoid gentrify- technology will remain ingrained in the city's housing strategy
ing areas with racially diverse populations. to ensure that Tacoma continues to understand the commu-
The project also showed that housing costs for many nity's needs, create programs based on data and analysis, and
residents has continued to rise while household income has prioritize equity.
remained stagnant. This has resulted in around 40 percent For more information on using focused citizen engagement
of residents paying more than they can afford for housing. In tools to cultivate a partnership with your residents, visit
response to the affordable housing inequities, Chelf and her go.esri.com/Tacoma-CE.
Summer 2021 esri.com/localgov 13SANDAG Proposes 5 Big Moves to Forever Change Transportation in the San Diego Region
continued from page 1
• Complete Corridors—Provide safe analysts, and modelers—with support a companion document to the ArcGIS
and reliable travel for everyone, whether from their consultant, HNTB—took a StoryMaps story "A Transformative
they walk, bike, take public transit, or drive deeper dive into the previous analysis to Transportation Vision" (https://arcg.
• Transit Leap—Build on the current determine travel characteristics for the is/1CqeGS0).
transit services through new and enhanced region's activity centers for nonwork-
commuter rail, light-rail, and bus services related commute purposes.
• Mobility Hubs—Bring together better
transit and travel options for people to
explore communities without relying on a car
• Flexible Fleets—Include micromobil-
ity strategies, ride share, and microtransit
options that would make first- and last-mile
options safer and more convenient.
Using Data to Draft the
5 Big Moves
SANDAG has been leveraging data and
GIS to support transportation planning Analysis of where people desire to live
and modeling since 1971. It has a long his- and work
tory of using Esri technology—in fact, the
Analysis of the relationship between where
Implementing Human-Centered
organization was Esri's 54th customer. This
people live and work Design to Meet Resident Needs
long history includes developing and main-
With the goal of analyzing and better
taining regional datasets and performing
The staff also conducted proximity and understanding current travel patterns,
spatial analysis to inform decision-making.
propensity analyses to identify potential SANDAG members focused on listen-
The work has provided a solid foundation
system demand and accessibility needs. ing to their community's concerns and
for preparing the long-range regional
This helped create a more integrated needs. They used a human-centered
transportation plan every four years.
system with higher-speed transit con- design approach that included stakeholder
With SANDAG's recent strategic initia-
nected by flexible fleet modes such as workshops and interviews. Community
tive to become a data-driven organization,
microtransit, Transportation Network input provided insight into how current
staff saw the regional plan development
Companies (TNC), and micromobility transportation experiences affect people's
cycle as an opportunity to apply data and
(e-scooters, e-bikes, etc.). Planners were daily lives, and the types of transportation
analytics in creating a transformative vision
able to define mobility hubs based on choices that could improve quality of life.
for the region.
geographic focus areas.
For their plan to have the most impact
The idea centers on a seamless operat-
and to arrive at data-driven alterna-
ing system supported by emerging
tives, staff used GIS and a wide range of
technologies. This regional vision will
socioeconomic and transportation data.
create a future transportation system
They analyzed travel patterns, land-use
that improves access to jobs, education,
and employment characteristics, and
services, and places of recreation. It will
demographics as well as resident feed-
ultimately support the overarching goals
back. Seeing so much crucial information
of greater equity and improved quality of
together on a map helped SANDAG
life for future generations.
better understand how people want and
For more details on SANDAG's data-
need to travel around the region. Building
driven approach and the supporting
on recent analysis of where people live
technical methodology of developing
and work—which identified a wide range
the 5 Big Moves, see SANDAG's Vision
of accessibility characteristics around
for the 2021 Regional Plan Network
SANDAG's employment center data—was
Development Summary Report Visualization of major employment centers
the next step. SANDAG planners, data
(go.esri.com/SANDAG-Report), and commute origins
14 Esri News for State & Local Government Summer 2021Using community input, the SANDAG in a simplified way. The StoryMaps story GIS played a role in almost every
team developed personas showing how includes details about the 5 Big Moves, the element of SANDAG's planning process.
residents would interact with the 5 Big different personas people could identify Relying on decades of experience with GIS
Moves and the region's transportation with, and the data-driven process behind technology and out-of-the-box thinking,
systems. Based on common behaviors and the strategies. The work shows the thought staff were able to do the following:
lifestyles, these personas—or, as SANDAG behind this new approach and policies— • Use spatial analysis to understand pres-
called them, user journeys—allowed the how SANDAG would create faster, smarter, entzz conditions and existing stresses on
team to explore how residents such as and more accessible and flexible trans- the transportation network
students, young professionals, or retirees portation options for all residents. This
• Leverage demographic and lifestyle
would be affected by proposed projects, work has also helped SANDAG overcome
data to understand the current and
programs, and policies. The team also con- one of the biggest challenges of trying to
future needs of residents based on
sidered travel patterns and human move- execute a long-range plan with massive
population, housing and employ-
ment in relation to development, events, infrastructure changes and impact: build-
ment growth, proposed development
and proposed or existing infrastructure to ing community consensus.
patterns, and potential recreational
better match each transportation system
Improving the Lives of Residents opportunity areas
to the way people interact with and move
about that system. Comes First • Provide an open line of communication
One of the most difficult tasks in devel- SANDAG's vision, 5 Big Moves, is a with residents, letting them voice their
oping a visionary, long-term plan is com- bold approach to rethinking mobility in a concerns or provide feedback
municating it in a way people understand region. It addresses current needs while • Create a suite of transportation
as well as conveying the personal impact it prioritizing and preparing for long-term alternatives that promote social equity
may have. Using the StoryMaps story and trends. And SANDAG is not waiting for values and meet state and federal
SANDAG'S on-site Vision Lab, SANDAG these trends to happen—the organization requirements
leaders shared their vision, engaged with is planning for them now.
the public, and presented complex ideas "We have and will continue
to leverage GIS to support
our regional plan," said
Pat Landrum, director
of data and modeling
for SANDAG. "We have
demonstrated to our
policy committees, board
of directors, various
stakeholders, and
residents that spatial
analysis allows us to
make more data-driven
decisions and promote
social equity throughout
the region."
SANDAG is a model for other regional
governments, using GIS to rethink regional
planning and transportation projects,
quality-of-life improvements for more
residents, and communication with the
community.
Initial Mobility Hub Propensity score
Summer 2021 esri.com/localgov 15Leveraging Site Suitability
Analysis to Validate Policy
By Keith Cooke, Industry Manager for Planning and Community Development at Esri
If you've followed my blog series (at go.esri.com/KeithBlogs) This starts with identifying and analyzing demographic and
for the last few months, you know that a recurring theme I em- socioeconomic variables for neighborhoods to successfully
phasize is the importance of a data-driven approach to planning. assess their needs. ArcGIS Community Analyst enables users to
It's a key tenet in being able to justify specific designs and devel- view over 1,700 variables to understand the makeup and needs
opments in a community, because it moves away from a strictly of neighborhoods down to the census block group level.
anecdotal approach (e.g., "I think this type of design would look
good in this neighborhood") to one that focuses on attainable
metrics (e.g., "This design will bring in x number of residents,
y number of jobs, etc."). As a planner, you have an advantage
over others in your organization in that you understand the types
of designs and developments that are likely to look and work
best in a neighborhood. This data-driven approach helps you
further quantify and qualify your recommendations.
While this is true in the planning of specific developments,
it's equally true in validating policy about where and why these
developments are needed. Often, these policies are created at a
higher level than the person designing the development This is a map of the metro Atlanta area showing households that have a
mortgage and spend at least 50 percent of their income on housing. The
(e.g., city manager, planning commissioner, elected official).
darker colors represent the highest concentrations of these households.
Planners and GIS play an integral role in decision-making
regarding housing policy because location is at the epicenter From a policy standpoint, this data helps us understand where
of this topic. Planners and policy makers must define the needs, affordable housing—combined with a sustainable economic
benefits, and challenges in assigning areas for affordable hous- mobility policy—is most needed. But it's not just homeowners
ing and economics, mitigating homelessness, and understand- who are struggling. Renters also make up a large percentage
ing the capacity for growth in neighborhoods. of the need for affordable housing, especially with younger
16 Esri News for State & Local Government Summer 2021generations. The Esri Maps for Public Policy app, part of ArcGIS employment opportunities (both present and planned) in the area.
Living Atlas of the World, provides free access to data that can Assigning values to each of these metrics allows me to assess
be used to help validate policy decisions. site suitability based on what's important to me as a policy maker.
Now, administrators, elected officials, stakeholders, and—of
course—planners can have a data-driven discussion about where
affordable housing needs to be. We've identified the need and
the best locations and methods to address that need. There's no
ambiguity about the data. It's clear-cut, and everyone can be on
the same page.
Taking a data-driven approach to site suitability, planners
can develop multiple housing scenarios in neighborhoods and
measure their potential effectiveness. Policy makers can then
evaluate and visualize these scenarios, collaborate with commu-
nity leaders, and engage the public to meet their transparency
On this map, we can see where renters in the metro Atlanta area are
and accountability expectations.
burdened by severe housing costs.
For more information on how you can begin leveraging GIS to
I can overlay my Renters map and my Homeowners map to determine how, where, and when your community designs
understand where the most crucial needs are for affordable would have the greatest impact in your community, visit
housing. However, there are often more factors that would drive go.esri.com/GIS-Validate-Policy.
our policy making. This is where the Policy Validation Application
(PVA), a free add-on to ArcGIS Urban, would come into play. This
allows me to take multiple variables at once, assign weights to
each metric, and identify the best location for affordable housing
down to the parcel level.
Specifically, I can look at the parameters that would drive the
feasibility of affordable housing in a neighborhood, such as
proximity to transit, grocery stores, schools, and health ser-
vices. Affordable housing as a policy doesn't work unless it's
coupled with economic mobility, so I would also want to look at
With the Policy Validation Application, users can easily toggle on and off the variables that matter to them and quickly visualize the site suitability
of a specific area.
Summer 2021 esri.com/localgov 17Addressing Recycling Challenges
By Jim Landwehr
A Wisconsin county devised a processing fully commingled recyclables operations using automated collection
began operating in March 2015. vehicles. The single-stream program
system to improve the quality of
After single-stream bins and educa- has been highly successful. Every year,
its recycling program using GIS tional materials were distributed to county it keeps 30,000 tons of material out of
for identifying and educating residents, haulers resumed collection landfills by processing it for recycling.
citizens who contributed unac-
ceptable items.
The Land Resources/Recycling Division
of the Department of Parks and Land
Use at Waukesha County, Wisconsin,
oversees a multijurisdictional recycling
program that has 27 municipalities within
its borders. For several years, Waukesha
County owned a material recovery facility
(MRF) that sorted collected materials and
then marketed them to various mills to
be used for new products.
The county facility was reaching the end
of its life cycle, as was a similar facility oper-
ated by the City of Milwaukee. After exten-
sive studies, it became clear that Waukesha
County and the City of Milwaukee should
co-invest in an MRF. Under an agreement
to collaborate, the single-stream facility for Employees work at the Waukesha County and the City of Milwaukee jointly funded MRF facility.
18 Esri News for State & Local Government Summer 2021However, it is not a perfect system. and compacting equipment and cause for assistance in locating, identifying,
Nonrecyclable or contaminated items are bottlenecks in processing as repairs are notifying, and educating residents
undesirable and expensive to process or conducted. who placed nonconforming items in
re-sort. Inbound material contamination recycling bins. Smith had seen GIS used
has been on the rise. At the same time, The County Addresses the for other applications at the county and
allowable contamination percentages in Problem—Literally thought it might be a good fit for the
outbound material have fallen to as low Waukesha County implemented an ed- Recycle Right program
as 0.5 percent. Soft demand for recycled ucational program called Recycle Right, At an initial assessment meeting,
raw materials allows buyers to more focused on public outreach and educa- Smith described the situation. She
closely scrutinize material for contaminants. tion. Its goal is to encourage recycling, explained that some trucks allowed
Materials turned away by buyers result in but perhaps as important is educating the drivers to see materials as they tip
lost income for the county. It also dimin- residents so that they know which items the bins. Other trucks are equipped
ishes the county's credibility as a quality are acceptable and which are not. with remote cameras that point toward
source of recycled material even as it In addition to social media blasts, post- the receiving bin of the vehicle, which
competes in an already tight market space. cards and flyers were sent to residents allows drivers to see obvious contami-
Unacceptable materials that residents with clarification on proper recycling nants and nonconforming items.
place in recycling bins are the source of practices. Truck drivers were instructed Once the LIS staff members had a
contamination. Plastic bags, hoses, and to use reminder tags on offending carts. clear understanding of these logisti-
propane tanks are just a few examples of Drivers were reluctant to do this because cal parameters, they inquired whether
these materials. Noncompliant materi- the process was time-consuming and put drivers would have access to portable
als—such as bowling balls, automotive drivers at risk when exiting vehicles. tablets for data capture. One of the two
brake rotors, and even deer carcasses— To improve the purity of recycled hauling contractors already had tablets
have come through the sorting line at materials received, Analiese Smith, in its trucks for other purposes. The
the MRF. In addition to the cost of prop- recycling and solid waste supervisor other hauler agreed to purchase tablets
erly disposing of these items, they can for Waukesha County, turned to the if needed to help increase compliance.
potentially damage expensive sorting Land Information Systems (LIS) division
Attendance at the Esri UC Pays
The workflow improving recycling begins with identifying offenders and their locations, Dividends
deriving their addresses, and using a Python script to generate reminder postcards that are
sent to offenders. The data acquired in this process populates an ArcGIS Dashboards app that At the 2019 Esri User Conference (Esri
provides an executive-level look at data distribution and transaction-level trends. UC), the LIS staff heard about a new
product called ArcGIS QuickCapture and
thought it might be useful for the project.
The QuickCapture interface is simple.
Large, single-function buttons are used
for on-the-move data collection.
Chris Dickerson, an LIS analyst, was
tasked with designing the application
and its related data model. The data
structure was kept simple. Initially, a
single point feature could have three
core subtypes: visible contaminants,
bagged materials, and visible contami-
nants and bagged materials. A fourth
subtype, compliant, was included so that
drivers could note locations of known
offenders who had cleaned up their bins.
After the application was designed,
the LIS and Land Resources/Recycling
staff did some localized testing for a
few weeks to see if the locational ac-
curacy was good enough using phone
and tablet GPS technology. Testing
continued on page 20
Summer 2021 esri.com/localgov 19public on problem areas and contami-
nant trends over time.
With a successful pilot project, the
Land Resources/Recycling division is pre-
paring to equip every truck in the con-
tractor fleets with the QuickCapture app.
The division is preparing to deal with the
projected increase in contaminant loca-
tions as well as the efforts required to
mail reminder cards to residents at those
locations. While a 30 percent decrease
in contaminant material is an aggressive
goal, the division hopes that significant
An executive-level dashboard provides a concise aggregation of data on offenders.
progress can be achieved through the
education and awareness focus of the
revealed that QuickCapture performed use, is a big proponent of using data
Recycle Right program. Using GIS to help
well, and point locations were deemed tracking, quantification, and visualiza-
zero in on offending areas is just one
accurate enough for the purposes of tion as part of his ongoing initiatives to
small part of a broader initiative toward a
the application. better serve the citizens of Waukesha
greener county and a better planet.
County. ArcGIS Dashboards provides an
Python plus Geoprocessing executive-level look at data distribution About the Author
Equals Data Enrichment and transaction-level trends in real time,
Jim Landwehr has more than 30
With some test data to work with, using interactive graphs, charts, and
years of experience in the AM/FM/GIS
Dickerson wrote a script in Python that heat maps.
mapping industry in both the public
takes the x,y point feature and—using Within a few days, Dickerson as-
and private sectors and is a certified
the Near geoprocessing function—finds sembled an intuitive and informative
geographic information system profes-
the nearest parcel polygon. Once a dashboard for the recycling staff's
sional (GISP). He has been working with
selection set is complete, the script joins review. Staff members were excited by
Esri software for over 20 years and is
the parcel polygon with the resident ad- the easy-to-use dashboard, which gave
proud of his division's accomplishments,
dress point, using the tax key number as them a deep-dive view into their data.
which include receiving the Esri Special
the common field. The graphs, charts, and maps in the
Achievement in GIS (SAG) Award in
Next, the script exports the joined dashboard are linked, so clicking on one
both 2004 and 2018. Landwehr earned a
tables into a Microsoft Excel spreadsheet component changes
bachelor's degree in geography/anthro-
that is emailed to the recycling staff. the data in the other panels dynamically
pology from the University of Minnesota.
Using the spreadsheet as well as mail to make the data
merge in Excel, recycling staff members easily discern-
create the mailing labels for postcards ible to users.
that gently remind offending residents of Another
recycling guidelines. advantage of
the dashboard
A Dashboard Brings It Together is that it can be
In September, a pilot project lasting used to brief
over a month was undertaken. A single supervisors,
truck in the hauler fleet collected the managers, and
location points for offenders, and the elected officials
card notification process was initiated on the progress
and tested. Anticipating that the full im- of the initia-
plementation of this plan would generate tive. It provides
a large, dynamic dataset, LIS supervisor tangible
Jim Landwehr requested that Dickerson numbers for
put together a Recycle Right operations reports and can
dashboard. even be used
Postcards are mailed to residents, notifying them that nonconforming
Dale Shaver, director of parks and land to educate the materials were found in their recycling bin.
20 Esri News for State & Local Government Summer 2021You can also read