Introduction - State Health and ...
←
→
Page content transcription
If your browser does not render page correctly, please read the page content below
Tracking Medicaid Coverage Post
    the Continuous Coverage Requirement:
    Using Data Dashboards to Monitor Trends
    Prepared by SHADAC
                                                                                                                          A grantee of the Robert Wood Johnson Foundation

    January 2022

Introduction
Medicaid and the Children’s Health Insurance Plan (CHIP) programs have played a key role in the response to the
COVID-19 pandemic, providing a vital source of health coverage for millions of people. The Families First Coronavirus
Response Act (FFCRA) Medicaid “continuous coverage” requirement has allowed people to retain Medicaid coverage
and get needed care during the COVID-19 pandemic. Enrollment in Medicaid and CHIP has grown sharply since
February 2020, with over 12 million enrollees added to state rosters as of May 2021.1 When continuous enrollment is
discontinued, states will restart eligibility redeterminations, and millions of Medicaid enrollees will be at risk of losing their
coverage.2 The current lack of publicly available and timely Medicaid enrollment, renewal, and disenrollment data will
make it difficult to understand exactly who is losing coverage and for what reasons. One effective way to monitor this
type of information is through the use of Medicaid enrollment and retention dashboards.
This issue brief examines the current status of data collection to assess Medicaid enrollment and retention, summarizes
potential forthcoming reporting requirements, and describes some of the best practices states should consider when
developing a data dashboard to display this type of information. The issue brief lays out a phased set of priority
measures and provides a model enrollment and retention dashboard template states could use to monitor both the
short-term impacts of phasing out public health emergency (PHE) protections and continuous coverage requirements,
as well as longer-term enrollment and retention trends.

Background
The federal government took two important steps to preserve Medicaid coverage for enrollees during the pandemic:
1) it required states to maintain continuous enrollment of Medicaid enrollees as a condition of receiving enhanced federal
funding under FFCRA,3 and 2) it allowed states to pause renewals and disenrollments for their CHIP enrollees.4 Under
current law, the continuous coverage requirement is tied to the federal PHE and will expire at the end of the month when
the PHE expires.i Guidance issued by the Centers for Medicare & Medicaid Services (CMS) in August 2021 allows states
to take up to a full year to catch up on delayed renewals and requires states to conduct a new review of eligibility before
disenrolling anyone.5
Many are concerned that re-starting the redetermination process could have significant effects on coverage, especially
for groups that have been economically and socially marginalized. As our colleagues at Manatt note, “Large-scale
disruption in health coverage as a result of the expiration of the federal PHE will have a disproportionate impact on
Black, Latino/a and other people of color, who are significantly overrepresented in state Medicaid programs.”6
However, there is very little publicly available data that would help states or stakeholders understand the impacts of
states’ unwinding policies on their Medicaid enrollees in real time. Without up-to-date reliable data, states, policymakers,
advocates, and other key stakeholders lose the opportunity to identify barriers populations may be facing in their efforts
to enroll or renew their Medicaid coverage, as well as opportunities to identify potential effective solutions.

i    The Build Back Better Act (BBB), which, as of the time of publication of this issue brief, has passed the House and awaits a vote in the Senate, would decouple the requirement
     from the PHE and instead phase out this enhanced Medicaid funding and allows states to resume processing renewals in April 2022. More information can be found here.

                                                                                                                                                                                       1
Existing Medicaid Enrollment Reporting                               Box 1. CMS Performance Indicator Project:
                                                                     Monthly Indicators
A monthly enrollment report published by CMS                         Call centers
summarizes three key indicators of states’ application and                • Indicator #1: Call Center Volume
enrollment activities: the number of applications received,               • Indicator #2: Call Center Wait Time
                                                                          • Indicator #3: Call Center Abandonment Rate
the number of people determined eligible, and the total              State Workload
enrollment at the end of the month.7 However, there is a                  • Indicator #5: Number of Applications Received
significant delay in the availability of this data. Although              • Indicator #6: Number of Electronic Accounts Transferred
                                                                          • Indicator #7: Number of Renewals Due
states have to report this information to the federal
                                                                          • Indicator #11: Number of Pending Applications of Redetermination
government each month, there is currently a                          Determinations
six-month lag before CMS publishes the data.                              • Indicator #9: Number of Individuals Determined Eligible
Additionally, while states are required to submit data on                 • Indicator #10: Number of Individuals Determined Ineligible
                                                                          • Indicator #12: Application Processing Time
performance indicators in eleven different topic areas               Enrollment
(see box 1), CMS only publicly reports the three measures                 • Indicator #8: Total Enrollment
highlighted in red.
Many states also report eligibility and enrollment data (for at least some of their Medicaid programs) directly on their
own public websites. A recent enrollment tracker and data book published by Manatt in March 2021, for example,
identified 46 states who report some kind of Medicaid enrollment data.8 Our review of those states identified 19 who
currently report enrollment data in near-real time (i.e., with a lag time of less than one month), as well as an additional
seven states who report data within two months. A review of those websites also found that states commonly
presented enrollment estimates in raw data tables or in monthly snapshot summaries with very little accompanying
analysis or explanation, which made it difficult to spot or interpret trends. Of the states that regularly report Medicaid
enrollment data, only six states—New Hampshire, New Jersey, Ohio, Oklahoma, Oregon and Washington—display
some kind of trend data visually (rather than just in tabular form). Washington (Figure 1), Ohio (Figure 2), and
Oklahoma (Figure 3) all use interactive, visual dashboards to display enrollment trends that allow users to see the
data broken down by various categories. Five of the six states report monthly enrollment data, with the exception of
Oregon, which reports weekly enrollment data (Figure 4).

Figure 1. Washington Enrollment Dashboard

Accessed December 6, 2021.

TRAC K I N G M E D I C A I D COV ERA G E POST T HE CONT INUOUS COVER AGE R EQUIR EMENT:                                                2
U S I N G D A T A D A SH B O ARDS T O M ONIT OR T RENDS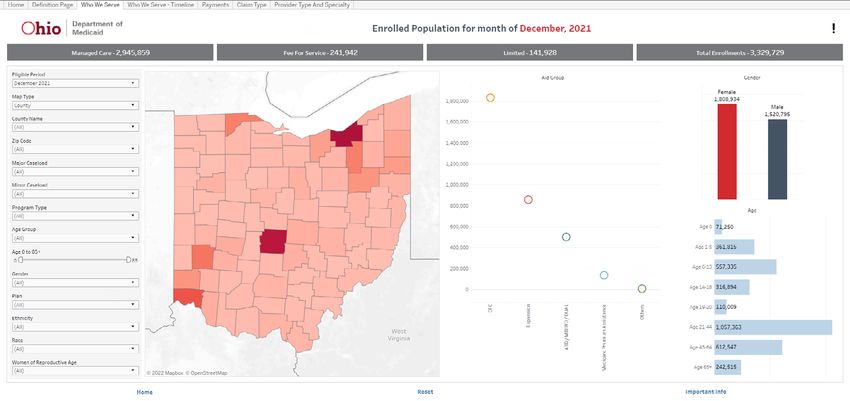
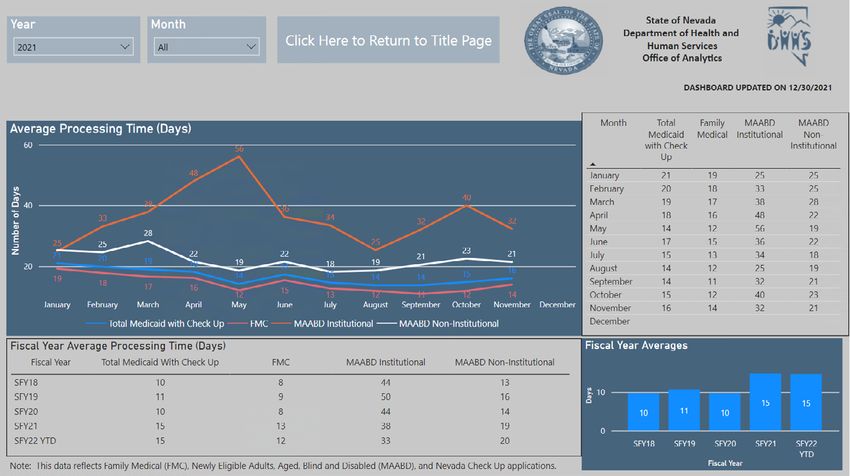
Figure 2. Ohio Enrollment Dashboard

Accessed December 14, 2021.

Figure 3. Oklahoma Enrollment Dashboard                      Figure 4. Oregon Health Plan Weekly Enrollment Report

Accessed December 14, 2021.                                   Accessed December 6, 2021.

Other Types of Reporting
Nevada was one of the few states we identified that included information beyond just enrollment data on their
dashboard, such as the number of pending applications (Figure 5).
Figure 5. Nevada Dashboard: Average Processing Time

Accessed December 6, 2021.

TRAC K I N G M E D I C A I D COV ERA G E POST T HE CONT INUOUS COVER AGE R EQUIR EMENT:                              3
U S I N G D A T A D A SH B O ARDS T O M ONIT OR T RENDS
Call center statistics, which comprise three of the existing CMS Performance Indicators, can be another extremely
useful set of metrics that could help serve as an early warning sign as to how applicants and enrollees are faring as
renewals and redeterminations begin. Several states with state-based marketplaces (SBMs) report this information
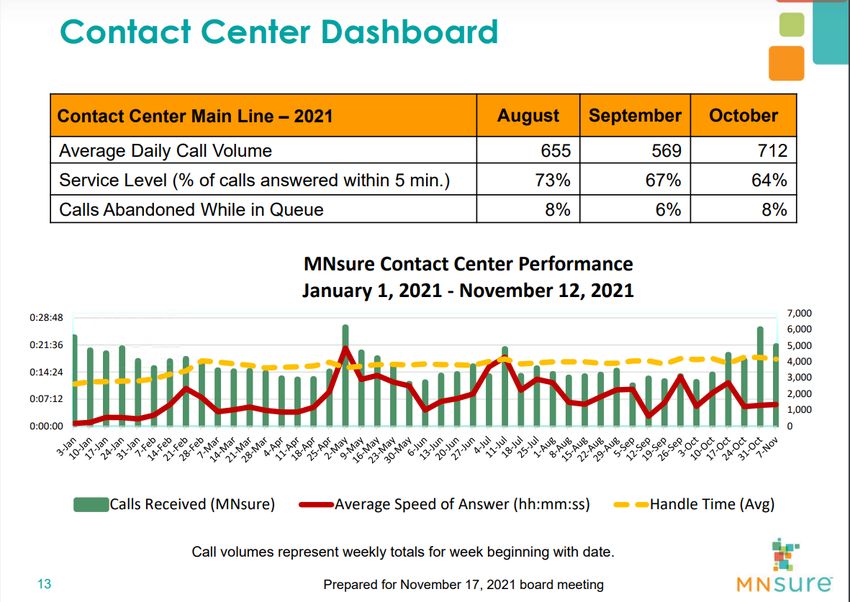
on their SBM websites or to their marketplace Board of Directors. Minnesota, for example, reports call center statistics
at their monthly Board meeting (Figure 6). Very few states, however, make their call center data and Medicaid
enrollment or renewal data available in the same place, making it difficult to determine if the trends in one area are
correlated with another.
Figure 6. MNsure Contact Call Center Dashboard
Accessed December 6, 2021.
Potential New Reporting Requirements
According to guidance published in December 2020 regarding resuming Medicaid operations at the conclusion of
the PHE, CMS plans to require states to submit data demonstrating progress in completing outstanding eligibility and
enrollment actions related to applications, verifications, changes in circumstances, and renewals post-PHE. CMS has
been working on identifying the data elements to be reported and indicated that they will provide a reporting template
for states to use, however this information has not been released publicly.
The Build Back Better Act (BBB), if passed in its current form, also contains language that will require those states
who accept the phased-down federal medical assistance percentage (FMAP) increase to collect and report additional
enrollment and renewal data. The legislation requires that, beginning April 1, 2022, states submit monthly reports on
the following9:
• The number of eligibility renewals initiated
• The number of beneficiaries renewed
• The number of individuals whose eligibility was terminated
• The number of cases in which eligibility was terminated due to procedural reasons such as an individual’s
failure to return a renewal form or other information needed by the state to make an eligibility determination.
• The number of such cases in which eligibility was terminated pursuant to a redetermination of ineligibility
based on a known change in circumstance.
• The number of individuals whose coverage was terminated whose accounts were transitioned to the
Exchange, CHIP, or basic health program.
• The daily average volume, wait times, and abandonment rate for each call center during such month.
TRAC K I N G M E D I C A I D COV ERA G E POST T HE CONT INUOUS COVER AGE R EQUIR EMENT: 4
U S I N G D A T A D A SH B O ARDS T O M ONIT OR T RENDS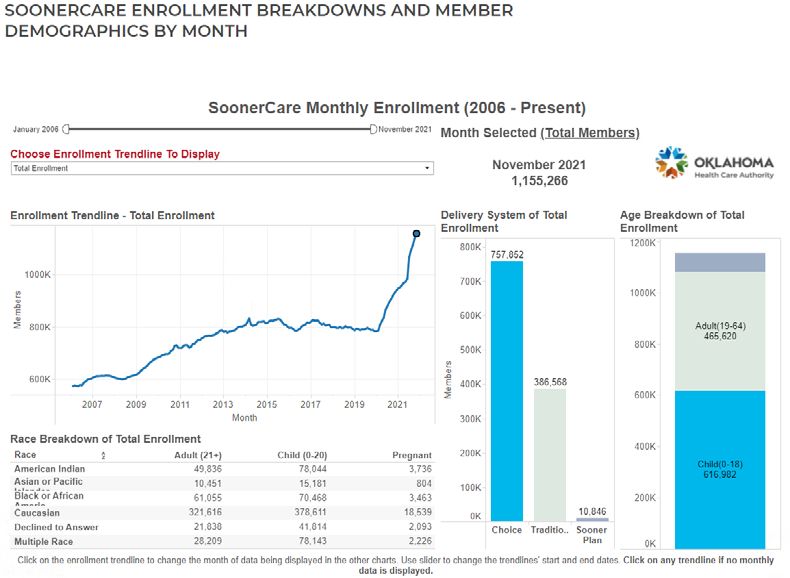
Although we do not yet have detailed definitions for these metrics, it appears that some of these required
measures (e.g., the call center statistics and the number of individuals whose eligibility was terminated) are
already being submitted through CMS’ Performance Indicator Project, but are not currently published openly. The
remaining measures appear to represent new information that states will need to submit. It is unclear at this point
which (if any) of these measures CMS will report publicly.
A Role for Dashboards in Monitoring the Unwinding of the Continuous Coverage Requirement
A typical data dashboard is designed to organize complex data in an easy-to-digest visual format, thus allowing
the audience to easily interpret key trends and patterns at a glance. This approach lends itself well to a state’s
objective of monitoring the impact of the end of the continuous coverage requirement on Medicaid enrollment.
A dashboard imparts several benefits that can be especially helpful in this specific situation, including:
Ease of Interpretation: Visual displays of trend data (rather than tables of raw numbers) can help make it easy
to spot early warning signs of large numbers of people losing Medicaid coverage.
Transparency and Accountability: Designing an easy-to-understand dashboard that is accessible to all
interested stakeholders—state or county program staff, navigators or enrollment assisters, and advocates—will
help these groups understand who is losing Medicaid coverage and why. Access to this data gives stakeholders
an opportunity to take action, such as by adjusting outreach strategies or modifying communication messages
with enrollees, in order to minimize needless loss of coverage.
Highlighting Inequity: Dashboards can clarify variations within states that might not be obvious otherwise.
Data broken down by various population characteristics (e.g., age, race/ethnicity, income, gender, language,
or program type) or geographic areas (e.g., urban, rural) make it easier to understand the potentially
disproportionate impact of administrative enrollment and renewal policies on communities of color, persons with
lower incomes, and other populations that face disparities.
Measurement Priorities and Medicaid Enrollment Dashboard Mock Example
One of the most challenging aspects of developing a useful data-monitoring strategy can be prioritizing which among
the many measures available are best for reporting and sorting through the myriad options for visualizing the data.
Below, we outline approaches that states can consider for prioritizing information and provide a template for developing
a useful enrollment dashboard.
Priority One – CMS Performance Indicators
We encourage states interested in publishing a public Medicaid enrollment data dashboard to use a phased approach
to incorporating measures, starting with the data that are already collected and submitted to CMS. This includes
measures under the 11 Medicaid performance topics described previously in the first section of this brief (see Box 1).
Making all of this existing data public would be an important first step toward transparency and accountability for states
and would help stakeholders and program staff to adjust outreach strategies in timely ways to ensure eligible individuals
remain enrolled.
For each of the 11 performance indicator topics, we recommend displaying the top-level metric on a public-facing data
dashboard. Below we provide an example of a model data dashboard that summarizes these performance indicator
measures (Figure 7).This model template uses mock data to illustrate how to incorporate some of our data visualization
best practices (see Box 2) with the application, enrollment and renewal data states are required to report, and it displays
the data broken down by program type, age, gender, race/ethnicity, income, language, and geography.
TRAC K I N G M E D I C A I D COV ERA G E POST T HE CONT INUOUS COVER AGE R EQUIR EMENT: 5
U S I N G D A T A D A SH B O ARDS T O M ONIT OR T RENDS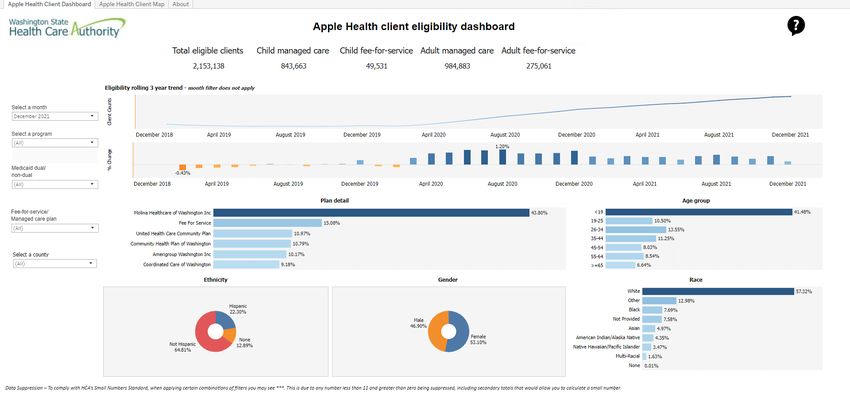
Figure 7. Mock Data Dashboard Example

                                                                                             Click to expand

Priority Two – New BBB Requirements
Regardless of whether BBB passes or not, the data elements laid out in the BBB could help states more fully
understand the impact of restarting Medicaid renewal processes, including who is losing coverage and why. The data
source for several of these requirements will most likely be states’ denial and disenrollment codes. States will need to
assess how well their existing coding structures align with the data that CMS is requesting. We know from previous
research, as well as a more recent analysis, that existing denial and disenrollment coding systems often make it difficult
for states to track the reasons people fall off of Medicaid, or are denied coverage in the first place. Several states have
indicated that their existing denial codes are either not specific enough or are not used consistently enough to be
helpful in understanding the reasons people are being disenrolled. In addition, sometimes states’ computer systems
automatically close cases in certain situations, and these types of closures might not include a reason.10 If the BBB
act passes, some states may need to implement a new code or flag in order to identify cases in the manner that the
language requires, including codes for:
    • Those individuals that are disenrolled due to failure to return forms or other needed information;
    • Those individuals that are disenrolled due to a change in circumstance; and/or
    • Those individuals that are disenrolled and transferred to another program.

Below, we provide another example of a model data dashboard, using mock data, to illustrate how a state could add
visualizations representing the BBB required reporting to their data dashboards (Figure 8). As in our first example, these
modules incorporate some of our data visualization best practices and would allow the user to display the data broken
down by program type, age, gender, race/ethnicity, income, language, and geography.

TRAC K I N G M E D I C A I D COV ERA G E POST T HE CONT INUOUS COVER AGE R EQUIR EMENT:                                       6
U S I N G D A T A D A SH B O ARDS T O M ONIT OR T RENDS
Figure 8. Model BBB Dashboard
Click to expand
Box 2. Dashboard Best Practices
Most states already have experience setting up and maintaining data dashboards, such as with their COVID-19 data. Many
of the best practices suggested for those types of dashboards apply to any potential Medicaid enrollment dashboard as well,
including recommendations to:
Consider the audience. Before designing a dashboard, make sure to clearly identify who is the intended audience.
Different levels of detail, explanation, or source information may be necessary depending on whether the intended audience
is state agency leadership, political leadership, or the general public. In this case, we recommend making high-level
enrollment and renewal data available to the general public.
Prioritize key measures. (See below for our suggestions for prioritization.) Because timeliness of this data is so important,
the dashboard needs to have enough data points to convey key information, but be limited enough to update quickly.
Prioritize disaggregating data. At the minimum, we recommend displaying data breakdowns by program type, age,
race, ethnicity, language, income, and geography (ZIP code is best, but county or any other level lower than just statewide
is helpful). States should also consider additional breakdowns as the data is available, such as disability status and sexual
orientation and/or gender identity. For example, in this case, reporting by income or Federal Poverty Level (FPL) might
be important to signify whether someone is losing eligibility because of a change in policy or falling off because of an
administrative hurdle.
Report on the same set of measures consistently, and on a set schedule. To effectively monitor enrollment data,
weekly data updates are ideal but at least monthly is recommended.
TRAC K I N G M E D I C A I D COV ERA G E POST T HE CONT INUOUS COVER AGE R EQUIR EMENT: 7
U S I N G D A T A D A SH B O ARDS T O M ONIT OR T RENDSBox 2 Cont. Dashboard Best Practices
Display time-series data. Visually displaying time-series data is an effective way to track changes. In order to improve
readability, try to ensure that all time-trended data on the dashboard starts with the same date and covers the same time
period, if possible. Use graphic depictions to highlight key messages.
Address reporting lags. States often have to make various adjustments retroactively to an enrollment dataset as
additional information is collected. Through the passage of time, the reported count for a particular month may progressively
move closer to the actual final count. States do not need to wait until data is final to post it publicly. They can address the
time lag issue in their dashboards by including language about when a specific month’s enrollment count is considered
complete, or by highlighting or shading data points that are still preliminary in a way that makes that distinction obvious.
Include both proportions and counts. Proportions are especially useful to help make comparisons across states, but
counts are critical for understanding the magnitude of impacts within states.
Keep organization and layout simple. It is helpful to have a landing page that makes all indicators visible to users with
limited scrolling, but also provides users with the ability to “drill down” to more detail—comparisons, methodology, etc. If it is
not possible to show all indicators, there should be an obvious and intuitive option for the user to “hover” over a list and get
an “at-a-glance” view of the available content.
Include data labels, definitions, and sources. Provide clear data labels and documentation. Although you should
avoid “cluttering” a dashboard with extensive text, it is also important to provide the audience with information about data
definitions and sources. If there is not room for a notes or definitions section on the dashboard consider using a “hover”
function to display additional information.
Utilize visualizations. Choose visualizations that are clean and compliant with a range of browsers. Simple visualizations
can also help users interpret more complex data “at a glance.” For example, many dashboards use up or down arrows to
indicate whether most recent data show improvements or declines.
Priority Three—Longer Term Monitoring of Enrollment and Eligibility
These dashboards could also be modified and expanded to serve Medicaid programs beyond the phasing out of the
continuous coverage requirement. For example, states could consider adding additional measures to address issues
of transitions between programs and churn—the moving in and out of coverage—that frequently occurs in Medicaid
and CHIP. Understanding churn is important because recent research has found that churning results in higher
administrative costs, less predictable state expenditures, and higher monthly healthcare costs due to pent-up demand
for healthcare services.11
Prior work done at the time of the initial implementation of the Affordable Care Act, such as the Maximizing Enrollment
project,12 identified several cross-program enrollment data metrics that are still potentially useful today. Many of the
measures recommended drawing from existing data sources and would not require new data collection, but would
require additional analysis and data linkages that states may not be doing routinely now, such as linking a person’s
enrollment over time/program(s). The Maximizing Enrollment Project identified several potential measures that address
this topic, including measures of13:
Churn. The number of program disenrollees in a given month who later re-enroll in the program following a
gap in coverage of one to six months.
Overall retention at 6, 12, and 18 months. The proportion of individuals entering the program 6, 12, or 18
months ago and who are still enrolled this month.
Seamless transitions. The number of people who leave the program in a given month and enroll in
another insurance affordability program with no gap in coverage.
Non-seamless transitions. The number of people who leave the program in a given month and enroll in
another insurance affordability program, with a gap in coverage (e.g., of one to six months).
Long-term departures. The number of people who leave the program in a given month and do not re-
enroll in any program for more than six months.
TRAC K I N G M E D I C A I D COV ERA G E POST T HE CONT INUOUS COVER AGE R EQUIR EMENT: 8
U S I N G D A T A D A SH B O ARDS T O M ONIT OR T RENDSSince these measures are typically considered over a longer time period than the CMS Performance Indicators or BBB
required measures (over six months versus one month, respectively), we would suggest creating a separate “churn”
dashboard to display this information rather than including it on your main enrollment dashboard.
Priority Four – Understanding the Enrollee Experience
A fourth priority for states interested in even more deeply understanding how enrollees or applicants experience the
application, enrollment, and renewal process would require new data collection. States could field a disenrollment
survey in order to gather both quantitative and qualitative data that could be used to understand both the enrollee’s
experience navigating Medicaid processes as well as the consequences of disenrollment. Potential survey topics
could address experience enrolling in Medicaid; understanding and knowledge of coverage options; the reasons
for disenrollment; resulting financial burden, stress, and impact on healthcare access; and subsequent health
insurance status of disenrolled individuals. In the interest of better understanding coverage transitions and reasons for
disenrollment, these surveys can rely on a convenience sample of respondents to an online survey sent to disenrolled
individuals via text or email, which can greatly reduce the cost and limit burden on staff time.
If a state has in-house expertise, funding, or can leverage an existing partnership (e.g., a state-University partnership),
they could also consider a more robust mixed method survey that employs a mailed survey, with an online option
supplemented by interviews. For example, in 2019, Iowa conducted a survey of members who were disenrolled from
its Iowa Health and Wellness Plan, the program the state used under its 1115 waiver to expand Medicaid to individuals
with income up to 138 percent of FPL. That survey found that disenrollment had negative effects including stress,
financial burden, and engaging in behaviors such as skipping medication and postponing medical or dental care. It also
found disenrollees were often unable to enroll in health insurance.14
Considerations
As states consider whether and how to implement public facing data dashboards they will have to take several issues
into account:
Staffing and analytic capacity. Analytic capacity varies considerably across states—some have entire
departments dedicated to analytics, while others have only a single person. As previously mentioned, as
states look to expand data collection beyond the existing CMS performance indicators, they likely will have
to perform more complex data analysis and/or establish data linkages to other systems. Not all states will
have the capacity to do this initially, which is why we recommend states leverage the data they already
have available rather than first attempt to report new data. To limit staff burden we also encourage states
to set up dashboards that update automatically with as little manual input as possible; building direct feeds
from their Medicaid Information Systems to Tableau displays, for example.
Availability of funding to support data reporting & analytics. States may be able to request federal
financial support information technology (IT) for new data efforts. The December 2020 PHE unwinding
guidance from CMS, for example, indicates that states can submit emergency IT funding requests
to obtain federal financial participation in their expenditures to expand the state’s ability to support
automated data processing systems. Emergency IT funding requests can also be submitted for IT
infrastructure enhancements necessary to support the state’s plan, including “claims processing, eligibility
determinations, reporting, analytics, data collection, and applied research.”15 This authority is not limited
to the period of the COVID-19 PHE declaration, and is intended to be more streamlined than the advance
planning document process by which states typically request funding approval.16
TRAC K I N G M E D I C A I D COV ERA G E POST T HE CONT INUOUS COVER AGE R EQUIR EMENT: 9
U S I N G D A T A D A SH B O ARDS T O M ONIT OR T RENDS Coordination between Medicaid and Marketplaces. States will have to take into account their level of
coordination and ability to share data with their state-based marketplace (SBM) or the federally facilitated
marketplace (FFM) in order to produce some of the recommended metrics, such as call-center data or
information on the number and outcome of electronic transfers. For states in which the same agency
operates its Medicaid program and the SBM, there may be fewer barriers to linking the data. However, for
states whose exchanges are run by independent agencies and states relying on the FFM, there may be
more substantial barriers to linkages, such as coordinating across agencies to determine what data are
available in their different systems and how data from the different agencies’ systems may be linked, as
well as developing data use agreements and procedures for securely sharing data.
Addressing missing or incomplete data. We know many states have high levels of missing or incomplete
race and ethnicity data for their Medicaid enrollees, and that the type and granularity of information
that states collect varies considerably. States may need to invest in updates to their question wording,
instruction, online interfaces, and enrollment or assister training in order to improve their demographic
data to a point that it is useful. In the meantime, states can apply small numbers standards (i.e., rules to
suppress small numbers in analyses) in order to protect privacy and confidentiality of individuals when they
display data broken down by demographic groups. For states that do report data on breakdowns where
there are potentially large amounts of missing data, such as by race, we recommend including detail about
the scope of the missing data (and the reason, if possible) to help users interpret the findings.
States are already collecting a significant amount of data that could describe how successful they are in enrolling or
retaining eligible individuals in Medicaid. Making that data publicly available in an easy-to-digest, visually appealing
way, such as through a data dashboard, would be an important first step in efforts to improve the transparency,
accountability, and equity of the Medicaid program. It also would allow key stakeholders, including state staff,
policymakers, and advocates to more fully understand the impacts of changes to Medicaid policies and procedures on
enrollees’ ability to access health coverage during these unprecedented times, and give them an opportunity to modify
or implement intervention strategies as needed. As states gain experience publicly reporting this data, and data systems
and expertise evolve, they can consider adding additional data collection activities and measures that would more fully
elucidate the enrollee experience.
TRAC K I N G M E D I C A I D COV ERA G E POST T HE CONT INUOUS COVER AGE R EQUIR EMENT: 10
U S I N G D A T A D A SH B O ARDS T O M ONIT OR T RENDSE NDN O TES
1. Centers for Medicaid & Medicaid Services (CMS). (September 2021). May 2021 Medicaid and CHIP Enrollment Trends Snapshot [PowerPoint slides]. Medicaid
and CHIP Learning Collaboratives. https://www.medicaid.gov/medicaid/national-medicaid-chip-program-information/downloads/may-2021-medicaid-chip-
enrollment-trend-snapshot.pdf
2. Buettgens, M. & Green, A. (September 2021). What Will Happen to Unprecedented High Medicaid Enrollment after the Public Health Emergency?
[Research report]. Urban Institute. https://www.urban.org/sites/default/files/publication/104785/what-will-happen-to-unprecedented-high-medicaid-enrollment-
after-the-public-health-emergency_0.pdf
3. Families First Coronavirus Response Act, HR 6201, § 6008(b)(3).
4. Centers for Medicare & Medicaid Services (CMS). (2012, January 10). Example of CHIP Disaster Relief State Plan Amendment. chip_disaster_relief_spa_
sample_01102012.pdf (medicaid.gov)
5. Centers for Medicare & Medicaid Services (CMS). (2021, August 13). Updated Guidance Related to Planning for the Resumption of Normal State Medicaid,
Children’s Health Insurance Program (CHIP), and Basic Health Program (BHP) Operations upon Conclusion of the COVID-19 Public Health Emergency
[SHO# 21-002]. Department of Health & Human Services (DHHS). https://www.medicaid.gov/federal-policy-guidance/downloads/sho-21-002.pdf
6. Boozang, P. & Striar, A. (2021, October 5). The End of the COVID-19 PHE and Medicaid Continuous Coverage: Health Equity Implications. Manatt Health
Highlights. https://www.manatt.com/insights/newsletters/health-highlights/the-end-of-the-covid-19-phe-and-medicaid-continuou
7. Centers for Medicare & Medicaid Services (CMS). (n.d.). Medicaid and CHIP Enrollment Trend Snapshot. Medicaid.gov. https://www.medicaid.gov/medicaid/
program-information/medicaid-chip-enrollment-data/medicaid-and-chip-enrollment-trend-snapshot/index.html
8. Mann, C. & Striar, A. (2021, March 5). Tracking Medicaid Enrollment Growth during COVID-19 Databook. State Health & Value Strategies (SHVS). https://www.
shvs.org/resource/tracking-medicaid-enrollment-growth-during-covid-19-databook/
9. Rules Committee Print. (2021, November 3). Build Back Better Act, HR 5376.
10. Rosenbaum, D. (2015, March 20). Lessons Churned: Measuring the Impact of Churn in Health and Human Services Programs on Participants and State and
Local Agencies. Center on Budget and Policy Priorities (CBPP). https://www.cbpp.org/research/lessons-churned-measuring-the-impact-of-churn-in-health-and-
human-services-programs-on
11. Sugar, S., Peters, C., De Lew, N., & Sommers, B. (2021, April 12). Medicaid Churning and Continuity of Care: Evidence and Policy Considerations Before and
After the COVID-19 Pandemic [HP-2021-10]. Office of the Assistant Secretary for Planning and Evaluation (ASPE). https://aspe.hhs.gov/sites/default/files/private/
pdf/265366/medicaid-churning-ib.pdf
12. Trenholm, C., Harrington M., Snyder, A., & Weiss, A.M. (2011, November 1). Using Data to Drive State Improvement in Enrollment and Retention Performance.
Robert Wood Johnson Foundation (RWJF). https://www.rwjf.org/en/library/research/2011/11/using-data-to-drive-state-improvement-in-enrollment-and-retentio.
html
13. Trenholm, C., Harrington M., Snyder, A., & Weiss, A.M. (2011, November 1). Using Data to Drive State Improvement in Enrollment and Retention Performance.
Robert Wood Johnson Foundation (RWJF). https://www.rwjf.org/en/library/research/2011/11/using-data-to-drive-state-improvement-in-enrollment-and-retentio.
html
14. Askelson, N.M., Brady, P., Wright, B., Bentler, S., Momany, E.T., & Damiano, P. (2019, December 6). Purged from the Rolls: A Study of Medicaid Disenrollment in
Iowa. Health Equity, 3(1), 637-643. https://doi.org/10.1089/heq.2019.0093
15. Centers for Medicare & Medicaid Services (CMS). (2020, December 22). Updated Guidance Planning for the Resumption of Normal State Medicaid, Children’s
Health Insurance Program (CHIP), and Basic Health Program (BHP) Operations upon Conclusion of the COVID-19 Public Health Emergency [SHO# 20-004].
Department of Health & Human Services (DHHS). https://www.medicaid.gov/federal-policy-guidance/downloads/sho20004.pdf
16. Centers for Medicare & Medicaid Services (CMS). (2020, December 22). Updated Guidance Planning for the Resumption of Normal State Medicaid, Children’s
Health Insurance Program (CHIP), and Basic Health Program (BHP) Operations upon Conclusion of the COVID-19 Public Health Emergency [SHO# 20-004].
Department of Health & Human Services (DHHS). https://www.medicaid.gov/federal-policy-guidance/downloads/sho20004.pdf
TRAC K I N G M E D I C A I D COV ERA G E POST T HE CONT INUOUS COVER AGE R EQUIR EMENT: 11
U S I N G D A T A D A SH B O ARDS T O M ONIT OR T RENDSSupport for this issue brief was provided by the Robert Wood Johnson Foundation. The views expressed here do not necessarily reflect the views of the Foundation. ABOUT THE ROBERT WOOD JOHNSON FOUNDATION The Robert Wood Johnson Foundation (RWJF) is committed to improving health and health equity in the United States. In partnership with others, we are working to develop a Culture of Health rooted in equity, that provides every individual with a fair and just opportunity to thrive, no matter who they are, where they live, or how much many they make. For more information, visit www.rwjf.org. Follow the Foundation on Twitter at www.rwjf.org/twitter or on Facebook at www.rwjf.org/facebook. ABOUT STATE HEALTH AND VALUE STRATEGIES—PRINCETON UNIVERSITY SCHOOL OF PUBLIC AND INTERNATIONAL AFFAIRS State Health and Value Strategies (SHVS) assists states in their efforts to transform health and healthcare by providing targeted technical assistance to state officials and agencies. The program is a grantee of the Robert Wood Johnson Foundation, led by staff at Princeton University’s School of Public and International Affairs. The program connects states with experts and peers to undertake healthcare transformation initiatives. By engaging state officials, the program provides lessons learned, highlights successful strategies and brings together states with experts in the field. Learn more at www.shvs.org. ABOUT STATE HEALTH ACCESS DATA ASSISTANCE CENTER (SHADAC) This issue brief was authored by Emily Zylla and Lindsey Theis. SHADAC is an independent, multi-disciplinary health policy research center, housed in the School of Public Health at the University of Minnesota, with a focus on state policy. SHADAC produces rigorous, policy-driven analyses and translates its complex research findings into actionable information for states. TRAC K I N G M E D I C A I D COV ERA G E POST T HE CONT INUOUS COVER AGE R EQUIR EMENT: 12 U S I N G D A T A D A SH B O ARDS T O M ONIT OR T RENDS
You can also read