INVESTIGATING FACTORS INFLUENCING CLASS ATTENDANCE AND PERFORMANCE OF FIRST-YEAR ECONOMICS STUDENTS
←
→
Page content transcription
If your browser does not render page correctly, please read the page content below
INVESTIGATING FACTORS INFLUENCING CLASS ATTENDANCE
AND PERFORMANCE OF FIRST-YEAR ECONOMICS STUDENTS

C. Swanepoel*
https://orcid.org/0000-0003-0906-8995

R. Beukes*

D. Yu*
https://orcid.org/ 0000-0001-9813-7897

*University of the Western Cape
Department of Economics
Cape Town, South Africa

ABSTRACT
      The academic success of first-year Economics students has been examined in many South
      African studies in Economic Education. These studies controlled for differences in demographic
      characteristics, last school examination (Matric) subjects and results, as well as lecture and tutorial
      attendance when investigating differences in students’ performance. While there is an abundance
      of international studies investigating the main reasons for attendance or non-attendance, these
      studies are rare in the South African context, especially in the field of Economics. Hence, this
      study fills the existing local research gap by investigating factors influencing lecture attendance as
      well as their possible impact on the performance of first-year Microeconomics students at the
      University of the Western Cape.
             The key empirical findings suggest that both lecture and tutorial attendance had a positive
      and significant impact on both the likelihood of qualifying to write the examination as well as the
      examination mark. In addition, students who enrolled in Economics in Matric and obtained better
      marks in first-year Macroeconomics in the previous semester performed significantly better in the
      Microeconomics examination. It was also found that the main reasons for not attending lectures
      are academically related, with the top reason being “busy studying for tests”. Furthermore,
      students who regarded tutorials as a replacement for lectures significantly suffered nearly five
      marks lower in the examination.
             We recommend revisions to teaching methods and making lecture attendance compulsory
      and part of assessments. Furthermore, given lecture attendance is low, revisions to timetables
      should be considered and expanded transportation be made available to students. Lastly, students
      should be given the necessary time management tools to adjust to greater workloads at university.
      Keywords: Economics education, class attendance, academic performance

South African Journal of Higher Education https://dx.doi.org/10.20853/35-4-4129
Volume 35 | Number 4 | September 2021 | pages 272‒294                                        eISSN 1753-5913
                                                            272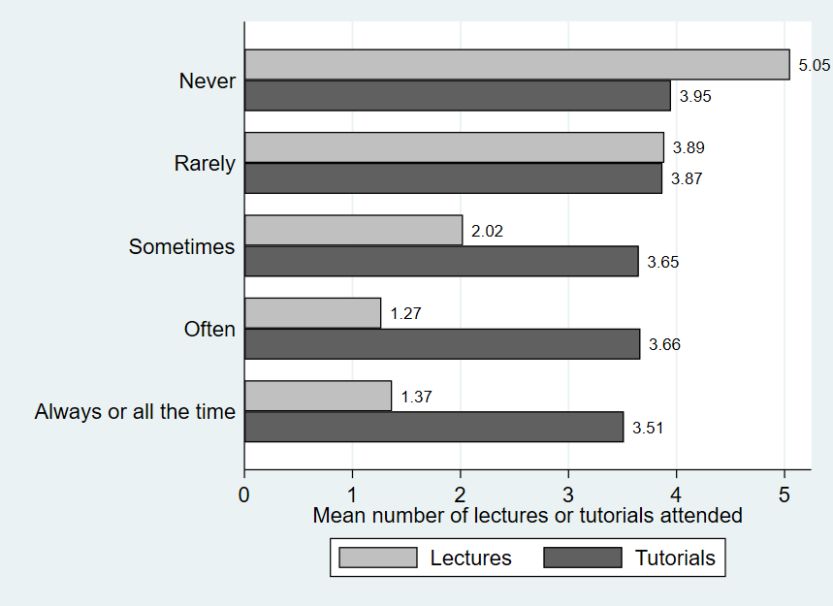
Swanepoel, Beukes and Yu                       Investigating factors influencing class attendance and performance

INTRODUCTION
Over the last couple of decades, factors influencing the success of first-year Economics students
have been comprehensively studied and researched. These studies focused on a wide range of
factors including personal characteristics (e.g., gender, population group and age), school
performance specifically Grade 12 (Matric) entry points and school subject choices (such as
Mathematics, Mathematical Literacy, English home language and Economics) and university
characteristics (e.g., campus residence, type and duration of programmes). The research also
considered study characteristics like lecture attendance, tutorial attendance, study hours as well
as intervention programmes like mentorship and student engagement; all these factors were
found to have a positive impact on students’ academic performance.
      In particular, higher lecture attendance is associated with significantly better academic
performance as expected, but Romer (1993) found that on average one-third of students are not
in class. Hence, the following question comes to mind: why are students not in class? Various
international studies (to be reviewed later) examined factors relating to low lecture attendance,
such as course characteristics and perceived quality of lecturers and lectures, student
motivation, and student characteristics like age, gender, grade point average (GPA) and part-
time work status. However, why lecture attendance is low is not studied extensively in the
existing local literature besides a few to note.
      Teaching and learning environments have changed dramatically over the last two decades.
Technology has opened the doors to online blending learning, and significantly changed how
academics teach and assess students’ learning. Students have access to PowerPoint slides,
videos, voice recordings and other resources, which help facilitate greater engagement with
students. Nonetheless, access to blended learning should enhance the offering to students but
not adversely affect class attendance if used correctly (Riffell and Sibley 2004). Therefore, this
study aims to fill the local research gap in Economic Education by investigating factors that
influence lecture attendance of first-year Economics students and how these factors influence
their academic performance. The specific research objectives are as follows:

•     To conduct descriptive statistics analysis on personal and study characteristics of the
      students.
•     To investigate the main reasons of absence from lectures; these causes are classified into
      three main categories, namely academic, institutional and personal causes.
•     To conduct multivariate econometric analysis to investigate the impact of various factors
      on academic performance.

                                                   273
Swanepoel, Beukes and Yu Investigating factors influencing class attendance and performance
Our forthcoming empirical findings first support the existing literature that lecture and tutorial
attendance matter significantly for academic performance. Further, we find that the major
reasons students are absent from lectures are academic in nature. The lecture day and time also
have a significant impact on lecture attendance.
REVIEW OF PAST EMPIRICAL STUDIES
Local studies
The first local study on Economics students’ performance was conducted by Edwards (2000)
at the University of Cape Town (UCT) by distinguishing students from disadvantaged schools
from those attending more privileged schools. Unfortunately, this study did not investigate class
attendance. Van Walbeek (2004) investigated the academic performance of UCT first-year
Economics students; he found that, on average, an additional lecture attended led to a small yet
significant 1.5 point increase of final mark, ceteris paribus.1
Parker (2006) investigated first-year Economics performance in five anonymous
universities and found that male English-speaking students who studied at least two hours per
week outside classes enjoyed significantly better performance. Van der Merwe (2006) showed
that demographic and school characteristics, and even motivational factors (e.g., enrolled the
course voluntarily to obtain extra credit; purchased the prescribed textbook early in the
semester) did not have any statistically significant impact on first-year Economics performance
at the Durban Institute of Technology.
Smith and Edwards (2007) investigated the impact of an academic development
programme (equivalent to a 4-year extended programme) at UCT. They founded that the
extended programme helped improve students’ learning, English language and writing skills,
and in general the extended programme students outperformed the 3-year mainstream
programme students in both first- and second-year Economics studies, ceteris paribus. A
subsequent study by Smith (2009) on UCT first-year Microeconomics students over a 6-year
period confirmed the results of Smith and Edwards (2007).
Horn and Jansen (2009) examined the impact of both lecture and tutorial attendance. Their
empirical findings confirmed that both higher lecture and tutorial attendance, along with better
Matric results, had a significantly positive impact on first-year Economics performance at
Stellenbosch University (SU). Horn, Jansen, and Yu (2011) is focused on second-year
performance at SU; while lecture and tutorial attendance remained significant explanatory
variables, first-year performance also had a significant positive impact. Dlomo et al. (2011)
274Swanepoel, Beukes and Yu Investigating factors influencing class attendance and performance
found that both attendances only had a significant impact on the University of the Western Cape
(UWC) first-year Economics students’ probability to qualify to final examination, but other
factors such as gender, matriculation under the 2008 National Senior Certificate (NSC)
curriculum, part-time work status and study hours were the key explanatory variables
influencing exam marks.
Schreiber and Yu (2016), using the 2013 South African Survey of Student Engagement
(SASSE) data, found that two out of 10 engagement indicators – collaborative learning and
higher-order learning – positively and significantly impacted on academic performance of
undergraduate students at UWC. Dos Reis and Yu (2018) found that first-year UWC Economics
students who participated in the peer-mentoring programme on average scored four points
higher in both examination and final marks, ceteris paribus. Moreover, tutorial attendance had
a positive impact on academic performance.
To the authors’ knowledge, only four local studies examined causes of low class
attendance. Jordaan (2009) found that the three dominant reasons for students attending lectures
at the University of Pretoria (UP) were “to find out what I am supposed to learn”, “to make sure
I don’t miss anything important” and “to make the knowledge meaningful”. Moreover, the
provision of online learning resources did not adversely affect lecture attendance, and there was
a positive association between lecturer evaluation and lecture attendance. The latter finding was
also confirmed by Wadesango and Machingambi (2011) in their study on student absenteeism
at three South African universities. The other reasons for absenteeism included, amongst others,
part-time work commitment, preference to spend time with friends and peers, lack of interest
in the subject and the need to study for tests and complete assignments.
Schmulian and Coetzee (2011) found the main reasons for lecture non-attendance in an
Accounting module at the UP included timetable clashes, transportation, and studying for
course work and tests. Lastly, Braak (2015) found that lack of motivation, illness and family
commitments were the top reasons for non-attendance in a Hospitality Management module at
a private college.
International studies
Various international studies also found a significant positive relationship between lecture
attendance and academic performance (Romer 1993; Devadoss and Foltz 1996; Paisey and
Paisey 2004; Massingham and Herrington 2006; Woodfield, Jessop, and McMillan 2006;
Moore 2006). Focusing on studies that examined what drove the students’ decision to attend
lectures, Vidler (1980) tested the correlation between academic curiosity, class attendance and
course performance of undergraduate students. Students who attended classes frequently when
275Swanepoel, Beukes and Yu Investigating factors influencing class attendance and performance
attendance was not mandatory were more academically curious and showed better performance.
Moreover, Romer (1993) found that Economics students’ absenteeism was higher in core
courses where students generally were required to take the course as opposed to elective courses
where there was some choice demonstrating their interest in a course.
Devadoss and Foltz (1996) examined students’ performance in Agricultural Business and
Economics at four American universities. The notable factors affecting class attendance and
academic performance were motivation, prior GPA, self-finance of studies, work hours, nature
of lectures and quality of teaching. Similarly, Friedman, Rodriguez, and McDomb (2001) found
that motivation related to own subject choice had a positive correlation with lecture attendance.
Longhurst (1999) examined 15 reasons for non-attendance at a further education college.
The general finding was the top reasons for absence were illness, medical appointments and
weather conditions. Massingham and Herrington (2006) investigated the reasons behind lecture
non-attendance of a third-year commerce course at Wollongong University, and found that
while there were no health or lifestyle factors impacting attendance, students’ motivation and
attitude towards learning came to the fore as important influencers of attendance. Motivational
factors were cited as perhaps of greater importance for non-compulsory classes than those that
were compulsory. Likewise, Kottasz (2005) found both extrinsic (e.g., importance to get good
grades) and intrinsic (e.g., genuine interest in course content) motivation were both important
reasons for not missing classes, whereas the main reasons for missing classes were illness,
transport problems and class times not always being right.
Dolnicar (2005) distinguished two groups of students at an Australian university: idealists
who were older with work experience and enjoyed lectures, and pragmatists who were younger
and attended lectures to obtain the necessary information. The main reasons of both groups for
attending classes were “find out what I am supposed to learn”, “don’t want to miss important
information” and “find out about assessment tasks”. On the contrary, Moore (2006) found that
whilst most Biology students understood the importance of class attendance to improve their
performance, many believed they should receive credit for attending, and so their attendance
was influenced by such belief. Moore, Armstrong, and Pearson (2008) also found that students
with low motivation level had lower lecture attendance at a university in Ireland.
Wyatt (1992) found that the main factors driving first-year college students’ high
absenteeism included the general dislike of classes, insufficient time spent on studying, high
frequency of alcohol consumption and being female. The latter finding was opposite of
Friedman et al. (2001) who offered no correlation between gender and class attendance
frequency. Woodfield et al. (2006) specifically investigated attendance rates by gender; For
male students, more absences were associated with significantly higher level of extraversion
276Swanepoel, Beukes and Yu Investigating factors influencing class attendance and performance
but lower levels of conscientiousness and verbal/numerical ability; for female students, high
absence frequency was correlated with lower age at entry, lower levels of agreeableness and
conscientiousness.
Course characteristics and lecturer/lecture quality were investigated in some studies.
Romer (1993) found that non-attendance was lower in smaller classes and perception of quality
was important for attendance, while Devadoss and Foltz (1996) noted factors such as the quality
of lecturers, class duration, time of lecture, level of course difficulty and the course having an
attendance requirement all had a significant impact on class attendance. Friedman et al. (2001)
found that small enrolment size and course type were correlated to attendance. Paisey and
Paisey (2004) looked at the class attendance of Financial Accounting students at a Scottish
university, and found that factors such as late afternoon class time and imminent coursework
assignment submission deadlines (along with other factors like financial hardships and work
commitment) were commonly cited as reasons for low attendance.
Lastly, as academics move to more blended learning approaches, Riffell and Sibley (2004)
evaluated whether a hybrid (combination of online and face-to-face contact) introductory
science course at Michigan State University helped boost attendance and hence performance.
The results indicated online assignment completion rate was higher than traditional lecture
attendance rate. Moreover, the hybrid course format was found to be effective in increasing
class attendance, especially the higher-level students compared to first-year freshmen.
METHODOLOGY AND DATA
Theoretical model
The education production function approach, first introduced by Siegfried and Fels (1979), is
employed for this study. A production function measures outcomes based on the respective
inputs. Outcomes vary from measurement of learning, student attitudes, impact of
understanding on behaviour and distribution of benefits. Learning inputs are divided into
various categories: student input, faculty input, college environment and student effort.
We adapt these categories as follows in this study: the outcome variable is examination
mark of first-year Microeconomics (module code: ECO151). We also control for these
important inputs: first, student input variables include demographic characteristics such as age,
gender and population group. Secondly, since ECO151 is a second-semester course (ECO152
Macroeconomics is offered in the first semester), both school attainment characteristics and
ECO152 performance are included as other student input variables. To control for faculty input
and college environment, we include variables such as campus residence status, enrolled degree
277Swanepoel, Beukes and Yu Investigating factors influencing class attendance and performance
programme and duration.
We measure students’ effort with lecture attendance, tutorial attendance and weekly study
hours. Lecture attendance was captured in two ways: self-reported attendance frequency in a
questionnaire and electronically captured attendance with the aid of a student card reader over
a three-week period (eight attendances were captured). Finally, as per our intended contribution
to existing local literature, we include the main causes of low lecture attendance in connection
with academic, institutional and personal reasons.
Empirical model
Since not everyone is eligible to write the final examination, the results derived from the
Ordinary Least Squares (OLS) will be biased due to sample selection problems. Hence, a two-
step Heckman approach is adopted. In the first step, a probit analysis is conducted to identify
factors determining if the students qualified and wrote the final examination, whereas the
second step investigates factors influencing their performance in the examination.
First-year Economics modules at UWC
In 2019, the Department of Economics offered two semesterised first-year modules to full-time
students, namely ECO151 (second semester) and ECO152 (first semester). The ECO151
students were divided into four lecturing groups; in each group, three 1-hour lectures were
taught per week, during the 13-week semester. Whereas all ECO152 students are eligible to
write the final examination, in the case of ECO151, students must obtain a continuous
assessment mark (CAM) of 40 or above to be eligible to write the final examination. In 2019,
the continuous assessment tasks included four tutorials, two modules tests and one online
multiple-choice test, while the final mark was calculated as 0.5 × CAM + 0.5 × exam mark.
Data
In 2019, a total of 952 students enrolled ECO151. The UWC Student Administration System
(SASI) was used to extract information on students’ demographic characteristics, Grade 12
(Matric) subjects and entry points, and campus residence status. Since Matric information was
incomplete in five students on SASI, final sample size was reduced to 947. The UWC entry
points were derived by a weighted system of declining scale to award points for symbol
obtained in each subject, and the maximum attainment total entry points are 65 (for detailed
explanation, see Dos Reis and Yu 2018, 240-241).
Since information on work status, work hours, weekly hours spent on studying the course
materials and reasons for not attending lectures are not available on SASI, we designed a
278Swanepoel, Beukes and Yu Investigating factors influencing class attendance and performance
questionnaire to capture the abovementioned information. Hard copies of the survey were
handed out to students in the final tutorial of the semester to boost response rate, given it was
compulsory for students to submit assignment exercises during the tutorial periods. Out of the
947 students, 672 completed and submitted the survey (the response rate was 71%).
The UWC Marks Administration System (MAS) captures information on students’ marks
in each assessment task, CAM, examination mark and final mark. Lastly, data from the
abovementioned three sources (survey, SASI and MAS) were combined into one overall data
file in Stata format before the empirical findings were derived.
EMPIRICAL FINDINGS
Descriptive statistics
Table 1 shows that the majority of students were aged 19‒20 years at the time of enrolling
ECO151, as they accounted for 60 per cent of the sample. The female share was slightly more
dominant (54%), while the African and Coloured racial shares were the greatest (56% and 39%
respectively). Nearly 52 per cent reported speaking any African language at home whereas 42
per cent spoke English. About 9 per cent of the students claimed they stayed at campus
residence, while 56 per cent enrolled at UWC for the first time in 2019. Lastly, the table
indicates that approximately two-thirds enrolled a 3-year programme; BCom 3-year programme
was most popular (29%), followed by BCom 4-year extended programme (24%).
Table 1: Profile of the ECO151 students (%)
Age
17‒18 years 9.93
19 years 35.27
20 years 25.03
21 years 12.46
22 years or above 17.31
Mean (years) 20.19
Gender
Male 46.15
Female 53.85
Race
African 56.07
Coloured 39.28
Asian/Indian 3.38
White 1.27
Home language
English 42.03
Afrikaans 6.34
279Swanepoel, Beukes and Yu Investigating factors influencing class attendance and performance
Any African language 51.64
Staying at campus residence
Yes 8.76
No 91.24
Programme enrolled
BAdmin 3-year 0.32
BCom 3-year 29.25
BCom Accounting 3-year 13.62
BCom Financial Accounting 3-year 14.26
BCom Law 3-year 6.34
BSc Maths 3-year 0.32
BCom 4-year 24.29
BCom Accounting 4-year 11.62
Years of enrolment at UWC
First year 56.18
Second year 34.32
More than two years 9.50
With regard to the students’ school characteristics, Table 2 shows that more than 60 per cent of
the ECO151 students matriculated in Western Cape schools, while mean entry points was 40.09.
Overall, 82.5 per cent of the students enrolled at least one commerce subject, namely
Accounting (71%), Business Studies (50%) and Economics (30%). Moreover, a very high share
of 94.72 per cent enrolled Mathematics (instead of Mathematical Literacy) in Matric.
Table 2: Matric characteristics of ECO151 students (%)
Province of exam authority
Western Cape 62.62
Eastern Cape 13.62
Gauteng 9.40
Other provinces 13.83
Overseas 0.53
Entry points
Below 35 points 11.19
35‒39 points 29.04
40‒44 points 44.77
45 points or above 14.99
Mean (points) 40.09
Proportion enrolled in each subject
Accounting 71.17
Business Studies 49.84
Economics 29.57
Life Sciences 49.84
Physical Sciences 47.62
Mathematics 94.72
English home language 64.00
280Swanepoel, Beukes and Yu Investigating factors influencing class attendance and performance
Afrikaans home language 8.13
Any African home language 28.19
Table 3 shows that only 5 per cent of the ECO151 students repeated the module in 2019. It was
mentioned in section 3.1 that the attendance of eight lectures in the first three weeks of the
second term was captured by a digital device. A worrying finding is that 37 per cent did not
even attend one lecture, while 46 per cent only attended between one and four lectures. The
mean number of attendance was low at 2.07. In contrast, tutorial attendance was very high, with
two-thirds attending all four tutorials and mean attendance was 3.34. These results are expected,
as it was previously mentioned that students were required to submit assessments during the
tutorial period. Tutorial attendance was thus “compulsory” it gave students some merit to attend
(as also found by Devadoss and Foltz 1996 as well as Moore 2006).
Table 3: Study characteristics and academic performance of ECO151 students (%)
Repeater of ECO151
Yes 5.07
No 94.93
Lecture attendance
None 37.17
Once or twice 24.29
Three to four times 21.64
Five to six times 13.83
Seven times 3.06
Mean (number of attendance) 2.07
Tutorial attendance
None 6.23
Once or twice 9.51
Three times 18.48
Four times 65.79
Mean (number of attendance) 3.34
ECO151 Continuous assessment mark (CAM)
Below 40 marks 11.41
40‒49 marks 10.77
50‒59 marks 28.19
60‒69 marks 27.88
70‒74 marks 10.03
75‒100 marks 11.72
Mean (mark) 57.03
ECO151 Examination mark
Did not write 0.72
Below 40 marks 10.25
40‒49 marks 29.32
50‒59 marks 29.32
281Swanepoel, Beukes and Yu Investigating factors influencing class attendance and performance
60‒69 marks 17.40
70‒74 marks 5.01
75‒100 marks 7.99
Mean (mark) 53.88
ECO151 Final mark
Fail: Did not qualify to write exam 11.40
Fail: Did not write exam 0.63
Fail: Below 50 marks 13.10
Pass: 50‒59 marks 38.12
Pass: 60‒69 marks 22.91
Pass: 70‒74 marks 6.55
Pass: 75‒100 marks 7.29
Mean (mark) 58.05
ECO152 Final mark
Failed: Below 50 marks 16.58
Pass: 50‒59 marks 40.65
Pass: 60‒69 marks 27.24
Pass: 70‒74 marks 8.87
Pass: 75‒100 marks 6.65
Mean (mark) 56.97
Table 4 provides a more detailed breakdown of lecture attendance by showing the number of
students per group attending each lecture in weeks 8 and 9. Class attendance was much lower
in on Mondays 15:30‒16:30, Fridays 10:50‒11:50 and Fridays 12:00‒13:00. We will revert
back to these results later when examining the reasons why students did not attend lectures.
Table 4: Number of students attending each lecturing group in two selected weeks
Tue 08:30‒09:30 Wed 13:10‒14:10 Thu 12:00‒13:00
Group 1 Week 8 110 76 77
Week 9 97 56 91
Mon 10:50‒11:50 Tue 13:10‒14:10 Fri 10:50‒11:50
Group 2 Week 8 134 52 36
Week 9 114 63 46
Mon 09:40‒10:40 Tue 14:20‒15:20 Fri 12:00‒13:00
Group 3 Week 8 95 56 24
Week 9 77 63 27
Mon 15:30‒16:30 Wed 12:00‒13:00 Thu 13:10‒14:10
Group 4 Week 8 44 81 65
Week 9 41 69 60
As shown in Table 3, out of 947 students, 839 (or 88.6%) obtained a CAM of at least 40 marks
and qualified to write the final examination. With regard to the latter, 833 students wrote this
final assessment; the average mark was 53.88 and the majority of them obtained 40‒59 marks
(nearly 60% share). Regarding the final mark, pass rate of the module was 74.87 per cent, with
282Swanepoel, Beukes and Yu Investigating factors influencing class attendance and performance
a mean of 58.05 marks. About 61 per cent obtained 50‒69 marks, while slightly over 7.29 per
cent attained a distinction. The bottom rows show the ECO151 students’ performance in
ECO152 in the first semester; pass rate was 83.42 per cent with a mean final mark of 56.97.
Lastly, although not shown in the table, 70.96 per cent of ECO151 students passed both
ECO151 and ECO152, and the correlation coefficient between ECO151 and ECO152 final
marks was 0.68, i.e., there was a positive and moderately strong relationship between the two
marks.
Table 5 shows key findings from the survey. First, about 15 per cent reported they were
working at the time of the survey (weekly median and mean work hours were 10 and 17
respectively). About two-thirds relied on bursaries or scholarships to pay the study fees, while
nearly 30 per cent relied on family members for financial support to pay the study fees.
Table 5: Key findings from the survey (%)
Work status
Do not work 84.08
Work as UWC tutor 1.64
Work part-time off-campus 12.65
Work full-time off-campus 1.19
Unspecified 0.45
Primary source to pay study fees
Student’s family 29.61
Student himself/herself 3.13
Bursary 63.10
Scholarship 2.38
Unspecified 1.79
Distance between residence and campus
Campus residence 22.17
Private residence close to campus 16.22
Within 5km from campus 5.06
5‒10km from campus 10.57
10‒20km from campus 17.41
20‒30km from campus 14.58
More than 30km from campus 13.99
Transport mode (if not staying on campus residence or
private residence close to campus)
Own car 23.91
Lift club 25.85
Bus 16.91
Mini-bus taxi 17.15
Train / Bicycle / Motorcycle 4.34
Two transport modes 7.97
Three transport modes 1.45
Unspecified 2.42
Ownership of prescribed textbook
Purchased new copy 30.21
Purchased second-hand copy 40.03
Rented a copy 11.46
283Swanepoel, Beukes and Yu Investigating factors influencing class attendance and performance
Used short-loan library copy 3.72
Not at all – relied on PowerPoint slides 13.84
Unspecified 0.74
Weekly study hours
None 1.70
1‒3 hours 39.46
4‒6 hours 37.25
7‒10 hours 15.30
More than 10 hours 6.29
Mean (hours) 5.32
Frequency of not attending lectures
Never 5.80
Rarely 25.00
Sometimes 39.14
Often 23.96
Always 5.65
All the time 0.45
Whilst Table 1 shows only 8.76 per cent (or 83 students) stayed in campus residence using the
information from SASI, Table 5 rather indicates that 22.17 per cent (or 149) of students who
took part in the survey reported they were staying in campus residence at the time of enrolling
ECO151. The discrepancy is expected, as campus residence information was not updated
immediately on SASI when some students were offered places at campus residence later in the
year. Moreover, 16 per cent stayed at private residence close to campus. One worrying finding
is that 28 per cent stayed at least 20km away from campus. For those who did not stay at campus
residence or private residence close to campus, a follow-up question was asked on their
transport mode: only 24 per cent had their own cars, 26 per cent relied on lift clubs, and 34 per
cent travelled with buses or mini-bus taxis. Also, 9 per cent needed two or three transport modes
to go to campus.
About 70 per cent of survey participants purchased either new or second-hand copy of the
prescribed textbook, 11 per cent rented a copy from the Department of Economics (the
department launched a textbook leasing program in 2018 to provide 100 hard copies of the
prescribed textbook for students to rent for study purpose), while it is concerning that 13.84 per
cent claimed they only relied on PowerPoint slides provided by the lecturers to study. About 40
per cent of the survey participants reported spending one to three hours studying the course
materials per week, whereas 37 per cent spent four to six hours. Mean and median hours were
5.32 and 4.00, respectively. Lastly, 39 per cent of survey participants reported they did not
attend lectures sometimes while only 5.8 per cent said they never missed a lecture.
Figure 1 compares our digitally captured and the students’ self-reported answers on lecture
attendance. Mean lecture attendance (5.05) was much higher for those who claimed they never
missed a class. In fact, this mean of 5.05 is statistically significant from the mean of other
284Swanepoel, Beukes and Yu Investigating factors influencing class attendance and performance
categories (at a significance level of 1%). On the other hand, mean tutorial attendance across
these self-reported lecture attendance frequency categories was quite close (ranging between
3.51 and 3.95), and these means are not statistically different from one another.
Figure 1: Mean number of lecture and tutorial attendance, by
self-reported frequency of not attending lecture category
For survey participants who did not claim they never missed a lecture, they were asked to
declare the reasons for not attending classes and were allowed to report more than one reason.
The possible reasons are classified into three broad categories: academic, personal and
institutional. Academic reasons relate to quality of lectures and tutorials, availability of online
learning resources and preference to allocate time on other academic activities; institutional
reasons focus on timetable and venue related issues, while personal reasons include factors such
as work commitment, transportation and health.
Table 6 indicates that for the top five reasons are all academically related: “busy studying
for tests” (37.28%), “lectures are not helpful or stimulating” (28.44%), “need to complete
assignments” (21.96%), “online learning resources on iKamva are sufficient to cope with
studies” (21.01%) and “tutorials are great that can replace lectures” (18.33%). These findings
conform to some empirical studies reviewed earlier (Devadoss and Foltz 1996; Schmulian and
Coetzee 2011; Wadesango and Machingambi 2011).
Table 6: Proportion of students reporting each reason for not attending lectures (%)
Academic reasons
Need to study for tests 37.28
Lectures are not helpful or stimulating 28.44
Need to complete assignments 21.96
Online learning resources on iKamva are sufficient to cope with studies 21.01
285Swanepoel, Beukes and Yu Investigating factors influencing class attendance and performance
Tutorials are great that can replace lectures 18.33
Online learning resources on the internet (e.g, YouTube) are sufficient 9.79
Do not understand the lecturer’s explanation 4.90
Lecture attendance does not count towards CAM 4.90
Lectures are cancelled by the lecturer 3.79
Institutional reasons
Lecture venue is too noisy 7.90
Time clashes with other modules 6.95
Lecture takes place too late in the afternoon 5.37
Lecture takes place too early in the morning 4.58
Lecture venue is full with no spare seats 4.11
Personal reasons
Unreliable mode of transport that was not on time 12.64
Illness 10.90
Laziness 9.79
Need to work 9.64
Do not have money to pay for the transport mode to come to campus 6.64
Simply do not like to attend lectures 5.21
Family commitments 5.06
Prefer to spend the time to socialise with friends 2.53
The fact that “busy studying for tests” was the top reason is not surprising, given the results in
Table 4 suggest that lecture attendance was extremely low on Fridays, while both module tests
took place on a Friday. Hence, it is highly likely some students opted to skip classes to find
more time to study for tests (similar findings were observed by Foltz 1996 as well as Paisey
and Paisey 2004). That nearly 30 per cent of students claimed lectures are not helpful or
stimulating are concerning as this reason relates to lecture and lecturer quality. Looking at the
other popular reasons, some students may struggle with time management as they transitioned
from school to university, thereby not coping with completing assignments on time. That online
resources and tutorials are regarded as substitutes of sit-down lectures mean it is worth
investigating whether blended learning boost or rather discourage lecture attendance (Riffell
and Sibley 2004).
The top institutional reason for not attending lectures was “lecture venue is too noisy”
(7.90%), while the most dominant personal reason was “unreliable mode of transport that was
not on time” (12.64%). The latter result makes sense, as Table 5 shows only a small proportion
of students had their own motor vehicles. This result also helps explain the much lower
attendance on Mondays 15:30‒16:30 (Table 4).
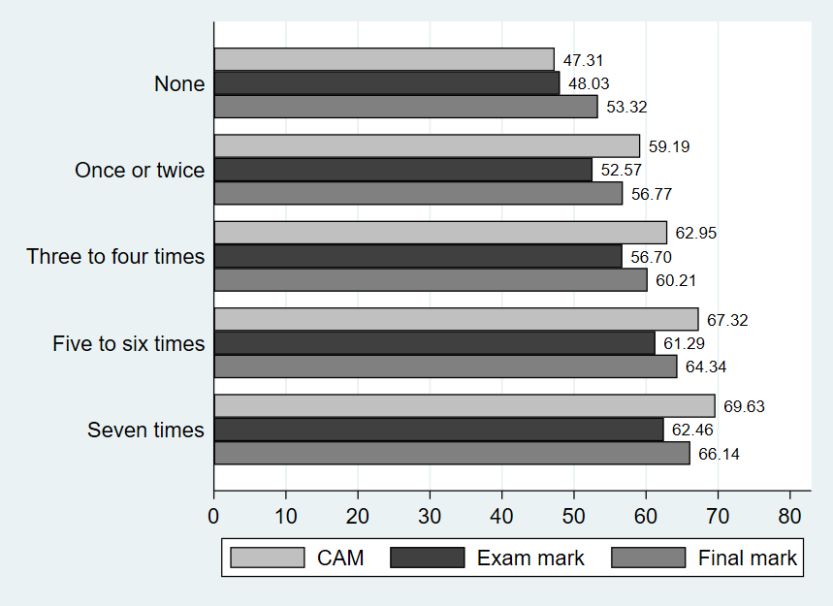
Before proceeding to the econometric analysis, Table 7 and Figure 2 show the mean CAM,
examination and final marks by selected characteristics. Students who enrolled Economics and
Mathematics in Matric and enjoyed higher entry points were associated with significantly better
286Swanepoel, Beukes and Yu Investigating factors influencing class attendance and performance
ECO151 performance. Higher lecture and tutorial attendance and better ECO152 marks were
associated with significantly higher ECO151 examination marks, except that students would
need to attend all four tutorials to enjoy statistically significantly better results. Furthermore,
students who rented the prescribed textbooks performed best on average along with those who
purchased new or second-hand copies, whereas the remaining students who relied on short-loan
library copies (which they were only allowed to use for two hours maximum inside the library)
or PowerPoint slides performed significantly worse.
Table 7: Mean CAM, examination and final marks by selected characteristics
Exam Final
Characteristic Category CAM
mark mark
Enrolled Economics in Matric Yes 60.72 56.58 60.46
No 55.49* 52.66* 56.96*
Enrolled Mathematics in Matric Yes 57.42 54.31 58.42
No 50.09* 45.54* 50.93*
Entry points Below 35 points 49.97 47.01 51.57
35‒39 points 55.38* 51.11* 55.44*
40‒44 points 57.39* 54.87* 58.94*
45 points or above 64.46* 60.88* 64.80*
Tutorial attendance Never, once or twice 27.07 48.33 48.26
Three times 55.48* 48.35 52.59
Four times 64.64* 55.78* 60.27*
ECO152 final mark Failed: Below 50 marks 36.52 40.16 45.97
Pass: 50‒59 marks 54.88* 49.31* 53.60*
Pass: 60‒69 marks 63.83* 57.32* 61.34*
Pass: 70‒74 marks 70.61* 64.32* 67.83*
Pass: 75‒100 marks 75.37* 71.74* 74.43*
Purchased the prescribed textbook Purchased new or second-
63.08 55.56 59.74
hand copy
Rented a copy 63.96 57.69 61.23*
Used short-loan library copy 54.37* 48.73* 52.08*
Not at all 57.27* 49.26* 53.91*
Did not take part in the survey 45.09* 51.04* 55.33*
Busy studying for tests Yes 63.96 54.72 59.72
No 60.26* 53.65 57.48
Lectures are not helpful or stimulating Yes 61.04 53.35 57.50
No 61.88 54.34 58.66
Need to complete assignments Yes 62.33 54.12 58.63
No 61.44 54.03 58.24
Online learning resources on iKamva Yes 62.93 51.88 57.58
are sufficient to cope with studies
No 61.29 54.64 58.53
Tutorials are great that can replace Yes 59.83 47.92 54.39
lectures
No 62.04 55.42* 59.20*
Note: the first category in each characteristic represents the reference category.
* The mean is statistically significant from the reference category at α = 5%.
287Swanepoel, Beukes and Yu Investigating factors influencing class attendance and performance
Note: all three means in the other categories are statistically significant
from the respective means in the reference category
(Lecture attendance frequency: none) at α = 5%.
Figure 2: ECO151 mean CAM, examination mark and final mark by lecture attendance
Lastly, looking at the relationship between the top five reasons of not attending lectures and
ECO151 performance, those who claimed they were busy studying for tests had their CAM 3.7
marks significantly higher, that is, somehow, they enjoyed an “advantage” by skipping lectures
to focus on studying for tests. Those who reported they did not attend lectures because they
were of the opinion that tutorials can replace lectures suffered significantly lower examination
mark (of 7.5 marks) and final mark (of nearly five marks), compared with the reference category
(students who claimed it was not the reason for not attending lectures).
Multivariate analysis
In the final part of the empirical analysis, two-step Heckman regressions are run to explain the
impact of various explanatory variables on examination mark. With regard to the results of the
probit regressions on probability to qualify and write the examination, four explanatory
variables are statistically significant with positive impact: students of the Coloured ethnicity
group, Economics studies in Matric, lecture attendance and tutorial attendance. The findings on
the two attendance variables are the same as the two local studies that also adopted the two-step
Heckman approach (Dlomo et al. 2011; Horn et al. 2011). The positive impact of the Coloured
and Matric dummy variables somehow is opposite of what was found by Horn et al. (2011);
nonetheless, the latter study examined the SU students whose ethnic and school characteristics
were very different from those of the UWC students.
288Swanepoel, Beukes and Yu Investigating factors influencing class attendance and performance
Table 8: Heckman two-step regressions on the ECO151 examination mark
[I] [II] [III]
Examination mark
Dummy: Male -0.9068 -0.5368
Dummy: Coloured 0.2226 0.4482
Dummy: Asian / Indian / White -1.4084 -1.0287
Age in years -3.0810 -3.3305*
Age in years squared 0.0579 0.0642
Dummy: Matric province – other than Western Cape 0.2505 0.2147
Dummy: Matric Economics 0.5092 0.4397
Dummy: Matric Mathematics 4.4396** 4.4074**
Entry points 0.0652 0.1369
Entry points squared 0.0036 0.0026
ECO152 final mark 0.6110*** 0.5943***
Lecture attendance 2.2069*** 1.2222*** 1.0899***
Tutorial attendance 5.5396*** 3.1385*** 3.2585***
Dummy: took part in the survey 0.0878
Dummy: purchased or rented prescribed textbook 1.5601
Dummy: stay at residence on or close to campus 0.1389
Dummy: need two to three transport mode -0.5744
Dummy: tutorials are great and can replace lectures -4.3869***
Lambda 12.3457*** 11.6666*** 11.7978***
Constant 27.5186*** 28.2223 29.5127
Selection equation: qualified and wrote the examination
Dummy: Male -0.1581
Dummy: Coloured 0.5575**
Dummy: Asian / Indian / White 0.0268
Age in years -0.3285
Age in years squared 0.0062
Dummy: Matric province – other than Western Cape 0.3537
Dummy: Matric Economics 0.4352*
Dummy: Matric Mathematics 0.0897
Entry points -0.2928
Entry points squared 0.0037
Lecture attendance 0.2357***
Tutorial attendance 1.0486***
Constant 7.5604
R-squared 0.1450 0.4045 0.4161
Adjusted R-squared 0.1419 0.3943 0.4025
F-statistic 46.87 39.69 30.49
Number of observations 833 833 833
*** Significant 1% ** Significant at 5% * Significant at 10%
Moving on to the Heckman regressions on examination mark, before controlling for differences
in other characteristics, regression [I] shows that both lecture and tutorial attendance are
associated with a significantly positive impact on examination performance. This finding is
once again in line with the earlier conducted local empirical studies (Horn and Jansen 2009;
289Swanepoel, Beukes and Yu Investigating factors influencing class attendance and performance
Dlomo et al. 2011; Horn et al. 2011).
Upon controlling for differences in other characteristics, regression [II] shows that these
two attendance variables remain statistically significant but their respective coefficients have
almost halved. In addition, those with Matric Mathematics obtained 4.4 marks higher than those
with Mathematical Literacy, whereas students who scored one mark higher in the ECO152 final
mark obtained an additional 0.61 marks in ECO151 final examination, ceteris paribus. These
two results are both statistically significant, and are expected, as it was proven in numerous
empirical studies that students with Matric Mathematics and better performance in first-year
Economics also performed better in higher-level Economics modules.
The abovementioned four explanatory variables remain statistically significant with the
same coefficient sign in regression [III], after the explanatory variables in connection with the
survey were added. Two more explanatory variables are also statistically significant in
regression [III], namely age (older students performed worse) and a dummy variable which
indicates the students reported they missed lectures as they believed tutorials could replace
lectures. The latter result conforms to the findings in Table 7 as discussed earlier. In fact, the
coefficient in the regression suggests that students who assumed tutorials can replace lectures
suffered in the examination, as they scored 4.4 marks lower. This finding strongly implies that
lectures and tutorials are not perfect substitutes in terms of students’ learning.
Regression [III] also shows that students living in residence on or close to campus, and
those who purchased or rented the prescribed textbook performed better, while students who
required at least two transport modes to travel to campus performed worse. However, all these
results are statistically insignificant. Finally, in all three regressions, lambda is statistically
significant; that is, sample selection bias exists and it is a correct decision to adopt the Heckman
two-step approach to control for the fact that not all students qualified and wrote the
examination.
CONCLUSION
This is the first South African study that comprehensively investigated the main reasons for
first-year Economics students not attending lectures and the subsequent impact on academic
performance. After examining the personal profile, school characteristics and university
programme characteristics, the study examined the lecture and tutorial attendance of 947
students in the sample who enrolled ECO151 Microeconomics in 2019. It was also found that
lecture attendance was extremely low in the late afternoon 15:30‒16:30 and Friday periods.
The key highlights of the survey (participated by 672 students) were as follows: nearly 40
per cent resided at residence on or close to campus, about 10 per cent used two transport modes
290Swanepoel, Beukes and Yu Investigating factors influencing class attendance and performance
to travel to campus, 14 per cent did not purchase or use the prescribed textbook by merely relied
on PowerPoint slides to study, and only 5.8 per cent self-reported they never missed a lecture.
For the remaining 94.2 per cent survey participants who admitted they missed at least one
lecture, they were asked to declare the main reasons for not attending classes, and the top five
reasons are “busy studying for tests” (37.28%), “lectures are not helpful or stimulating”
(28.44%), “need to complete assignments” (21.96%), “online learning resources on iKamva are
sufficient to cope with studies” (21.01%) and “tutorials are great that can replace lectures”
(18.33%).
The multivariate analysis showed that both lecture attendance and tutorial attendance had
a positive and significant impact on the probability of qualifying to write the final examination
and examination mark. Students with Matric Economics and better ECO152 final mark in the
first semester performed significantly better in ECO151 examination. Lastly, those who
regarded “tutorials were great and could replace lectures” eventually paid a heavy price in the
examination, as they scored more than four marks significantly lower, compared with students
who did not think tutorials and lectures could replace each other. Our analysis here further
supports the previous literature on the importance of lecture attendance for academic results but
go further to investigate why students do no attend lectures in the first place.
RECOMMENDATIONS
With our questionnaire, we attempted to identify some reasons why students are absent from
lectures. First, given the large proportion of students that indicated that “lectures are not helpful
or stimulating” and that “tutorials are replacements for the lectures”, we suggest changes made
to teaching. The combination of these two reasons suggest that students prefer examples like
done in tutorials rather than explanations/summaries of textbooks that form lectures. One option
is to experiment with flipped classroom experiences or case studies in lectures moving away
from the traditional lecture structure. As new technology is available to capture and measure
lecture attendance through card readers, it becomes possible to count lecture attendance as part
of the CAM. However, previous literature that suggest academic curiosity in students is
important and should be interrogated more in future research. This is an aspect we did not
investigate deeply. Our research is limited by the questions asked in the questionnaire and
would require more primary research like interviews with students to determine deeper factors
like academic curiosity.
Students also wrongly believe that online material are replacements for the textbook –
they perform significantly worse. Given the poverty context from which many of our students
come, an expanded textbook renting program should be considered. This can be extended to
291Swanepoel, Beukes and Yu Investigating factors influencing class attendance and performance
other departments as well. In January 2019, the NFSAS scheme changed from a controlled
manner where it paid specifically for textbooks and materials to a cashable allowance (Kharwa
2020). If this is to continue, a rent-a-textbook program is sustainable for students rather than
large payments for the textbooks needed. This further supports our call for more research on
academic curiosity since the problem may not lie with content but student engagement with the
material.
Given our results on low attendance in late afternoons and Fridays, there may be a need
to drastically adjust the timetable and even exclude certain slots from timetable. However, given
the limited slots that are available on the timetable one could further consider spending specific
days (e.g., Mondays to Wednesdays) for first-year teaching to save students’ transportation time
and money for travelling to campus. The university could also consider the expanding of their
bus services to regions further from the direct region of campus. This will also need to be
verified and supported by other Departments and Faculties which limits the opportunity to
adjust in this way.
Our final recommendation relates to the finding that students stated that they missed
lectures as they were busy with assignments or test preparation. This result implies students are
ill-prepared for the shift from high school to university where the workload is much higher. It
could also indicate that students have poor time management skills and do not realise how much
work is needed to pass courses. One way to mitigate these effects is to introduce students to
time management techniques during orientation or to develop a “student-workload model” to
ensure balance between courses and time required of students.
ACKNOWLEDGEMENT
The authors would like to thank postgraduate student Ms Shinice Jackson for the assistance to
capture the primary survey data.
NOTE
1. Ceteris paribus is an economic term meaning all other things being equal.
REFERENCES
Braak, D. 2015. “An exploratory investigation into factors affecting class attendance in a hospitality
management module.” Unpublished study. http://iiespace.iie.ac.za/handle/11622/39. (Accessed
22 May 2019).
Devadoss, S. and J. Foltz. 1996. “Evaluation of factors influencing student class attendance and
performance.” American Journal of Agricultural Economics 78(3): 499–507.
Dlomo, Z., A. Jansen, M. Moses, and D. Yu. 2011. “Investigating the significance of the 2008 Matric
curriculum on first-year economics performance.” South African Journal of Higher Education
25(4): 696–709.
292Swanepoel, Beukes and Yu Investigating factors influencing class attendance and performance
Dolnicar, S. 2005. “Should we still lecture or just post examination questions on the web? The nature of
the shift towards pragmatism in undergraduate lecture attendance.” Quality in Higher Education
11(2): 103–115.
Dos Reis, K. and D. Yu. 2018. “Peer mentoring: Enhancing economics first years’ academic
performance.” South African Journal of Higher Education 32(6): 234–250.
Edwards, L. 2000. “An econometric evaluation of academic development programme in economics.”
South African Journal of Economics 68(3): 456–483.
Friedman, P., F. Rodriguez, and J. McDomb. 2001. “Why students do and do not attend classes: Myths
and realities.” College Teaching 49(4): 124–133.
Horn, P. and A. Jansen. 2009. “Tutorial classes – why bother? An investigation into the impact of
tutorials on the performance of economics students.” South African Journal of Economics 77(1):
179–189.
Horn, P., A. Jansen, and D. Yu. 2011. “Factors explaining the academic success of second-year
economics students: An exploratory analysis.” South African Journal of Economics 79(2): 202–
210.
Jordaan, Y. 2009. “Influencing factors on lecture attendance at a tertiary institution.” South African
Journal of Higher Education 23(1): 98–112.
Kharwa, M. 2020. “Opinion: How NSFAS cash policy closed the book on students and small
businesses.” Fin24.com. https://www.fin24.com/Opinion/opinion-how-nsfas-cash-policy-closed-
the-book-on-students-and-small-businesses-20200313. (Accessed 19 May 2020).
Kottasz, R. 2005. “Reasons for student non-attendance at lectures and tutorials: An analysis.”
Investigations in University Teaching and Learning 2(2): 5–16.
Longhurst, R. J. 1999. “Why aren’t they there? Student absenteeism in a further education college.”
Journal of Further and Higher Education 23(1): 61–80.
Massingham, P. and T. Herrington. 2006. “Does attendance matter? An examination of student
attributes, participation, performance and attendance.” Journal of University Teaching and
Learning Practice 3(2): 83–103.
Moore, R. 2006. “Class attendance: How students’ attitudes about attendance relate to their academic
performance in introductory science classes.” Research and Teaching in Developmental
Education 23(1): 19–33.
Moore, S., C. Armstrong, and J. Pearson, J. 2008. “Lecture absenteeism among students in higher
education: A valuable route to understanding student motivation.” Journal on Higher Education
Policy and Management 30(1): 15–24.
Paisey, C. and N. J. Paisey. 2004. “Student attendance in an accounting module – reasons for non-
attendance and the effect on academic performance at a Scottish University.” Accounting
Education 13(S1): 39–53.
Parker, K. 2006. “The effect of student characteristics on achievement in introductory microeconomics
in South Africa.” South African Journal of Economics 74(1): 137–149.
Riffell, S. K. and D. F. Sibley. 2004. “Can hybrid course formats increase attendance in undergraduate
environmental science courses?” Journal of Natural Resources and Life Sciences Education 33(1):
16–20.
Romer, D. 1993. “Do students go to class? Should they?” Journal of Economic Perspectives 7(3): 167–
174.
Schmulian, A. and S. Coetzee. 2011. “Class absenteeism: Reasons for non-attendance and the effect on
academic performance.” Accountancy Research Journal 24(2): 178–194.
Schreiber, B. and D. Yu. 2016. “Exploring student engagement practices at a South African university:
Student engagement as reliable predictor of academic performance.” South African Journal of
Higher Education 30(5): 157–175.
Siegfried, J. J. and R. Fels. 1979. “Research on teaching college economics: A survey.” Journal of
293Swanepoel, Beukes and Yu Investigating factors influencing class attendance and performance
Economic Literature 17(3): 923–969.
Smith, L. 2009. “An analysis of the impact of pedagogic interventions in first-year academic
development and mainstream courses in microeconomics.” South African Journal of Economics
77(1): 162–178.
Smith, L. and L. Edwards. 2007. “A multivariate evaluation of mainstream and academic development
courses in first-year microeconomics.” South African Journal of Economics 75(1): 99–117.
Van der Merwe, A. 2006. “Identifying some constraints in first year economics teaching and learning at
a typical South African university of technology.” South African Journal of Economics 74(1):
150–159.
Van Walbeek, C. 2004. “Does lecture attendance matter? Some observations from a first-year economics
course at the University of Cape Town.” South African Journal of Economics 72(4): 861–883.
Vidler, D.C. 1980. “Curiosity, academic performance, and class attendance.” Psychology Reports 47(3):
589‒590.
Wadesango, N. and S. Machingambi. 2011. “Causes and structural effects of student absenteeism: A
case study of three South African universities.” Journal of Social Sciences 26(2): 89–97.
Wyatt, G. 1992. “Skipping class: An analysis of absenteeism among first-year college students.”
Teaching Sociology 20(3): 201–207.
Woodfield, R., D. Jessop. and L. McMillan. 2006. “Gender differences in undergraduate attendance
rates.” Studies in Higher Education 31(1): 1–22.
294You can also read