Investigations of Muon Flux Variations Detected Using Veto Detectors of the Digital Gamma-rays Spectrometer
←
→
Page content transcription
If your browser does not render page correctly, please read the page content below
applied
              sciences
Article
Investigations of Muon Flux Variations Detected Using Veto
Detectors of the Digital Gamma-rays Spectrometer
Krzysztof Gorzkiewicz 1, * , Jerzy W. Mietelski 1 , Zbigniew Ustrnul 2 , Piotr Homola 1 , Renata Kierepko 1 ,
Ewa Nalichowska 1 and Kamil Brudecki 1

                                           1   Institute of Nuclear Physics Polish Academy of Sciences, Radzikowskiego 152, 31-342 Krakow, Poland;
                                               jerzy.mietelski@ifj.edu.pl (J.W.M.); piotr.homola@ifj.edu.pl (P.H.); renata.kierepko@ifj.edu.pl (R.K.);
                                               ewa.nalichowska@ifj.edu.pl (E.N.); kamil.brudecki@ifj.edu.pl (K.B.)
                                           2   Department of Climatology, Jagiellonian University in Krakow, Gronostajowa 7, 30-387 Krakow, Poland;
                                               zbigniew.ustrnul@uj.edu.pl
                                           *   Correspondence: krzysztof.gorzkiewicz@ifj.edu.pl

                                           Abstract: This paper presents the results of cosmic ray muons flux monitoring registered by a digital
                                           gamma-ray spectrometer’s active shield made of five large plastic scintillators. In traditional, i.e.,
                                           analogue active shields working in anticoincidence mode with germanium detectors, the generated
                                           data are used only as a gating signal and are not stored. However, thanks to digital acquisition
                                           applied in designed novel gamma-ray spectrometers enabling offline studies, it has not only become
                                           possible to use generated data to reduce the germanium detector background (cosmic rays veto

                                    system) but also to initialize long-term monitoring of the muon flux intensity. Furthermore, various
                                           analyses methods prove the relevance of the acquired data. Fourier analyses revealed the presence of
Citation: Gorzkiewicz, K.; Mietelski,
                                           daily (24 h), near-monthly (27 days) and over bi-monthly (68 days) cycles.
J.W.; Ustrnul, Z.; Homola, P.;
Kierepko, R.; Nalichowska, E.;
Brudecki, K. Investigations of Muon
                                           Keywords: digital gamma-rays spectrometer; cosmic veto; active shield; muons; muon flux periodicity
Flux Variations Detected Using Veto
Detectors of the Digital Gamma-rays
Spectrometer. Appl. Sci. 2021, 11, 7916.
https://doi.org/10.3390/                   1. Introduction
app11177916                                     Low-background gamma-ray spectrometry is commonly used in research studies
                                           of materials characterized by trace concentrations of gamma-ray emitting radioisotopes.
Academic Editors: Roberta Sparvoli         Hence, it finds applications in various fields of science, such as from neutrino physics to
and Matteo Martucci
                                           environmental research [1–3]. In such investigations, it is vital to use advanced shielding
                                           systems to reduce the background radiation of gamma-ray detectors (mainly HPGe).
Received: 20 July 2021
                                                One of the main components of background radiation is terrestrial gamma radiation,
Accepted: 25 August 2021
                                           which spectrometers’ passive shield can efficiently reduce. However, passive shield layers
Published: 27 August 2021
                                           and their width must be appropriately selected in order to minimize the impact of internal
                                           gamma radiation from traces of radionuclides present in the shield’s construction materials
Publisher’s Note: MDPI stays neutral
                                           and any isotopes produced by interactions of cosmic rays with those materials. In low-
with regard to jurisdictional claims in
                                           background detection systems, contributions from air radioactivity, namely radon and its
published maps and institutional affil-
iations.
                                           daughter isotopes, are not negligible [2,4].
                                                Another important source of background radiation in gamma-ray spectrometers are
                                           particles of secondary cosmic rays. At sea level, the secondary particles flux consists of
                                           hadrons, neutrons, gamma quanta, electrons, muons, nucleons and antinucleons [5]. Of
                                           these charged particles, muons are the most abundant, with a mean energy of around
Copyright: © 2021 by the authors.
                                           4 GeV. The intensity of the muon flux depends on the zenith angle θ of the incident particle,
Licensee MDPI, Basel, Switzerland.
                                           which at sea level can be expressed as follows (1):
This article is an open access article
distributed under the terms and
                                                                                    (θ ) = I (0◦ )cosn( p) (θ ),                                         (1)
conditions of the Creative Commons
Attribution (CC BY) license (https://
                                           where n(p) is the particle momentum-dependent exponent and n ≈ 2 for muons with
creativecommons.org/licenses/by/
                                           energies of a few GeV [6]. This relation explains the necessity of shielding gamma-ray
4.0/).

Appl. Sci. 2021, 11, 7916. https://doi.org/10.3390/app11177916                                                 https://www.mdpi.com/journal/applsci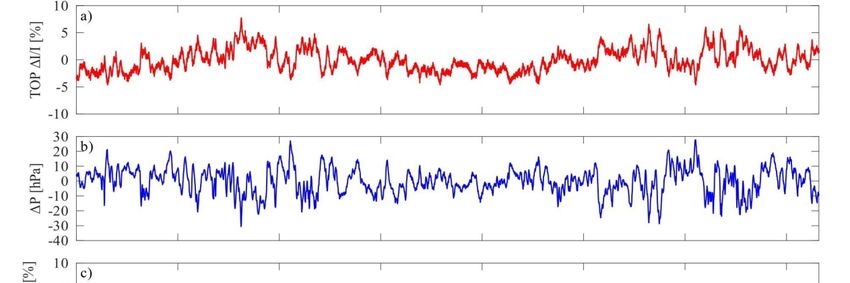
Appl. Sci. 2021, 11, 7916 2 of 10
detectors in both vertical and horizontal directions. The most significant contribution to
the radiation background is from particles with 0◦ zenith angle (vertical direction) [1].
Secondary cosmic rays passing through the shielding may deposit their energy in
the germanium crystal (producing continuous background component) as well as gen-
erate neutrons and photons via several processes such as muon-induced hadronic and
electromagnetic cascades, muon capture and muon-induced spallation reactions [2,7,8].
The cosmic rays background component can be reduced by using active shields
consisting of detectors (plastic scintillators or multiwire Charpak chamber) surrounding a
passive shield. In the case of particle detection (in the preset coincidence time window) by
the active shield’s detector and the germanium detector, the signal from the latter is not
stored. This is the principle of the so-called classical (analogue) cosmic ray veto system.
However, the development of digital signal processing systems allowed one to apply
digital analyzers (digitizers) as critical components of nuclear spectroscopy electronics and
substitute a few discrete electronic devices used in analogue electronics. Such a device
provides information about the registration time, energy and pulse shape of each significant
signal generated by the detector. Furthermore, using digital analyzer allows all generated
data to be stored for later processing (offline), enabling the application of various data
exploration techniques. Since 2018, a low-background, gamma-ray spectrometer with an
active shielding and digital acquisition system has been operating in the Department of
Nuclear Physical Chemistry, at the Institute of Nuclear Physics Polish Academy of Sciences
(IFJ PAN), in Krakow, Poland [1].
In this paper, we present the results of analyses of data generated by the spectrometer’s
active shielding. As mentioned above, these data are used to reduce the germanium detec-
tor background. Furthermore, offline data analysis makes it possible to develop a continu-
ous cosmic-ray muons monitoring system. Hence one device, namely a low-background,
digital gamma-ray spectrometer, can simultaneously performs experiments from two
branches of physics, namely low-background gamma-ray spectrometry and astrophysics.
2. Materials and Methods
The spectrometer is equipped with a Broad Energy Germanium detector BE5030
(Canberra, USA) with relative efficiency of ≥48% and a composite passive shield in a
cubic shape with an internal layer made of lead cast over 2500 years ago. The active
shielding consists of five large, five cm thick plastic scintillation detectors EJ-200 with
photo-multipliers ET 9900 (Scionix, Nl). These detectors are mounted outside the passive
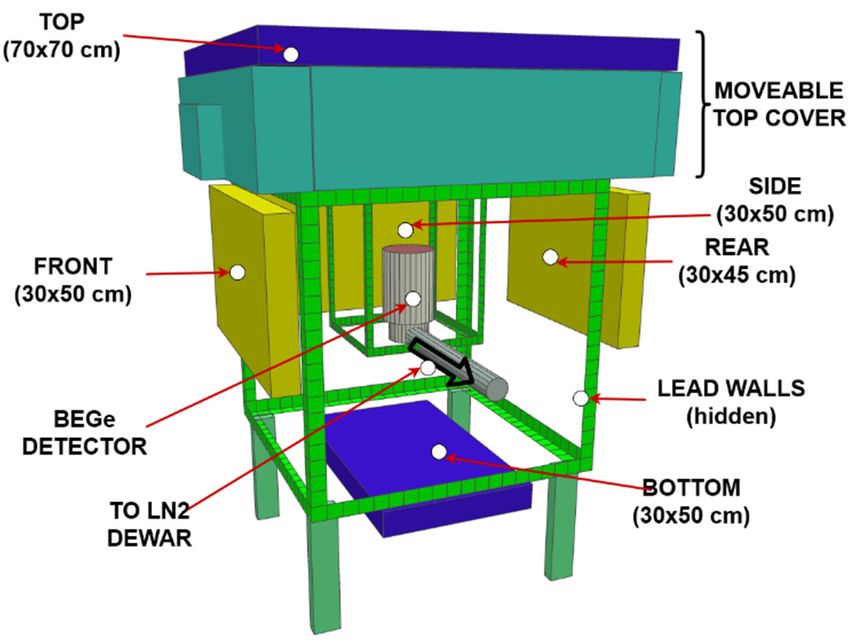
shield. TOP and BOTTOM detectors are placed horizontally while the latter three—FRONT,
SIDE and REAR—are placed vertically. The relative positioning of all spectrometer’s
detectors is depicted in Figure 1. The detectors’ preamplifier signals are transmitted
directly to the inputs of a digitizer DT5725 (CAEN, Italy), where data acquisition and signal
pre-processing are performed.
The digital analyzer DT5725 allows simultaneous acquisition of data generated by
up to eight detectors (at this moment, in our setup six inputs are occupied) with a max-
imum time resolution of 4 ns. Registered data consist of pulse time registration, height
(proportional to deposited particle energy) and shape. Raw data generated by the dig-
itizer are stored in a PC as six files (in *.csv format), which are further processed using
purposely written software VETO. Commissioning and optimization processes of the
described spectrometer and software development and its properties are discussed in
detail in [1].
The data were collected from 1 September 2018 to 30 April 2020. Since the described
spectrometer is primarily used to measure low-active gamma-ray emitting samples, the
obtained data may be divided into two groups, namely short and long-period data. Short
period data consist of data generated by scintillation detectors during single gamma-rays
spectrometric measurement, which last up to 6 days. Data acquisition is stopped at the
end of measurements in order to replace the sample in the spectrometer’s chamber and/or
refill the liquid nitrogen dewar. Such breaks last up to 30 min, after which the subsequent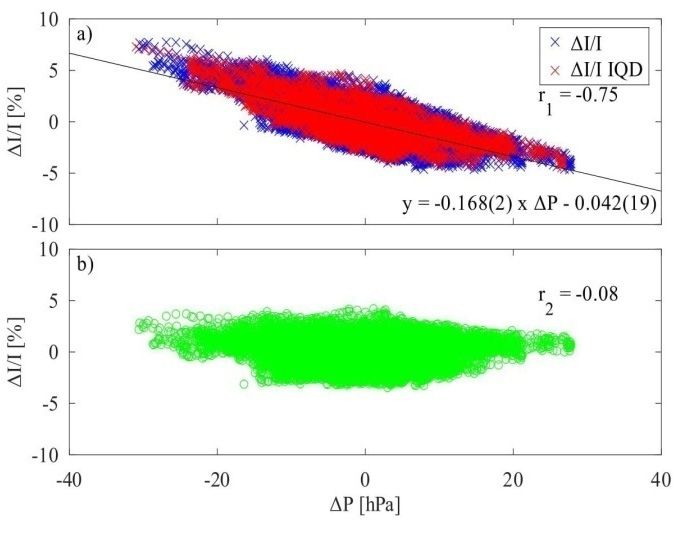
gamma-ray spectrometer, can simultaneously performs experiments from two branches of
                            physics, namely low-background gamma-ray spectrometry and astrophysics.

                            2. Materials and Methods
Appl. Sci. 2021, 11, 7916         The spectrometer is equipped with a Broad Energy Germanium detector BE5030                   3 of 10
                             (Canberra, USA) with relative efficiency of ≥48% and a composite passive shield in a cu-
                             bic shape with an internal layer made of lead cast over 2500 years ago. The active
                             shielding consists of five large, five cm thick plastic scintillation detectors EJ-200 with
                            gamma-ray spectrometric measurement along with registration of cosmic ray particles by
                             photo-multipliers
                            scintillators          ET 9900
                                          is restarted. The(Scionix,   Nl). data
                                                              long-period   These   detectors
                                                                                 consist  of allare mounted
                                                                                                 digitizer     outside
                                                                                                            output files the  passive
                                                                                                                          generated
                             shield.   TOP     and   BOTTOM        detectors    are   placed     horizontally
                            from 1 September 2018 to 30 April 2020. During this time, 256 gamma-spectrometric    while     the  latter
                             three—FRONT,        SIDE  and    REAR—are      placed  vertically.   The  relative  positioning
                            measurements were carried out, and as a result 1280 output files of scintillation detectors         of  all
                             spectrometer’s     detectors  is depicted  in  Figure   1. The  detectors’   preamplifier
                            were generated (total size 270 GB). In this paper, data generated by scintillators TOP        signals  are
                             transmitted and
                            (horizontal)   directly  to the(vertical)
                                                 FRONT       inputs ofwere
                                                                       a digitizer
                                                                             used toDT5725
                                                                                       analyze(CAEN,     Italy), where
                                                                                                 the long-term           data acqui-
                                                                                                                  modulations       of
                             sition and
                            muon flux.   signal  pre-processing    are performed.

                            Figure 1. The relative positioning of the low-background, digital gamma-ray spectrometer’s detectors.
                            In blue—horizontally (TOP and BOTTOM); in yellow—vertically placed scintillators (FRONT, SIDE
                            and REAR). Each of the scintillators is 5 cm thick. The device is in operation at the Institute of Nuclear
                            Physics Polish Academy of Sciences. Some parts of the passive shield (e.g., the lead walls) are hidden.

                                  For this work, the atmospheric pressure data were obtained thanks to the cooperation
                            with the Institute of Meteorology and Water Management National Research Institute. Data
                            are collected at the Meteorological Station located at the Kraków-Balice Airport. The station
                            is located 6 km west of IFJ PAN, and data were recorded hourly with a high accuracy
                            of 0.1 hPa. The measurements contain pressure values at the station level of 237 m asl
                            (above sea level). It is worth mentioning that the pressure values did not differ from the
                            long-term data series. Only a clear diurnal course was found, which exceeded 1 hPa. The
                            lowest pressure values are recorded in the afternoon, while the highest at night and in the
                            morning. These hours coincide with the strongest and weakest convective movements in
                            the atmosphere, respectively.
                                  In the case of analyses of variations of cosmic rays intensity using detectors located at
                            ground level, atmospheric pressure effects must be taken under consideration [9,10]. The
                            influence of atmospheric pressure on the intensity of the cosmic ray flux is defined as the
                            barometric effect, which includes the following components [11]:
                            •    Absorption having a negative impact on the intensity of the muon flux. With increasing
                                 atmospheric pressure (and thus the amount of matter in the air column), the probability
                                 of absorption and scattering of particles is increased;
                            •    Decay also demonstrating the negative effect, including the increase in the number of
                                 muons decays with increasing atmospheric pressure, which is caused by the increase
                                 in the height at which muons are generated;
                            •    Generation defines the positive impact on the muon flux intensity and considers the
                                 increase in the number of pions produced with increasing pressure.
                                 Near the Earth’s surface, the dominant factor is absorption one; considering that air
                            density is usually the highest near the ground, the knowledge of the atmospheric pressure
                            at the level at which the detection is performed is sufficient for determining the value of
                            the barometric effect [12].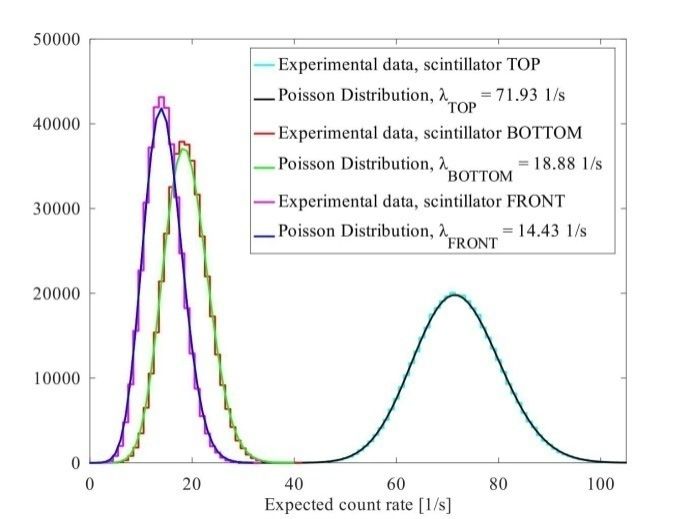
Appl. Sci. 2021, 11, x FOR PEER REVIEW 4 of 11
Appl. Sci. 2021, 11, 7916 4 of 10
The normalized deviation of the recorded muon flux from the average depends on
the change in atmospheric
The normalized pressure
deviation of the[13]:
recorded muon flux from the average depends on the
change in atmospheric pressure [13]: ∆
= ∆ , (2)
∆ ∆I
where is the normalized deviation of muon count rate, Δ is the deviation of the at-
= β P ∆P, (2)
I
mospheric pressure from the mean and βP is the so-called barometric coefficient.
whereThe∆II is the normalized deviation of muon count rate, ∆P is the deviation of the
βP coefficient (expressed in (%/hPa)) can be determined by assuming a linear
correlation
atmosphericbetweenpressurechanges
from theinmeanthe normalized
and βP is themuon fluxbarometric
so-called intensity and variations in
coefficient.
atmospheric pressure. Therefore,
The βP coefficient (expresseditin is (%/hPa))
essential to canestimate the βP value
be determined only during
by assuming the
a linear
most geomagnetically
correlation quiet days
between changes in [14].
the normalized muon flux intensity and variations in
atmospheric
Pressure pressure.
corrected Therefore, it is essential
data are analyzed usingtovarious
estimate the βP value
statistical tools.only during
In order to the
in-
most geomagnetically
vestigate any correlation quietbetween
days [14]. subsequent registered events, the autocorrelation
Pressure
function (ACF)corrected data are
of a sequence of analyzed using between
time intervals various statistical tools. In order
pulses generated to investi-
by detectors is
gate any correlation
determined. between subsequent
The autocorrelation functionregistered
indicates events, the autocorrelation
the Pearson function
correlation coefficient
(ACF) of values
between a sequence of time
of the sameintervals
series asbetween
a functionpulses generated
of time by detectors isFast
lag. Furthermore, determined.
Fourier
The autocorrelation function indicates the Pearson correlation
Transform (FFT) of a given time series is performed, allowing the investigation of coefficient between values
any
of the same series as a function of time lag. Furthermore, Fast Fourier
periodic components. Prior transformation, mean and linear trends have been subtracted Transform (FFT) of
a given time
from the sequence. series is performed, allowing the investigation of any periodic components.
PriorIntransformation, mean anddata,a
the case of long-period linearthreshold
trends have been subtracted
normalization from the
procedure was sequence.
necessary.
In the case of long-period
The spectrometer’s configuration data,
anda threshold
optimization normalization
proceduresprocedure
allow a fixed was threshold
necessary.
The spectrometer’s configuration and optimization procedures
level for the scintillators spectra to 300th ADC channel to be set [1]. This procedure allow a fixed threshold al-
level for the scintillators spectra to 300th ADC channel to be
lowed redundant data (mainly registered gamma rays) which did not increase the set [1]. This procedure allowed
effec-
redundant
tiveness datacosmic
of the (mainly rayregistered
veto system gammato berays) which
reduced updid not increase
to around the However,
24 times effectiveness to
limit the influence of any signal threshold level fluctuations or gain changes into
of the cosmic ray veto system to be reduced up to around 24 times However, thelimit the
digital
influence ofcircuit
acquisition any signal
whichthreshold leveloccurred
may have fluctuations or gain
in data changesover
collected in thea digital acquisition
long period and
circuit which may have occurred in data collected over a long
cause uncontrolled changes in the recorded number of counts, normalization of theperiod and cause uncontrolled
changesdiscrimination
spectra in the recorded number
level of counts,
was carried out normalization of the spectra
[14].The normalization discrimination
procedure involved
level was carried out [14]. The normalization procedure involved
cutting off part of the energetic spectra located below the ADC channel containing cutting off part30%of the
of
energetic spectra located below the ADC channel containing 30% of the maximum number
the maximum number of counts recorded in one channel in a given spectrum (i.e., the
of counts recorded in one channel in a given spectrum (i.e., the highest point in the energy
highest point in the energy spectrum, see Figure 2). The prepared output files were used
spectrum, see Figure 2). The prepared output files were used to determine a time series of
to determine a time series of hourly muon count rates for the whole period considered.
hourly muon count rates for the whole period considered.
2. Scintillator
Figure 2.
Figure Scintillatorenergy
energyspectra discrimination
spectra discrimination procedure
procedureto eliminate fluctuations
to eliminate in the in
fluctuations thresh-
the
old level and
threshold levelsignal gain. The
and signal black
gain. Thecurve
blackiscurve
the scintillation detector detector
is the scintillation spectrumspectrum
with a fixed
with threshold
a fixed
level set tolevel
threshold the 300th
set to ADC channel;
the 300th ADCthe red dashed
channel; the redline represents
dashed 30% of the30%
line represents maximum number of
of the maximum
number of counts registered
counts registered in oneinchannel
in one channel the givenin spectrum.
the given spectrum. The blueline
The blue vertical vertical line indicates
indicates the ADC
the ADC defining
channel channel thedefining the normalized
normalized discrimination
discrimination level. Thelevel.
part ofThe
thepart of the spectrum
spectrum below thisbelow
channelthis
is
channel is not used in further
not used in further analyses. analyses.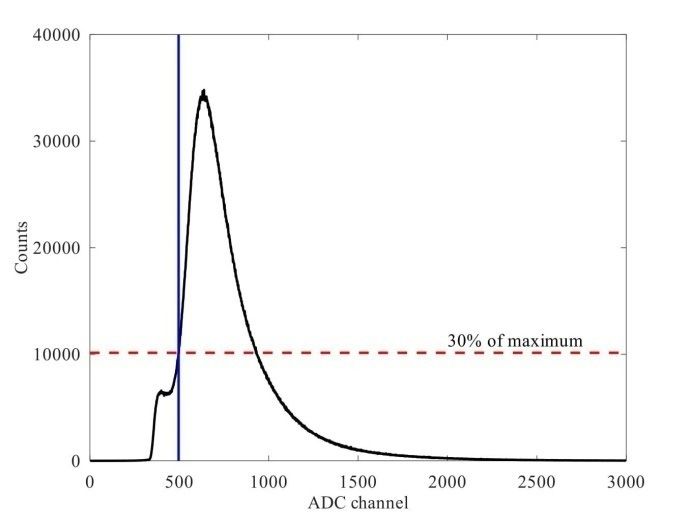
Appl. Sci. 2021, 11, x FOR PEER REVIEW 5 of 11
Appl. Sci. 2021, 11, 7916 5 of 10
3. Results and Discussion
3.1. Short Period Data
3. Results and Discussion
Distributions of pulses generated by the scintillators in unit time t should corre-
3.1. Short
spond Period Data
to Poisson distributions with an expected value equal to λt. This value (for a cho-
sen time interval) depends
Distributions of pulsesmainly on thebyarea
generated the of the detector
scintillators in and
unit its
timevertical
t shouldor horizontal
correspond
position.
to Poisson Figure 3 presentswith
distributions distributions
an expectedof the numbers
value equaloftocounts
λt. Thisregistered
value (forin one sec-
a chosen
ond
timebyinterval)
the scintillation
dependsdetectors
mainly on TOP,
theBOTTOM
area of theand FRONT.
detector andInits
order to obtain
vertical exper-
or horizontal
imental
position.data (the 3cyan,
Figure red and
presents pink linesofin
distributions Figure
the numbers3), Poisson
of counts distributions
registered inwere fitted
one second
with expected
by the countdetectors
scintillation rates λTOPTOP,
= 71.93 counts/s
BOTTOM and(black),
FRONT. λBOTTOM
In order= 18.88 counts/s
to obtain (green)
experimental
and λFRONT
data (the =cyan,
14.43red
counts/s (blue)lines
and pink for TOP, BOTTOM
in Figure and FRONT
3), Poisson detectors,
distributions wererespectively.
fitted with
The horizontal
expected count detectors
rates λTOPregistered more particles
= 71.93 counts/s inλunit
(black), time=than
BOTTOM 18.88the FRONT(green)
counts/s detector,and
which
λFRONT was = 14.43
placedcounts/s (blue)
vertically. for TOP, BOTTOM
Additionally, Figure 3and FRONT detectors,
demonstrates respectively.
a great amount The
of data
horizontalbydetectors
registered a digitalregistered
gamma-ray more particles insystem
spectrometry unit time
andthan the FRONT
supports detector,
the demand forwhich
the
was placed vertically.
optimization process. Additionally,
Such factsareFigure 3 demonstrates
in accordance with aprevious
great amount of data
research registered
results de-
by a digital gamma-ray spectrometry system and supports the demand for
scribed in [1]. Further data analyses involved the verification of the presence of correlated the optimization
process. Such
structures factsare in
in detector accordance
signals. with previousmeasurement
The gamma-ray research results described inlasted
investigation [1]. Further
ap-
data analyses
proximately 119involved
h. the verification of the presence of correlated structures in detector
signals. The gamma-ray measurement investigation lasted approximately 119 h.
Figure Expectedcount
Figure3.3.Expected count rate
rate distributions
distributionsfor
forscintillation
scintillationdetectors:
detectors:TOP
TOP(71.93 counts/s),
(71.93 BOTTOM
counts/s), BOT-
TOM (18.88
(18.88 counts/s)
counts/s) andand FRONT
FRONT (14.43
(14.43 counts/s).
counts/s).
Figure4a
Figure 4apresents
presents values of
ofthe
theACF
ACFinin thethe
examined
examinedseries in cases
series of upoftoup
in cases tentoevents
ten
lag and
events lagfrom
and 10–1000 eventsevents
from 10–1000 lags. The
lags.ACF
The values oscillate
ACF values around
oscillate zero, indicating
around zero, indicat-that
there were no correlations in this signal. This means that practically every registered
ing that there were no correlations in this signal. This means that practically every regis- muon
can be
tered considered
muon can beasconsidered
a single independent
as a singleevent. The sameevent.
independent resultsThe
were achieved
same resultsforwere
other
scintillators, implying that singular scintillators detect non-correlated cosmic-ray
achieved for other scintillators, implying that singular scintillators detect non-correlated muons.
Additionally,
cosmic-ray conducted
muons. analysesconducted
Additionally, proved that signals proved
analyses generated bysignals
that scintillation detectors
generated by
are stochastic
scintillation Poisson
detectors processes
are stochastic[15].
Poisson processes [15].
Figure 4b shows the obtained results from FFT analysis of the sequence of counts
registered in one second by the TOP detector. A flat frequency spectrum (and, consequently,
flat power spectrum) proves that data generated by the individual scintillation detectors
during single gamma-ray spectrometric measurement correspond to white noise, and it
is impossible to detect, using single scintillators, correlated muons created in the same
air-shower event. This is because the time resolution of an active shield scintillator is mainly
determined by two signal shaping parameters: the rise time of the trapezoid generated
by the digitizer’s energy filter and the length of its flat part [1]. Since the main purpose
of the constructed active shield, muon detection, requires correct evaluation of the pulse
height, the total shaping time is around 12 µs, much longer than the intervals between any
possible registered cosmic-ray particles generated in the same air-showers.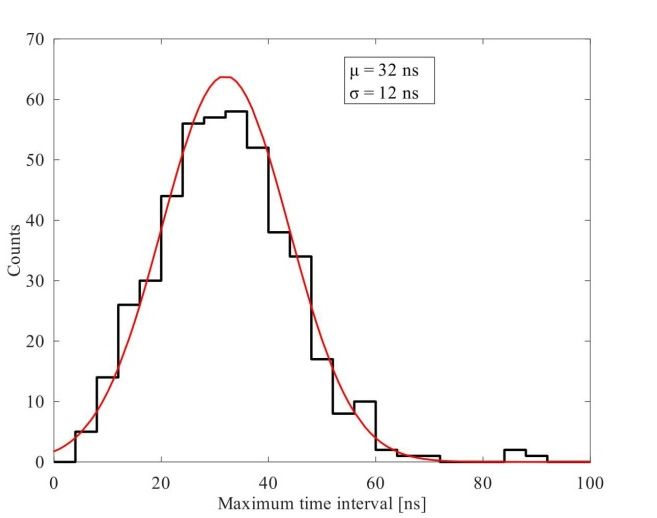
Appl.
Appl. Sci. 2021, 11,
Sci. 2021, 11, 7916
x FOR PEER REVIEW 66 of
of 10
10
Figure 4. (a) Autocorrelation function of time intervals between events registered at the TOP scintillator. As shown, there
is no correlation in the examined
Figureseries. (b) Discrete Fourier
4. (a) Autocorrelation transform
function of timeanalysis ofbetween
intervals the sequence ofregistered
events counts registered by scin-
at the TOP
detector TOP in 1 s. No significant
tillator. periodicities were is
As shown, there found. Similar results
no correlation in thewere obtained
examined for other
series. detectors:
(b) Discrete BOTTOM,
Fourier transform
FRONT, REAR and SIDE. analysis of the sequence of counts registered by detector TOP in 1 s. No significant periodicities
were found. Similar results were obtained for other detectors: BOTTOM, FRONT, REAR and SIDE.
Bearing in mind the previous results, coincidence events of signals from different scin-
tillators have
Figure 4bbeen
showsstudied. Coincidence
the obtained events
results from FFT from four scintillation
analysis of the sequencedetectors, namely
of counts regis-
TOP, BOTTOM,
tered in one second FRONT
by theandTOP REAR, wereAfound
detector. using the
flat frequency VETO software.
spectrum The detection
(and, consequently, flat
systemspectrum)
power registeredproves
471 events of four-fold
that data generatedcoincidences during
by the individual the investigated
scintillation detectorsgamma-
during
spectrometric
single gamma-ray measurement.
spectrometric Figure 5 presentscorrespond
measurement the distribution
to whiteof noise,
the coincidence events
and it is impossi-
found as a function of the maximum time interval between pulses
ble to detect, using single scintillators, correlated muons created in the same air-showerfrom the same event.
Due to the non-linear geometric positioning of the considered scintillators,
event. This is because the time resolution of an active shield scintillator is mainly determined generated
signals
by must shaping
two signal come from at least two
parameters: correlated
the rise time of themuons from the
trapezoid same air-shower.
generated Fur-
by the digitizer’s
thermore, the width of the distribution (σ = 12 ns) is comparable with the
energy filter and the length of its flat part [1]. Since the main purpose of the constructed ac- digitizer time
resolution,
tive and correlated
shield, muon detection,muons
requirestime travel
correct throughofthe
evaluation thedistance between
pulse height, scintillators.
the total shaping
This feature is interesting from the novel CREDO project point of
time is around 12 µs, much longer than the intervals between any possible registered view [16], which focuses
cos-
on studying cosmic rays and cosmic-ray
mic-ray particles generated in the same air-showers. ensembles. The presented detection system in-
cludes five plastic scintillators, which may play the role of a reference detector, that are
Bearing in mind the previous results, coincidence events of signals from different scin-
complementary to other detection systems (e.g., smartphones’ cameras) already applied in
tillators have been studied. Coincidence events from four scintillation detectors, namely
the CREDO project [16].
TOP, BOTTOM, FRONT and REAR, were found using the VETO software. The detection
system registered
3.2. Long-Period 471 events of four-fold coincidences during the investigated gam-
Data
ma-spectrometric measurement. Figure 5 presents the distribution of the coincidence events
For long-period data, the barometric coefficient βP was established. During investi-
found as a function of the maximum time interval between pulses from the same event. Due
gations, only data collected on the ten most quiet days of every month were used. The
to the non-linear geometric positioning of the considered scintillators, generated signals must
list of those days was acquired from the International Quiet Days (IQD) database (http:
come from at least two correlated muons from the same air-shower. Furthermore, the width
//wdc.kugi.kyoto-u.ac.jp/qddays/ accessed on 14 February 2021) [17]. Figure 6a presents
of the distribution (σ = 12 ns) is comparable with the digitizer time resolution,and correlated
relative deviation of the muon count rate ∆I I as a function of pressure deviation ∆P. The
muons time travel through the distance between scintillators. This feature is interesting from
blue markers represent all data from the period studied, while the red markers represent
the novel CREDO project point of view [16], which focuses on studying cosmic rays and
data recorded only on IQD days. The correlation coefficient between these values and the
cosmic-ray ensembles.
pressure changes Thestrong
indicates presented detection
negative system
correlation includes
(r1,TOP = −five
0.75).plastic
The β Pscintillators,
coefficient
which may play the role of a reference detector, that are
was determined by a least squares fit, and its value was βP,TOP = −0.168(2)complementary to other detection
%/hPa. The
systems (e.g., smartphones’ cameras) already applied in the CREDO project
value was used to correct the data and to eliminate the dependence of the muon flux inten- [16].
sity on the atmospheric pressure using the Equation (2). The obtained results are presented
in Figure 6b. The value of the correlation coefficient after data correction r2,TOP = −0.08
confirms a significant reduction in this dependence. In the case of the FRONT detector,
analyses were performed to allow an estimate of β P,FRONT = −0.153(2) %/hPa, which
reduced the data correlation from r1,FRONT = −0.72 to r2,FRONT = 0.09.Appl. Sci. 2021, 11, x FOR PEER REVIEW 7 of 11
Figure 5. Distribution of 471 coincidence events registered by TOP, BOTTOM, FRONT and REAR
Appl. Sci. 2021, 11, 7916 which may play the role of a reference detector, that are complementary to other detection
detectors. To obtain the data, a Gaussian distribution has been fitted (µ = 32 ns; σ = 12 ns).
7 of 10
systems (e.g., smartphones’ cameras) already applied in the CREDO project [16].
3.2. Long-Period Data
For long-period data, the barometric coefficient βP was established. During investi-
gations, only data collected on the ten most quiet days of every month were used. The list
of those days was acquired from the International Quiet Days (IQD) database
(http://wdc.kugi.kyoto-u.ac.jp/qddays/ accessed on 14 February 2021) [17]. Figure 6a
∆
presents relative deviation of the muon count rate as a function of pressure deviation
∆P. The blue markers represent all data from the period studied, while the red markers
represent data recorded only on IQD days. The correlation coefficient between these
values and the pressure changes indicates strong negative correlation ( , = −0.75).
The coefficient was determined by a least squares fit, and its value was βP,TOP =
-0.168(2) %/hPa. The value was used to correct the data and to eliminate the dependence
of the muon flux intensity on the atmospheric pressure using the Equation (2). The ob-
tained results are presented in Figure 6b. The value of the correlation coefficient after data
correction , = −0.08 confirms a significant reduction in this dependence. In the case
Figure 5.FRONT
of the 5.
Figure Distribution of
of 471
detector,
Distribution coincidence
471analyses events
were
coincidence registered
performed
events registeredtoby TOP,
byallow BOTTOM,
an estimate
TOP, BOTTOM, FRONT
FRONT and REAR
of and REAR
=
,
detectors. To obtain the data, a Gaussian distribution has been fitted (µ = 32 ns; σ = 12 ns).
−0.153(2) %/hPa, which reduced the data correlation from r1,FRONT = -0.72 to r2,FRONT = 0.09.
detectors. To obtain the data, a Gaussian distribution has been fitted (µ = 32 ns; σ = 12 ns).
3.2. Long-Period Data
For long-period data, the barometric coefficient βP was established. During investi-
gations, only data collected on the ten most quiet days of every month were used. The list
of those days was acquired from the International Quiet Days (IQD) database
(http://wdc.kugi.kyoto-u.ac.jp/qddays/ accessed on 14 February 2021) [17]. Figure 6a
∆
presents relative deviation of the muon count rate as a function of pressure deviation
∆P. The blue markers represent all data from the period studied, while the red markers
represent data recorded only on IQD days. The correlation coefficient between these
values and the pressure changes indicates strong negative correlation ( , = −0.75).
The coefficient was determined by a least squares fit, and its value was βP,TOP =
-0.168(2) %/hPa. The value was used to correct the data and to eliminate the dependence
of the muon flux intensity on the atmospheric pressure using the Equation (2). The ob-
tained results are presented in Figure 6b. The value of the correlation coefficient after data
correction , = −0.08 confirms a significant reduction in this dependence. In the case
of the FRONT detector, analyses were performed to allow an estimate of , =
−0.153(2) %/hPa, which reduced the data correlation from r1,FRONT = -0.72 to r2,FRONT = 0.09.
Figure 6. Determination of the barometric coefficient for the data recorded by the TOP detector.
(a) Relative deviation of muon count rate as a function of pressure deviation for all data (blue
markers) and for International Quiet Days (IQD) data—red markers. The correlation coefficient
between the IQD data and the pressure variations was r1 = −0.75. Obtained barometric coefficient
βP = −0.168 %/hPa. (b) Pressure corrected data; correlation coefficient reduced to r2 = −0.08.
Figure 7a shows the normalized intensity of the muon flux registered by the detec-
tor TOP before correction for changes in atmospheric pressure (which are depicted in
Figure 7b). The pressure corrected data demonstrated in Figure 7c,d for scintillator TOP
and FRONT, respectively, show less variability. It should be noted that seasonal variation is
still clearly visible; however, seasonal changes do not affect the final results for the analyzed
period (20 months).IQD data and the pressure variations was = −0.75. Obtained barometric coefficient βP = −0.168
TOP%/hPa.
before(b)correction for changes
Pressure corrected in atmospheric
data; correlation coefficient pressure = −0.08.
reduced to (which are depicted in Figure
7b). The pressure corrected data demonstrated in Figure 7c and 7d for scintillator TOP
and FRONT, Figurerespectively,
7a shows the normalized intensity of the
show less variability. muon flux
It should registered
be noted thatby the detector
seasonal variation
TOP before correction for changes in atmospheric pressure (which are depicted in Figure
is still clearly visible; however, seasonal changes do not affect the final results for the an-
Appl. Sci. 2021, 11, 7916 7b). The pressure corrected data demonstrated in Figure 7c and 7d for scintillator TOP 8 of 10
alyzed period (20 months).
and FRONT, respectively, show less variability. It should be noted that seasonal variation
is still clearly visible; however, seasonal changes do not affect the final results for the an-
alyzed period (20 months).
Figure Figure 7. (a) Normalized
7. (a) Normalized changes
changes in the
in the muon muon fluxintensity
flux intensityrecorded
recorded by
by the
theTOP
TOPdetector
detector before correcting
before for atmos-
correcting for atmos-
Figure 7. (a) pressure,
Normalized changesininatmospheric
the muon flux intensity recordedmuon
by the TOP detector before correcting for atmospheric
pheric pheric (b) changes
pressure, (b) changes in atmospheric pressure,pressure, (c)(c)corrected
corrected muon flux
fluxintensity IcorrIcorr
intensity registered by scintillator
registered TOP TOP
by scintillator
pressure,
and(b)
(d) changes
correctedin atmospheric
muon pressure,
flux intensity (c) corrected
Icorr registered muon flux
by scintillator intensity Icorr registered by scintillator TOP and (d)
FRONT.
and (d) corrected muon flux intensity Icorr registered by scintillator FRONT.
corrected muon flux intensity Icorr registered by scintillator FRONT.
Fast Fourier transform analysis was conducted on the pressure-corrected data, and
Fast
the Fourier
obtained transform
results analysis
are presented was conducted
in Figure 8. on the pressure-corrected data, and
Fast Fourier transform analysis was conducted on the pressure-corrected data, and
the
theobtained
obtainedresults
resultsare
arepresented
presented in
in Figure
Figure 8.
8.
Figure 8. Discrete Fourier analysis of long-term muon intensity registered by scintillation detector TOP (a) and FRONT (b).
Periodicities in time series 24 h (along with harmonics 12 h and 8 h), 27 d and 68 d have been found.
In the case of the TOP detector, the FFT algorithm allowed identification of the diurnal
periodicity (24 h) with harmonics components (12 h and 8 h) of muon flux caused by the
rotation of the Earth and its relative motion in the solar magnetic field, modulated by
solar wind [18,19]. Furthermore, a periodic component with a period of around 27 days
was identified. This variability is associated with the effect of the Sun’s rotation, causing
variations in both intensity of solar wind particles and their speed [18,20]. In addition,
a periodicity of about 68 days is noticeable in the frequency spectrum but its origin is
unclear. Takai et al. (2016) [21] conducted a frequency analysis of the eight-year time
series of muon flux recorded during the MARIACHI experiment. The authors identified
a signal component, among others, with a period of about 62.5 days (which is the closestAppl. Sci. 2021, 11, 7916 9 of 10
to the result obtained in presented research), but unfortunately its interpretation was not
provided. Hence the 68day periodicity needs to be further analyzed.
The results of the FFT analyses of the signal generated by detector FRONT (Figure 8b)
confirmed diurnal (with 12 h harmonics). In addition, there are 27 and 68 days periodicities
in the horizontal component of cosmic ray flux registered by the vertical scintillator.
4. Conclusions
This paper presents the capabilities of a low-background digital gamma-ray spec-
trometer which expand its fields of applications and the analysis techniques to correct and
extract information of the data generated by an active shield detector. Usually, such data
are used only to reduce the germanium detector radiation background; thus, it is not saved
or analyzed. Our approach, involving digital data acquisition and offline analysis, allows
both tasks to be fulfilled simultaneously.
In the case of short period time series (i.e., data generated by a single scintillator during
a single gamma-spectrometric measurement), research studies indicated that, according to
expectations, the number of pulses generated by scintillators in unit time (in our case, 1 s)
follows a Poisson distribution, and the time intervals between the pulses are not correlated.
Moreover, by using the fast Fourier transform, the absence of periodic structures in these
series was demonstrated.
Relatively long period data were defined as the hourly mean count rates of the regis-
tered cosmic rays. Investigations demonstrated strong negative correlations between the
recorded muon flux and atmospheric pressure at ground level. The estimated barometric
coefficients allowed data generated by detectors TOP and FRONT to be corrected for
pressure. These corrected data were used in the analysis by using the FFT technique, and
periodic components have been identified in both time series, including those related to
the rotation of the Earth (with a period of 24 h) and the rotation of the Sun (a period of
about 27 days). The periodicity with a 68 days period remains unexplained.
To summarize, by using a digital data acquisition system, it is possible to expand the
research potential of the low-background gamma-ray spectrometer by numerous methods
to explore collected measurement data and to allow monitoring of cosmic-ray muons flux
registered by the active shield’s detectors. Moreover, this device may find applications
in the CREDO scientific project and other investigations focused on various phenomena
correlated with the intensity of muon flux (e.g., earthquakes [22]).
Author Contributions: Conceptualization, J.W.M. and K.G.; methodology, K.G., J.W.M. and P.H.;
software, K.G.; validation, K.G., J.W.M., Z.U., R.K. and P.H.; formal analysis, K.G.; investigation, K.G.,
J.W.M., R.K. and Z.U.; data curation, K.G. and Z.U.; writing—original draft preparation, K.G., J.W.M.
and R.K.; writing—review and editing, K.G., J.W.M., R.K., Z.U., P.H., E.N. and K.B.; visualization,
K.G., E.N. and K.B. All authors have read and agreed to the published version of the manuscript.
Funding: This research received no external funding.
Institutional Review Board Statement: Not applicable.
Informed Consent Statement: Not applicable.
Data Availability Statement: Not applicable.
Conflicts of Interest: The authors declare no conflict of interest.
References
1. Gorzkiewicz, K.; Mietelski, J.W.; Kierepko, R.; Brudecki, K. Low-background, digital gamma-ray spectrometer with BEGe detector
and active shield: Commissioning, optimisation and software development. J. Radioanal. Nucl. Chem. 2019, 322, 1311–1321.
[CrossRef]
2. Wen, X.; Zhou, F.; Fukuwa, N.; Zhu, H. A simplified method for impedance and foundation input motion of a foundation
supported by pile groups and its application. Comput. Geotech. 2015, 69, 301–319. [CrossRef]
3. Gilmore, G.; Hemingway, J.D. Practical Gamma-ray Spectrometry; Wiley: Chichester, UK, 1995.
4. Núñez-Lagos, R.; Virto, A. Shielding and background reduction. Appl. Radiat. Isot. 1996, 47, 1011–1021. [CrossRef]Appl. Sci. 2021, 11, 7916 10 of 10
5. Griender, P.K.F. Cosmic Rays at Earth: Researcher’s Reference Manual and Data Book, 1st ed.; Elsevier Science B.V.: Amsterdam,
The Netherlands, 2001; ISBN 0444507108.
6. Cecchini, S.; Spurio, M. Atmospheric muons: Experimental aspects. Geosci. Instrum. Methods Data Syst. 2012, 1, 185–196.
[CrossRef]
7. Jovančević, N.; Krmar, M.; Mrda, D.; Slivka, J.; Bikit, I. Neutron induced background gamma activity in low-level Ge-spectroscopy
systems. Nucl. Instrum. Methods Phys. Res. Sect. A Accel. Spectrom. Detect. Assoc. Equip. 2010, 612, 303–308. [CrossRef]
8. Kudryavtsev, V.A.; Spooner, N.J.C.; McMillan, J.E. Simulations of muon-induced neutron flux at large depths underground.
Nucl. Instrum. Methods Phys. Res. Sect. A Accel. Spectrom. Detect. Assoc. Equip. 2003, 505, 688–698. [CrossRef]
9. Savic, M.; Dragic, A.; Veselinovic, N.; Udovicic, V.; Banjanac, R.; Jokovic, D.; Maletic, D. Effect of pressure and temperature
corrections on muon flux variability at ground level and underground. arXiv 2016, arXiv:1701.00164.
10. Maghrabi, A.; Almutayri, M. Atmospheric Effect on Cosmic Ray Muons at High Cut-Off Rigidity Station. Adv. Astron. 2016, 2016,
1–9. [CrossRef]
11. Dorman, L.I. Cosmic Rays in the Earth’s Atmosphere and Underground. 2004. Available online: https://link.springer.com/
book/10.1007/978-1-4020-2113-8?page=1#toc (accessed on 24 August 2021). [CrossRef]
12. Dayananda, M.A. Correlation Studies of Cosmic Ray Flux and Atmospheric and Space Weather. Ph.D. Thesis, Georgia State
University, Atlanta, GA, USA, 2013.
13. De Mendonça, R.R.S.; Raulin, J.-P.; Echer, E.; Makhmutov, V.; Fernandez, G. Analysis of atmospheric pressure and temperature
effects on cosmic ray measurements. J. Geophys. Res. Space Phys. 2013, 118, 1403–1409. [CrossRef]
14. Savić, M.; Maletic, D.; Joković, D.; Veselinović, N.; Banjanac, R.; Udovičić, V.; Dragic, A. Pressure and temperature effect
corrections of atmospheric muon data in the Belgrade cosmic-ray station. J. Phys. Conf. Ser. 2015, 632. [CrossRef]
15. Ross, S.M. Introduction to Probability Models, 10th ed.; 2010; ISBN 978-0-12-375686-2. Available online: http://fac.ksu.edu.sa/sites/
default/files/book_solution.pdf (accessed on 24 August 2021).
16. Homola, P.; Beznosko, D.; Bhatta, G.; Bibrzycki, Ł.; Borczyńska, M.; Bratek, Ł.; Budnev, N.; Burakowski, D.; Alvarez-Castillo, D.E.;
Almeida Cheminant, K.; et al. Cosmic-Ray Extremely Distributed Observatory. Symmetry 2020, 12, 1835. [CrossRef]
17. International Q-Days and D-Days. Available online: http://wdc.kugi.kyoto-u.ac.jp/qddays/ (accessed on 14 February 2021).
18. Kudela, K.; Langer, R. On quasi-periodic variations of low-energy cosmic rays observed near earth. Radiat. Prot. Dosim. 2015, 164,
471–476. [CrossRef] [PubMed]
19. Arunbabu, K.P.; Ahmad, S.; Chandra, A.; Gupta, S.K.; Dugad, S.R.; Hariharan, B.; Hayashi, Y.; Jagadeesan, P.; Jain, A.; Jhansi, V.B.;
et al. Atmospheric temperature dependence of muon intensity measured by the GRAPES-3 experiment. In Proceedings of the
35th International Cosmic Ray Conference—ICRC2017, Busan, Korea, 12–20 July 2017.
20. Modzelewska, R.; Alania, M. Dependence of the 27-day variation of cosmic rays on the global magnetic field of the Sun. Adv.
Space Res. 2012, 50, 716–724. [CrossRef]
21. Takai, H.; Feldman, C.; Minelli, M.; Sundermier, J.; Winters, G.; Russ, M.K.; Dodaro, J.; Varshney, A.; McIlwaine, C.J.; Tomaszewski,
T.; et al. Tidal Frequencies in the Time Series Measurements of Atmospheric Muon Flux from Cosmic Rays. arXiv 2016,
arXiv:1610.05983.
22. Kovalyov, M.; Kovalyov, S. On the relationship between cosmic rays, solar activity and powerful earthquakes. arXiv 2014,
arXiv:1403.5728.You can also read