Investor Presentation - September 2021 - Solaris Oilfield ...
←
→
Page content transcription
If your browser does not render page correctly, please read the page content below
Investor Presentation
September 2021
Disclaimer
Forward-Looking Statements

The information in this presentation includes “forward-looking statements.” All statements, other than statements of historical fact included in this presentation, regarding our management,
strategy, future operations, financial position, estimated revenues and losses, projected costs, prospects, plans and objectives of management are forward-looking statements. When used in this
presentation, the words “could,” “believe,” “anticipate,” “intend,” “estimate,” “expect,” “project” and similar expressions are intended to identify forward-looking statements, although not all
forward-looking statements contain such identifying words. These forward-looking statements are based on Solaris’ current expectations and assumptions about future events and are based on
currently available information as to the outcome and timing of future events. When considering forward-looking statements, you should keep in mind the risk factors and other cautionary
statements described under the heading “Risk Factors” included in Solaris’ Annual Report on Form 10-K filed with the Securities and Exchange Commission on February 23, 2021 and
subsequent Quarterly Reports, including the Form 10-Q filed with the Securities and Exchange Commission on August 5, 2021. We caution you that these forward-looking statements are
subject to all the risks and uncertainties, most of which are difficult to predict and many of which are beyond our control, incident to the transportation, storage and delivery of proppant. These
risks include, but are not limited to, the level of domestic capital spending by the oil and natural gas industry natural or man-made disasters and other external events that may disrupt our
manufacturing operations, volatility of oil and natural gas prices, changes in general economic and geopolitical conditions, large or multiple customer defaults including defaults resulting from
actual or potential insolvencies, technological advancements in well service technologies, competitive conditions in our industry, our ability to fully protect our intellectual property rights and
changes in the long-term supply of and demand for oil and natural gas. Should one or more of these risks or uncertainties occur, or should underlying assumptions prove incorrect, our actual
results and plans could differ materially from those expressed in any forward-looking statements.

You are cautioned not to place undue reliance on any forward-looking statements, which speak only as of the date of this presentation. Except as otherwise required by applicable law, we
disclaim any duty to update and do not intend to update any forward-looking statements, all of which are expressly qualified by the statements in this section, to reflect events or circumstances
after the date of this presentation.

This presentation includes financial measures that are not presented in accordance with generally accepted accounting principles ("GAAP"), including EBITDA and Adjusted EBITDA. While
management believes such measures are useful for investors, they do not have any standardized meaning and are therefore unlikely to be comparable to similar measures presented by other
companies. The presentation of non-GAAP financial measures should not be used as a replacement for, and should not be considered in isolation from, financial measures that are in
accordance with GAAP. Please see the Appendix for reconciliations of those measures to comparable GAAP measures.

Industry and Market Data

This presentation has been prepared by Solaris and includes market data and other statistical information from third-party sources, including independent industry publications, government
publications or other published independent sources. Although Solaris believes these third-party sources are reliable as of their respective dates, Solaris has not independently verified the
accuracy or completeness of this information. Some data are also based on the Solaris’s good faith estimates, which are derived from its review of internal sources as well as the third-party
sources described above.

Trademarks and Logos

Solaris owns or has rights to various trademarks, service marks and trade names that is uses in connection with the operation of its business. This presentation also contains trademarks, service
marks and trade names of third parties, which are the property of their respective owners. Solaris’ use or display of third parties’ trademarks, service marks, trade names or products in this
presentation is not intended to and does not imply, a relationship with Solaris or an endorsement or sponsorship by or of Solaris. Solely for convenience, the trademarks, service marks and
trade names referred to in this presentation may appear without the ©, ®, TM or SM symbols, but the omission of such references is not intended to indicate, in any way, that Solaris will not
assert, to the fullest extent under applicable law, its rights or the right of the applicable owner of these trademarks, service marks and trade names.

                                                                                                                                                                                                 2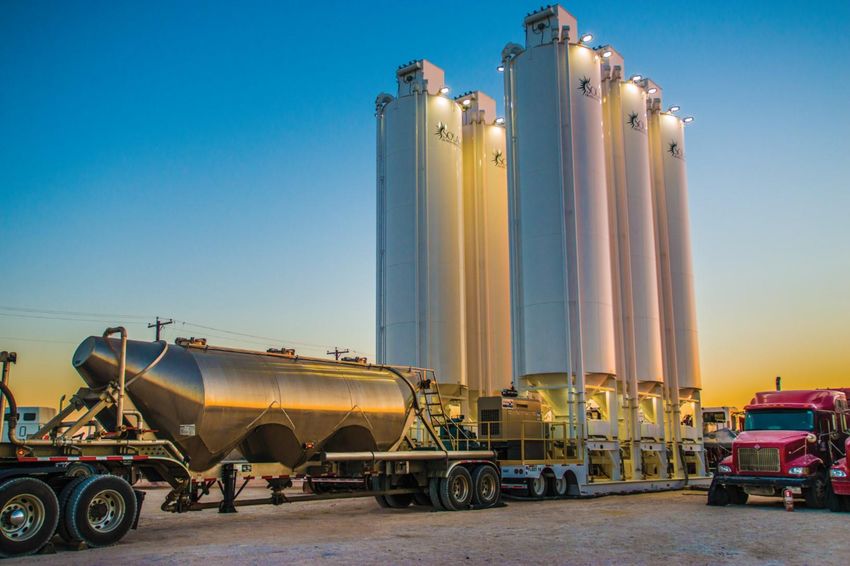
Solaris at a Snapshot
Investment Highlights
◼     Market Leader: Industry leading market share of ~1/3 maintained through                                                                                       Fluid
                                                                                                                                      Proppant
      the cycle                                                                                                                                                    Systems
                                                                                                                                      Systems
◼     No Debt, Excess Cash: No debt on the balance sheet with $1.00 per share
      cash balance as of June 30, 2021
◼     Thru-Cycle Dividends: Quarterly dividend of $0.105/share or ~5.6% yield;
      11th consecutive quarter of dividend payments; no dividend cuts made in the
      downturn
◼     Growth: New product introductions and continued innovation
◼     Inside Ownership: Management team members are mostly original
      founders and own ~15% of the company                                                                                                                    AutoBlend™
                                                                                                                                                       Integrated Electric Blender

Stock Info                                                                 Ownership (1)                                                     Uses of Cumulative FCF (3)

 Ticker                                           SOI (NYSE)

 IPO Date                                        May 11, 2017

 Market Cap(1)                                  ~$350 million

 Long-term Debt(2)                               $0.0 million

 Cash Balance(2)                                 $46.3 million

(1)    As of 9/8/21
(2)    As of 6/30/21                                                                                                                                                                 3
(3)    Reflects Cumulative Free Cash Flow (defined as Operating Cash Flow less Capital Expenditures) uses from 2019 through Q2 2021
Solaris Delivers Innovative Products & Solutions and
Comprehensive Services to the Industry

                         Innovative Products & Solutions                                       Comprehensive Services

                                               Mobile Fluid
   Mobile
                                               Management
  Proppant                                                                               Field Services
 Management                                     Systems
                                                                                         and Logistics
  Systems                                     (New Product
                                                Offering)

   Market Leader with ~1/3 Share of U.S.                 New Technologies                     Experienced Field Service Team
    Wellsite Proppant Storage Market              for Wellsite Chemicals and Water            Dedicated to Customer Support

  Hydrated
 Delivery and                                                                              Last Mile
                                               Inventory
  Blending                                                                                 Logistics
                                              Management
   System                                                                                 (Expanded
                                                Software
(New Product                                                                               Offering)
  Offering)

All-Electric, Automated Blending Technology
                                              Real Time Vendor-to-Blender Supply Chain            Turnkey Solution from
  Integrates With Solaris Sand, Water and
                                                     Metrics Help Minimize NPT                    Sand Mine to Blender
               Chemical Systems

                                                                                                                               4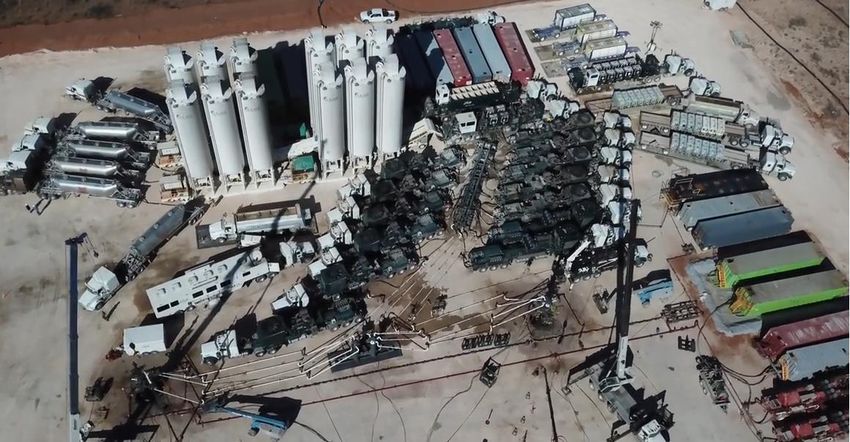
Solaris Has a Track Record of Innovation and Capital
Stewardship

Jul. 2015:                                                    2019:                                                     Mar. 2021:
First Mobile                      Dec. 2017:                  Enhanced                                                  Introduced
Proppant system                   Railtronix                  PropView® into                                            AutoBlend™
deployed                          acquisition                 Solaris Lens®                                             integrated e-blender

           Oct. 2015:                           Nov. 2018:                                     Downturn:                                Jul. 2021:
           Deployed                             Launched                                       Maintained $0.105/sh                     Signing first multi-year
           PropView®                            AutoHopper™                                    dividend and debt-free                   agreements with
                                                                                               balance sheet                            customers for new and
                                                                                                                                        existing technologies
                                                                         2020:
                        May 2017:                                        Built out Last Mile
                                                                         offering                                                                                  2H 2021:
                        IPO on NYSE
                                                                                                                                                                   Introduced belly-dump
                                                                                                                                                                   capable Top Fill system

                                                                                                                                      2021 – Future
                                                                          2019 – 2020
                   2015 – 2018                                                                                              Pursuing Growth through Disruptive
                                                              Producing Through-Cycle Returns While
              Bringing Order to Chaos                                                                                            Technologies & Inorganic
                                                                      Continuing to Innovate
                                                                                                                                       Opportunities

                                                                                      Solaris’ strategic priorities remain:

                                                                     ✓ Preserving and growing customer base with ongoing innovation while
                                                                                           maintaining strong returns
                                                                       ✓ Prioritizing total shareholder returns and maintaining the dividend
                                                                     ✓ Enhancing ESG and reducing well costs through increased automation
                                                                                          and new product offerings
                                                                                                                                                                                         5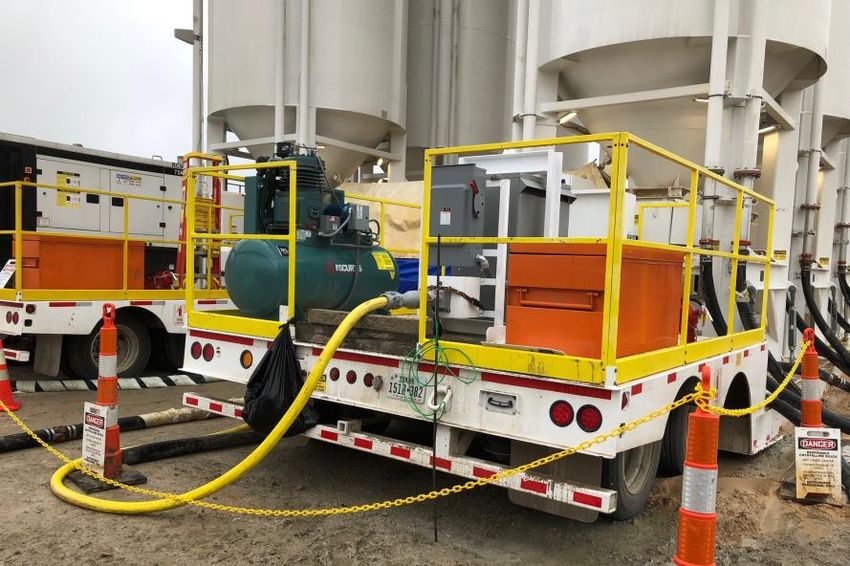
High Renewal Rates on a Diverse, Blue-Chip Operator and
Pressure Pumper Customer Base
Key Business Model Points                                                                                        Customer Stickiness(1)
◼   No long-term customer contracts historically but recently entered into a multi-
    year dedication agreement with a large customer that could provide upside over
    time

◼   High quality and diverse customer base with high renewal rates

◼   Solaris preferred by customers due to:

      ➢ Reliability of equipment and service, driving high (>99%) uptime                                                             Consistent
        performance                                                                                                                  customers
                                                                                                                                Avg Renewal Rate
      ➢ Ability to drive increased well site efficiency and lower costs
                                                                                                                                     ~94%
                                                                                                                                      85%

      ➢ Ability to handle large sand throughput per day

                            Select Operator Customers(2)                                                                         Select Service Customers

(1)   Defined as % of working days driven by customers who have been consistent customers over the last 5 quarters
(2)   Includes direct and indirect operator customers                                                                                                       6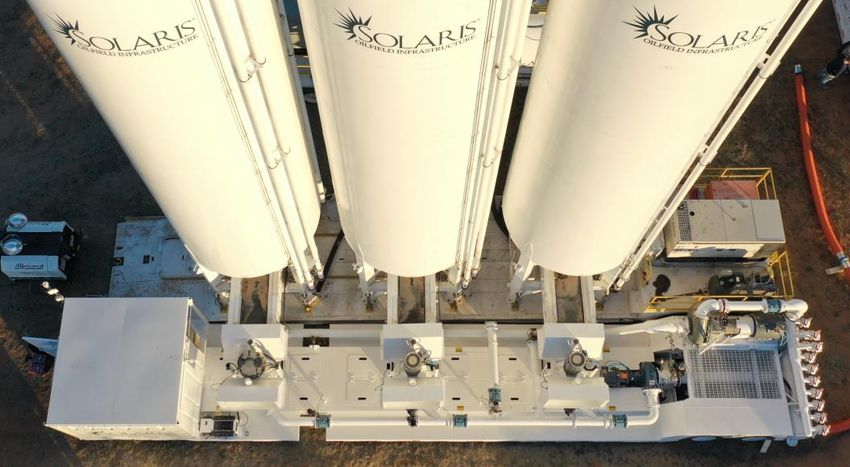
Solaris Has Maintained A Strong Market Position Throughout
the Cycle
Utilized Well Site Sand Storage Systems                                                                  Average Utilization Variances Suggest Technology/Service
by Technology Type(1)                                                                                    Differentiation(1,2)

 Source: Company data
 (1) Approximate average US frac fleet count used to estimate total addressable market for well site sand storage systems
 (2) Assumptions: 2021 YTD Avg Demand = 170 Avg Frac Fleets; Available Supply = 163 Avg SOI systems + ~250 box systems + >150 non-SOI silos + >200 SandKings

◼ Solaris
        increased share faster than other new technologies through 2019 as old technology (Sand Kings) were displaced and has since
 maintained a steady ~1/3 market share of US well sites

◼ Throughout   the recent cycle, Solaris equipment has maintained consistently higher utilization than its peer group, particularly vs other
 silo/vertical-based solutions

                                                                                                                                                               7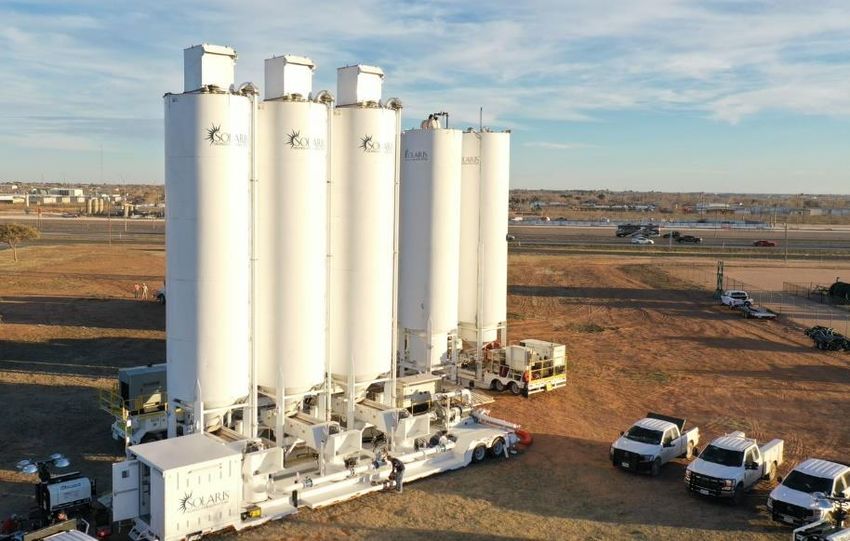
Solaris is Well Positioned to Take Advantage of
Recent Industry Trends
Recent Industry Trends                                          Frac Crews Continue to Pump More Sand per Day (MM lbs)

◼   Sand pumped per foot has leveled out, but horizontal
    footage per well and volumes pumped per day (i.e. frac
    efficiency) continue to improve

◼   Leading edge sand throughput is over 13mm lbs per day

◼   More operators trying out Simul Fracs/Dual Fracs

How Solaris Wins

◼   Reliability
     ➢ High uptime performance (>99%)
◼   Throughput optimization
     ➢ Ability to load from multiple, high-capacity trucks at
       once
     ➢ Vertical storage maximizes storage per square foot
◼   Innovation
     ➢ Automation/Machine Learning
     ➢ Data visibility and analytics
         • Solaris Lens® (ex. AWS enhancements)
         • Belt Scales
     ➢ Belly Dump capability
     ➢ New Products
        ➢ Water and chemical systems
        ➢ AutoBlend™ all-electric, automated hydrated
          delivery and blending system
                                                                  Source: Lium LLC                                       8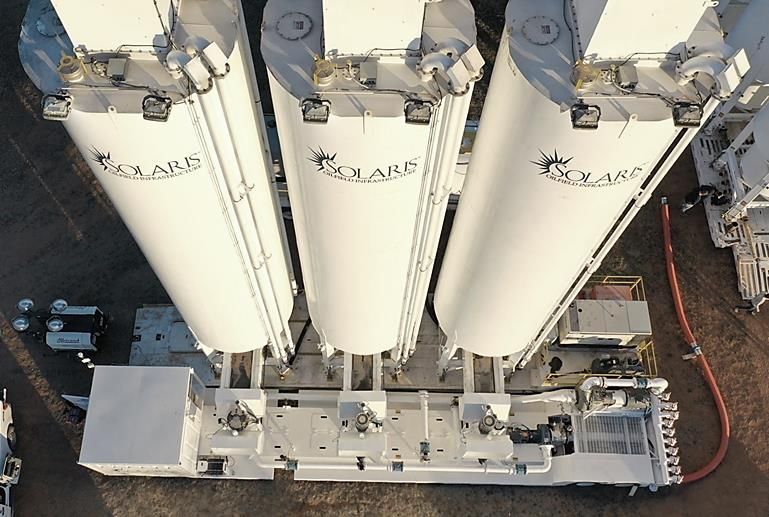
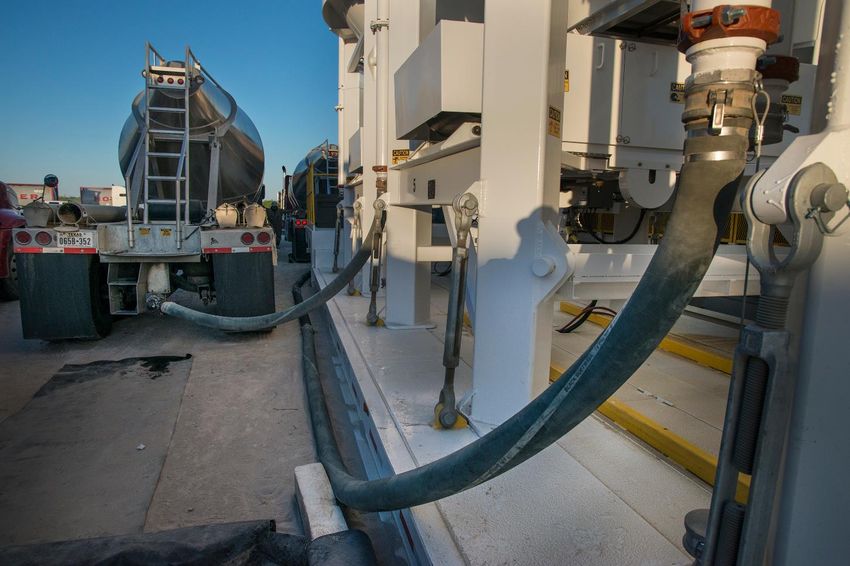
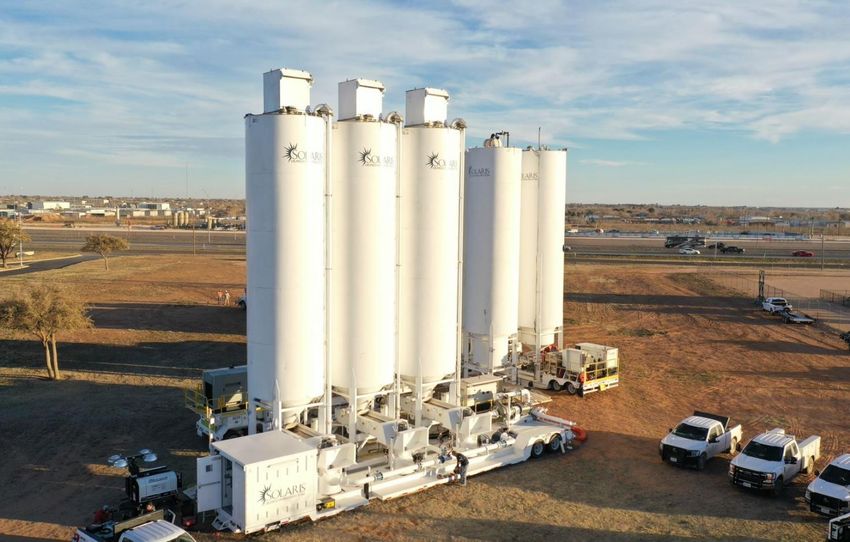
Solaris’ Mobile Proppant Management System
Elegant Solution to a Complicated Problem
◼   Simple, modern, fully-integrated and automated control system                     High-Capacity Throughput System
◼   Reliable system with high volume input and output capacity
◼   Mobile and flexible equipment with multiple redundancies
                                                                                                                 Pneumatic
       Supply Chain Savings                         Well Site Savings                                              Truck

      2.5 – 5mm lbs of on-site inventory        Increased inventory stage execution
                                                efficiency

                                                Built-in dust control
      24 truck offloading points

                                                Lower labor requirements
      Smaller truck fleet size required to
      deliver proppant                                                                          24 Offloading Points
                                                Proppant inventory loss savings                 (4 fill tubes per silo)
      Decreased truck demurrage
                                                Reduced fuel requirements
      Real-time inventory levels and
                                                Increased asset utilization
      consumption rates

Automated Control via AutoHopper™                                                     Flexibility to Use Belly Dump or Pneumatic Trucks

◼   Automatically controls pace
    of sand delivery from silos
    to blender

◼   Removes need for operator                                                              Offloading for
    to monitor hopper                                                                       Belly Dump
                                                                                               Truck
◼   Prevents sand spillage and
    reduces silica dust exposure

◼   Enables enclosure of
                                                                                                                             Enclosed System with
    blender hopper
                                                                                                                              Few Moving Parts
                                                                                                                             and Dust Suppression
                                                                                                                                                    9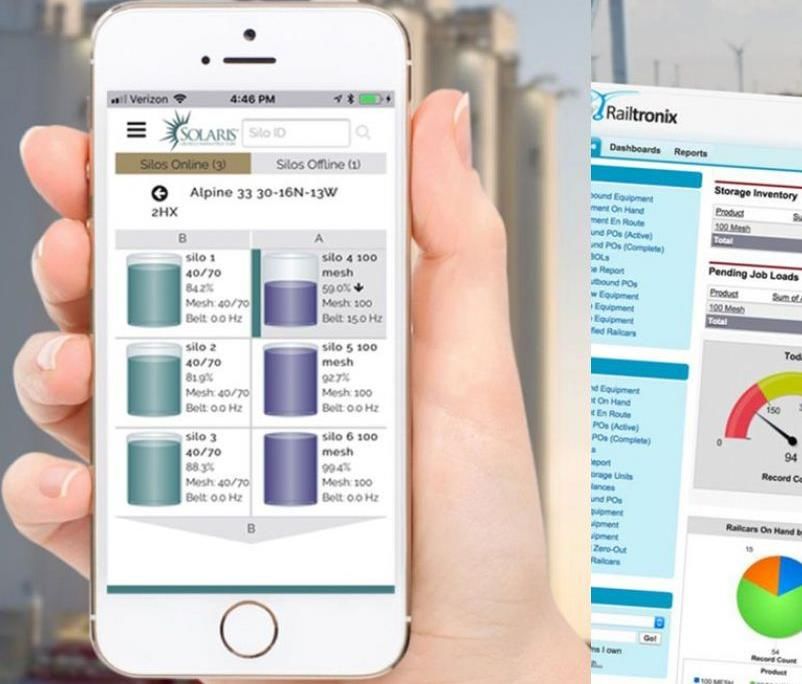
Business Model Reflects Low Portion of Total Well Cost,
Strong Uptime Performance
Monthly System Revenue as % of Well Costs                            Uptime Performance Provides an Insurance Policy

                                            SOI cost 99% Uptime
                                             Monthly Well Cost                                                      Performance Driven by:

                                                                                                             0.3%   1) Service Quality
                                                                                                                    2) Equipment Design

            E&P average cost
            of $6mm/well * 3                                                  99.7%
             Wells/Month =
             $18mm/Month

Characteristics of Specialized Equipment and Service
◼ Business model allows the customer to keep the benefits of efficiency gains. i.e. more wells/month completed by one frac crew using a
 Solaris system means monthly cost per well decreases

◼ Solaris
       systems are also similar to an insurance policy that costs
Solaris’ AutoBlend™: A Revolutionary Step-Change for Wellsite
Blending & Delivery
Traditional Technologies Are Challenged
◼ High frequency of non-productive time
◼ Multiple points of failure and transition points
◼ Manual operations
◼ Run on diesel engines with transmissions 3 independent blender
tubs
◼ Total life cycle R&M costs potentially higher than initial
investment
AutoBlend™ Drives Integration, Reliability and Savings
◼ All-electric
◼ Remote operations with real-time inventory visibility Remote Operation from the Safety of the
Data Van
◼ Up to 80% fewer personnel on low-pressure completions
operations, using full Solaris offering
◼ Three independent tubs add redundancy and can support the
intensity of complex completion designs
◼ Built-in dust control
◼ Eliminates T-belt, sand screws and blender hopper
◼ Compact wellsite footprint
11Bringing Order to Chaos… Again
Solaris’ Expanded Fluid Storage and Blender Offering
◼ Traditional technology takes up a massive footprint and headcount
➢ Fluids such as chemicals and water stored in multiple frac tanks, iso-containers and totes; water often requires additional pumps
➢ Blenders are failure-prone and a second or third blender is required for backup
◼ Solaris’ approach offers enhanced inventory control, condensed footprint, lower headcount, precise flow measurement and improved HS&E
Footprint reduced to a
handful of Solaris silos +
AutoBlend™ e-blender
12Digitalization of the Supply Chain
Solaris Lens®: Vendor to Blender Visibility
◼ Solaris
Lens® provides real-time inventory levels at every step of the “last mile” supply chain, with visibility both at the well site and
remotely via any browser or Solaris’ App
Mines/Transloads Trucking Well Site
13Solaris is Focused on Sustainability
Select ESG Highlights
Environment and Safety: Reduced Risk Through Automation and Design
◼ All-electric design. Solaris’ systems can use the same power source as electric frac fleets, eliminating the
need for diesel to run generators and reducing maintenance requirements.
◼ Increased Truck Efficiency = Reduced Emissions. Our system utilizes trucks with higher payload,
reducing the number of trucks on the road by ~15% compared to many competitors.
◼ Dust Control. Dust filtration at multiple points, with fines released back into the system, eliminating the
need for separate waste disposal and increasing safety for wellsite personnel.
◼ Automation and Software. AutoBlend™ blends and delivers proppant and fluids and can be controlled
remotely from the data van, potentially eliminating up to 80% of low-pressure wellsite personnel when used
with full Solaris offering. AutoHopper™ removes a person from high silica dust exposure area by using
machine learning to control sand delivery to the blender.
Social: Diverse Employee Group from Management to the Field
Supervisors &
Total Workforce Supervisors & Total Workforce
Female Employees Female Managers/Supervisors Minority Employees
Managers
Minority Managers/Supervisors
Managers
24% 21%
38% Female Minority
Female 50%
Minority
Governance: Strong Shareholder Alignment
◼ High inside ownership. Management owns about 15% of the company, with original founders still at the helm. Executive pay scale ranks very low relative to
industry peers as equity is the top incentive for management.
◼ Demonstrated capital discipline. Solaris reacted quickly to reduce capex and opex in the downturn. Solaris was one of the few oil service companies that
hasn’t cut its dividend.
14Thru-Cycle Dividend History
SOI Dividend History vs OFS Peers; 2/3 of Cumulative FCF to Date has
Quarterly Dividends Per Share Indexed to 1.00 (1) been Returned to Shareholders (2)
$0.150 1.20
$0.140
1.10
$0.130
1.00
$0.120
0.90 Balance sheet
$0.110 33%
Dividends
$0.100 0.80 41%
$0.090
0.70
SOI
$0.080
0.60 Share repurchase
$0.070 OFS Avg
26%
0.50
$0.060
$0.050 0.40
Q4 2018
Q1 2019
Q2 2019
Q3 2019
Q4 2019
Q1 2020
Q2 2020
Q3 2020
Q4 2020
Q1 2021
Q2 2021
Q3 2021
Q4 2018
Q1 2019
Q2 2019
Q3 2019
Q4 2019
Q1 2020
Q2 2020
Q3 2020
Q4 2020
Q1 2021
Q2 2021
Q3 2021
◼ SOI has paid a consistent dividend thru-cycle vs a 40% cut on average from the oil service group as a whole
◼ Every SOI employee is a shareholder and receives dividends with 15% of the stock owned by insiders
◼ Approximately $83 million returned to shareholders since December 2018
Source: Company data, Bloomberg as of 9/8/2021
(1) Oil service average includes dividend paying oil service companies: WHD, AROC, SLB, HAL, BKR, CLB, HP, PTEN 15
(2) Reflects Cumulative Free Cash Flow (defined as Operating Cash Flow less Capital Expenditures) 2019 through Q2 2021Focused on Operating Efficiency, Low Leverage and
Shareholder Returns
Operating Cash Flow as a % of EBITDA (1Q16-2Q21) SG&A as a % of EBITDA (1Q16-2Q21)
100% 140%
120%
80%
100%
60%
80%
60%
40%
40%
20%
20%
0% 0%
Peer Peer
Avg Avg
Gross Debt / TTM Adjusted EBITDA (2Q21) Dividend Yield
10.0x 6.0%
9.0x
5.0%
8.0x
7.0x
4.0%
6.0x
5.0x 3.0%
4.0x
2.0%
3.0x
2.0x 1.0%
1.0x
0.0x 0.0%
Peer Russell OIH S&P 500 10-year XOP XLE
Avg 2000 Treasury
Source: Company data and Bloomberg as of 9/8/2021
Note: Peer group includes WHD, WSC, HRI, URI, NEX, NINE, PUMP, SLCA, WTTR, BOOM and AROC. 16
NEX shown pro forma for C&J / Keane and WSC shown pro forma for MINI mergers by combining historical values.Solaris Investment Highlights
Market Leader: Industry leading market share of ~1/3 in well site sand handling equipment
No Debt, Excess Cash: No debt on the balance sheet with $1.00 per share cash balance as of June
30, 2021
Thru-Cycle Shareholder Returns: 11 consecutive quarterly dividends paid with no cuts; total of
$83 million returned to shareholders to date, including dividends and share repurchases
Growth: New product introductions, such as our AutoBlend™ Integrated Electric Blender and Top
Fill solution, and continued innovation in software and automation, provide growth potential
Inside Ownership: Management team members are mostly original founders and own ~15% of the
company
17Appendix
EBITDA and Adjusted EBITDA Reconciliation
                                                                                            T hree m onths ended,                                                          T welv e m onths ended Decem ber 31,

($ in 0 0 0 s)                                           June 30, 2021             March 31, 2021           Decem ber 31, 2020          Septem ber 30, 2020              2020                  2019                  2018

Net income (loss)                                                   ($1 ,87 0)                 ($1 ,925)                  ($2,841 )                 ($5,603)               ($51 ,093)             $90,360               $85,952
Depreciation and amortization                                          6,7 52                    6,693                      6,643                     6,594                   27 ,021               26,925                1 8,422

Interest (income) ex pense, net                                            55                        49                       1 98                        40                      1 62                  634                     37 4

Prov ision for income tax es (1 )                                       (21 7 )                    (21 3)                    (7 7 6)                    (843)                 (8,969)               1 6,936               1 2,961
EBIT DA                                                             $4,7 20                    $4,604                    $3,224                        $188               ($32,87 9)            $134,855              $117 ,7 09
                                       (2)
Stock-based compensation ex pense                                      1 ,353                     1 ,1 99                   1 ,003                    1 ,07 7                  4,7 35                 4,47 6                2,920
Loss on disposal of assets                                                 99                        18                        (1 1 )                     38                   1 ,440                   991                     1 53
Impairment loss                                                              -                          -                         -                         -                 47 ,828                      -                       -
Sev erance                                                                   -                          -                        5                         3                     547                    229                        -
Bad debt reserv e                                                        31 6                       283                        30                     1 ,246                   2,7 28                      -                       -

Transload contract termination (3)                                           -                          -                         -                         -                         -            (27 ,1 38)                (522)

IPO bonuses (4)                                                              -                          -                         -                         -                         -                    -                    896

Other (5)                                                                  10                        14                       603                       586                     1 ,1 93                    -                1 ,67 9
Adjusted EBIT DA                                                     $6,498                     $6,118                   $4,854                     $3,138                  $25,591              $113,413             $122,835

EBIT DA and Adjusted EBIT DA Margins:

EBITDA                                                               $4,7 20                    $4,604                    $3,224                       $1 88               ($32,87 9)            $1 34,855            $1 1 7 ,7 09
÷ Rev enue                                                            35,1 7 9                  28,669                    25,27 6                    20,531                 241 ,687              241 ,687              1 97 ,1 96
EBIT DA Margin                                                            13%                       16%                       13%                         1%                     -14%                  56%                   60%

Adjusted EBITDA                                                      $6,498                     $6,1 1 8                  $4,854                     $3,1 38                $25,591              $1 1 3,41 3           $1 22,835

÷ Rev enue                                                            35,1 7 9                  28,669                    25,27 6                    20,531                 241 ,687              241 ,687              1 97 ,1 96
Adjusted EBIT DA Margin                                                   18%                       21%                       19%                        15%                       11%                 47 %                     62%

(1)   Federal and state income taxes.
(2)   Represents stock-based compensation expense related to restricted stock awards.
(3)   Deferred revenue related to full termination of a sand storage and transloading agreement; no deferred revenue balance remained as of June 30, 2021.
(4)   One-time cash bonuses of $3,100 in 2017 and stock-based compensation expense related to restricted stock awards with one-year vesting that were granted to certain employees and consultants in connection with the
      Offering.
(5)   Includes costs related to the evaluation and pursuit of acquisitions, certain performance-based cash awards paid in connection with the purchase of Railtronix upon the achievement of certain financial milestones and
      write-off of certain prepaid and cancelled purchase orders in the three months and year ended December 31, 2020 and unamortized debt issuance costs in the year ended December 31, 2019 when the Amended and
      Restated Credit Agreement, dated as of January 19, 2018, was replaced in its entirety by the 2019 Credit Agreement.                                                                                                        19
System Rental and Service
Gross Margin Reconciliation
T hree m onths ended: T welv e m onths ended Decem ber 31,
($ in 0 0 0 s) June 30, 2021 March 31, 2021 Decem ber 31, 2020 Septem ber 30, 2020 2020 2019 2018
Sy stem rental and serv ice rev enue:
Sy stem rental 1 1 ,600 1 1 ,648 1 0,01 0 7 ,932 48,859 1 42,022 1 43,646
Sy stem serv ices 2,840 2,500 2,297 1 ,7 29 25,7 01 63,87 1 43,01 0
T otal sy stem rental and serv ices rev enue $14,439 $14,148 $12,307 $9,662 $7 4,560 $205,893 $186,656
Sy stem rental and serv ice operating costs:
Cost of sy stem rental 1 ,556 1 ,606 1 ,482 1 ,1 81 5,498 9,7 07 7 ,230
Cost of sy stem seriv ices 5,847 4,956 4,321 3,61 9 35,1 04 7 4,7 49 50,633
T otal cost of sy stem rental and serv ices $7 ,403 $6,562 $5,803 $4,800 $40,603 $84,456 $57 ,863
Sy stem rental and serv ice gross m argin $7 ,036 $7 ,586 $6,504 $4,862 $33,957 $121,437 $128,7 93
Sy stem rental and serv ice gross margin $7 ,036 $7 ,586 $6,504 $4,862 $33,957 $1 21 ,437 $1 28,7 93
÷ Sy stem rental and serv ice rev enue $1 4,439 $1 4,1 48 $1 2,307 $9,662 $7 4,560 $205,893 $1 86,656
Sy stem rental and serv ice gross m argin % 49% 54% 53% 50% 46% 59% 69%
20You can also read